Author: Jason

  • 100+ Important Technology Addiction Statistics 2025: A Deep Dive Into Our Digital Dependence

    100+ Important Technology Addiction Statistics 2025: A Deep Dive Into Our Digital Dependence

    Technology Addition Statistics

    Here are 100+ most Important Technology Addiction Statistics to help you in 2024 and beyond:

    Is your technology usage becoming an addiction?

    Technology has become like a trusty companion in today’s world. It connects, informs, and keeps us entertained like never before. But with all this constant connection comes a growing concern: technology addiction. Technology addiction is a pervasive and rapidly growing problem with alarming statistics that highlight its severe impacts on individuals, relationships, and society as a whole. This article dives deep into a collection of eye-opening statistics on alarming technology addiction, revealing the widespread nature of our digital dependence and its significant effects on individuals, our relationships, and even society as a whole.

    Technology Addiction Statistics ( Editor’s Pick)

    • Screens Rule Our Lives: A study suggests the average American adult spends a whopping 44 years staring at screens.
    • Phones Over People? A survey found that over half of people (54%) prefer their phones to spending time with their partner.
    • Younger Generations Hit Hardest: A 2022 survey in Russia showed younger people are more susceptible to device and internet addiction.
    • We Can’t Look Away: Americans check their phones a staggering 144 times a day on average.
    • Phone Anxiety is Real: A survey revealed that a majority of teens (77%) experience anxiety when separated from their phones.
    • We’re Hooked: A US survey found nearly half (48%) of internet users consider themselves addicted or somewhat addicted to their devices.
    • How Widespread is Addiction? Studies suggest internet addiction affects between 1% and 10% of the population, based on prevalence studies conducted in 2022.
    • 24 Hours Without a Phone? Unthinkable: Over half of Americans say they have yet to go a full day without their phone.
    • Family Feuds Over Screens: According to 31% of parents, screen time is a top cause of parent-teenager arguments.
    • Sleeping with Your Phone: A Qualtrics survey showed a whopping 79% of millennials sleep with their phones nearby, with over half (53%) waking up to check them at least once a night.

    Digital Dependency Statistics (Technology Addiction Statistics)

    1. Smartphones steal a huge chunk of our daily screen time, averaging over 4 hours a day for adults. (source).
    2. Smartphone use is a major risk factor for teen drivers. More than one in five teen drivers in car accidents were using their phones when the crash occurred. (source).
    3. Our online activity has become almost as time-consuming as sleep, with an average person spending 42% of their waking hours connected to the internet. (source). 
    4. The average UK citizen spends more time glued to screens than sleeping. (source).
    5. A third of us struggle to put our tech down. (source).
    6. Parents need help to limit their children’s technology use, with nearly half feeling their kids spend too much time on devices. (source).
    7. Nearly seven in ten (68%) American parents find themselves sidetracked by their phones when they’re with their kids. (source).
    8. Kids rack up an average of 44.5 hours of screen time each week. (source.)
    9. Adults in the US spend a staggering amount of time with their gadgets – over 6,259 hours a year. (source). 
    10. Technology is causing friction in our relationships, with many couples arguing about screen time. (source).
    11. Believe it or not, 4 out of 10 adults admit to checking their phones in the bathroom. (source).
    12. The average American adult will spend 44 years of their life staring at screens. (source).
    13. We can’t even resist checking our smartphones within minutes of waking up. (source).
    Technology Addiction Statistics
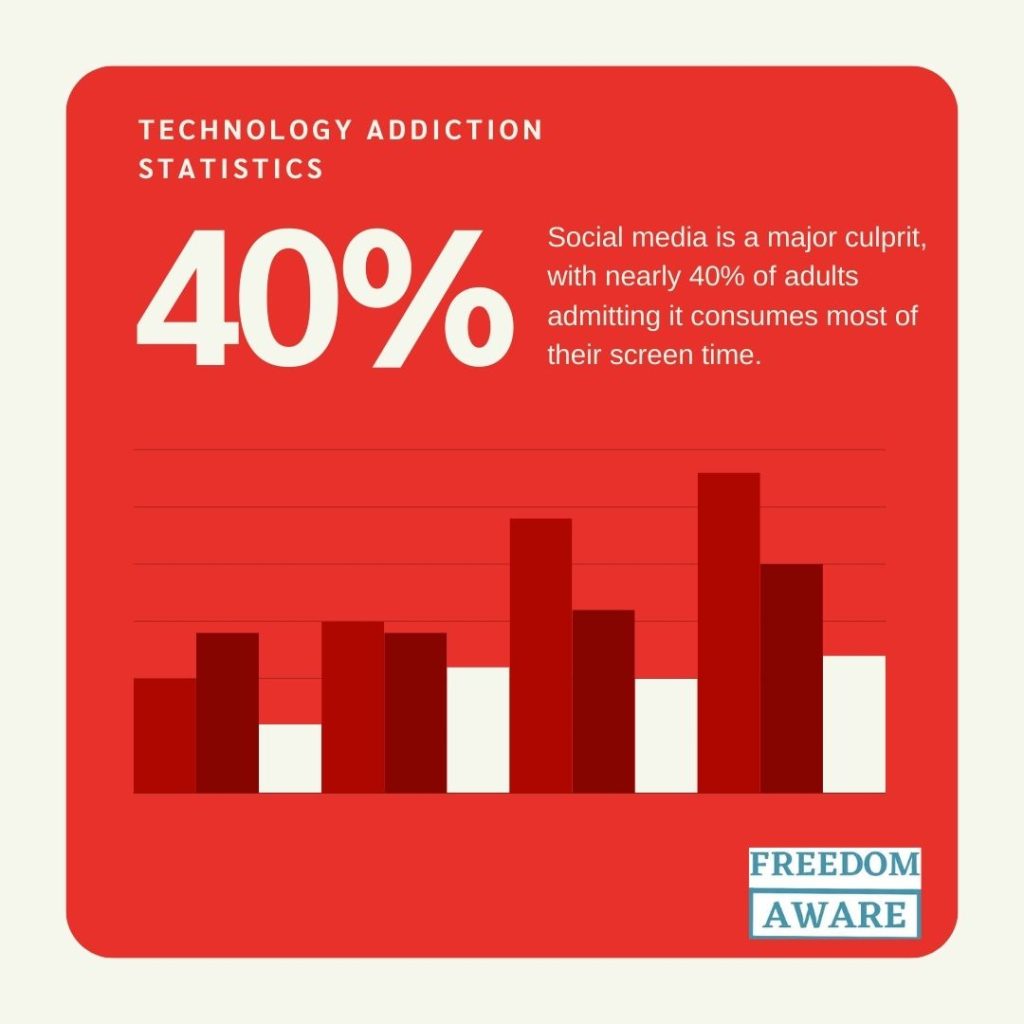
    1. Social media is a major culprit, with nearly 40% of adults admitting it consumes most of their screen time. (source).
    2. Watching TV and working are other common screen time activities, followed by online shopping. (source).
    3. Our eyes are suffering from all this screen time, with 70% of adults reporting eye strain. Yet, many of us don’t take breaks to rest our eyes. (source).
    4. We reach for our phones first thing in the morning, with most checking them within 10 minutes of waking up, and 60% doing so within 5 minutes. (source).
    5. On average, adults spend a significant amount of time watching TV, using laptops, and gaming each day. (source).
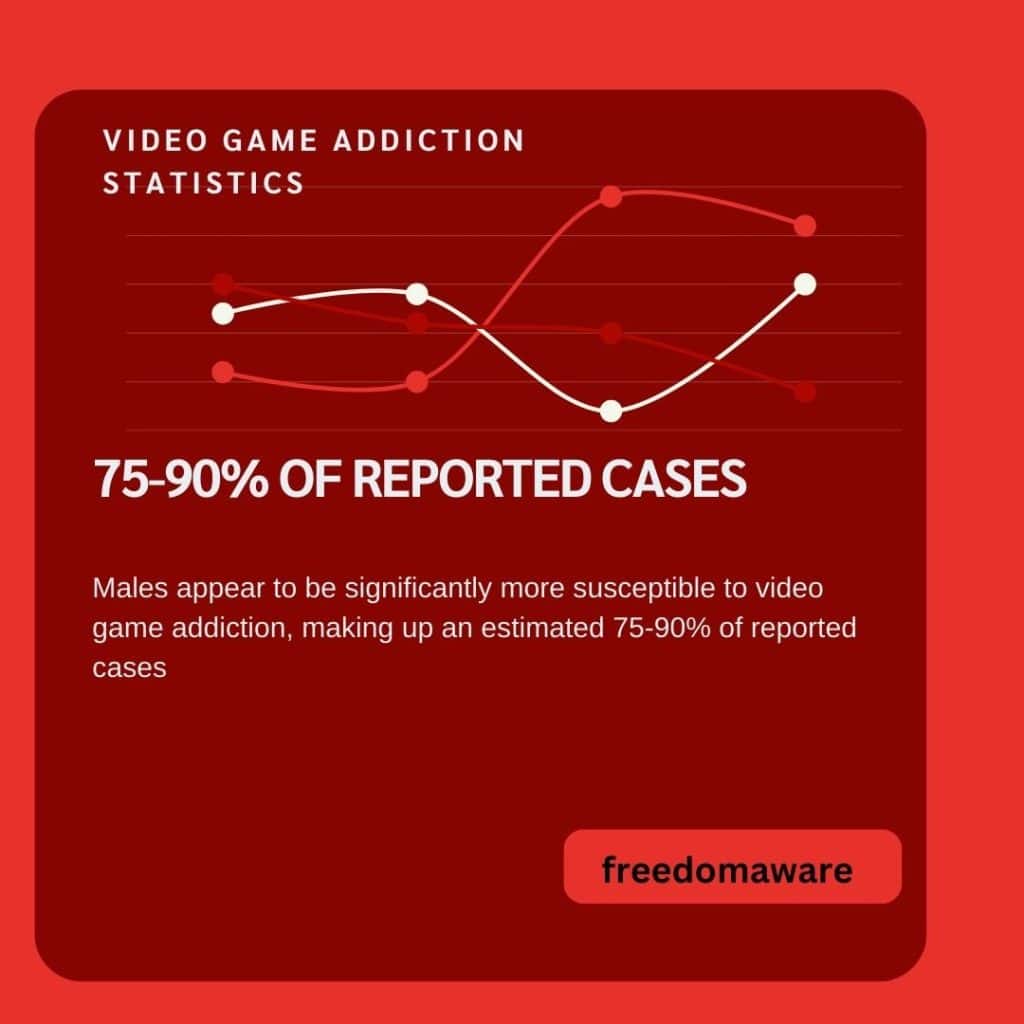
    6. Video games are particularly captivating, with roughly a quarter of teens feeling addicted. (source). This addiction is more prevalent in males.
    7. Teenagers are especially susceptible to smartphone addiction, with nearly half feeling hooked on their phones. (source).
    8. Nearly half of Americans consider themselves hooked on their devices. (source).
    9. It’s rude to check your phone while talking to someone, yet most of us do it. (source).
    10. People with more money struggle to disconnect from technology compared to those with less. (source).
    11. Most teenagers feel anxious without their phones, and many choose to sleep with them nearby. (source).
    12. Nearly half of teens (around 44%) struggle to disconnect from their devices, even when they know it is a good idea to take a break. (source).
    13. Muting your phone might backfire! Studies show that silencing notifications (no sound or vibrations) leads people to check their phones more often. (source).
    14. A December 2022 report by NDDC found that a concerning number of fatal crashes in the US involved distracted drivers using smartphones – somewhere between a quarter and a third. This translates to a tragic toll of over 3,100 deaths and more than 324,000 injuries. (source).

    Technology Addiction Statistics By Country

    1. Most Americans can’t resist their phones. A whopping 75% check their devices within just five minutes of getting a notification. (source). 
    2. Over a tenth of Americans (around 13%) believe they’d be significantly more productive without their smartphones around. (source).
    3. A  2019 survey in Poland found teenagers and young adults are especially prone to internet addiction. (source).
    4. South Korea takes the crown for smartphone ownership globally, boasting a staggering penetration rate of 98%. (source).
    5. A surprising study from Russia found that more than a third of people over 45 reported experiencing signs of addiction to their devices and the internet. (source).
    6. The internet is practically everywhere for UK adults, with a whopping 92% going online at home or on the go. From news and learning to fun and staying connected, the online world offers it all, blurring the lines between our physical and digital lives. (source).
    7. The internet is a constant presence for most Americans. A whopping 85% go online every day, with 31% practically living in cyberspace and another 48% checking their phones constantly. The remaining 6% join the digital world at least once daily. (source).
    8. In the U.K. the average person spends 8 hours and 41 minutes more time glued to their devices rather than sleeping, according to Ofcom’s 2023 Adults’ Media Use and Attitudes Report. (source).
    9. Nearly 99% of adults are online, the highest rate globally. (source).
    10. Canadians rack up nearly 8 hours and 20 minutes on social media every week. (source).
    11. A fifth of Brits (22%) admit to being hooked on TV, with a dedicated 7% saying they’re addicted. (source).
    12. Almost two out of five (37%) young French adults (18-34) freely admit they can’t resist their devices, they’re hooked. (source).
    13. Brits dedicate nearly 4 and a half hours (4 hours and 36 minutes) to online gaming each week. (source).
    14. Americans reign supreme when it comes to streaming movies, averaging a whopping 5 hours and 23 minutes glued to Netflix and other platforms every week. (source).
    15. More than half of Americans (57%) confessed their screen time ballooned by over an hour since the coronavirus lockdown. (source).
    16. Germans spend a significant chunk of their week glued to screens, averaging 5 hours and 19 minutes streaming videos and another 4 hours and 12 minutes on social media. (source).
    17. Among the countries analyzed Indonesia topped the list for daily smartphone usage, with users averaging 6.05 hours per day. This was significantly higher than Thailand (5.64 hours) and Argentina (5.33 hours). (source).
    18. The average Australian spends up to 9 hours and 14 minutes every week, after work. (source).

    Smartphone Usage Statistics (Technology Addiction Statistics)

    1. There are currently 6.84 billion smartphone users globally, which is projected to climb to an estimated 7.1 billion by the end of 2024. In other words, smartphone use is rising, with nearly 7.1 billion users expected by year’s end. (source).
    Technology Addition Statistics
    1. Nearly nine in ten (89%) Americans admit reaching for their phones within 10 minutes of waking up. (source).
    2. 12% of adults use their smartphones in the shower. (source).
    3. The average internet user checks their phone 58 times daily. (source).
    4. A third (33%) of adults who use smartphones find themselves on a date with their device rather than a real person. (source).
    5. More than a third (35%) of moviegoers admit to using their phones during the film. (source).
    6. Our phones are constantly calling, the average internet user picks theirs up a staggering 58 times a day. (source).
    7. A significant portion (37%) of users reported a surge in texting since the COVID-19 pandemic began, exceeding their texting habits before. (source).
    8. Average smartphone users touch their phone 2,617 times per day. This does not include the time spent locking the phone. (source).
    9. 87% of smartphone users check their phones less than an hour before going to bed. (source).
    10. Phone addiction can significantly impact health habits. A study found that roughly 30% of those struggling with phone addiction exhibit unhealthy lifestyles, marked by increased consumption of fast food and decreased physical activity. (source).
    11. In the United States, 15% of adults rely solely on smartphones for their internet access. This means they have a smartphone but lack a home broadband subscription. (source)
    12. Twenty-seven percent of parents feel they are addicted to their mobile devices, while nearly the same number of teens, 28%, believe their parents are addicted, according to the poll. (source).
    13. On average time spent on smartphones among users in 20 markets included in the analysis reached 4.37 hours per day in 2023. (source).
    14. Smartphones account for 70% of digital media time in the United States​. (source). 

    Social Media Addiction Statistics (Technology Addiction Statistics)

    1. Social media saw explosive growth in 2020, attracting an average of over 1.3 million new users every day. That’s like nearly 16 new users joining every single second. (source).
    2. Over 70% of adults from some countries use social media as a news source. These countries are the Philippines, Malaysia, South Africa, Kenya, and South Africa. (source).
    3. Two-thirds (63%) of Americans over 12 are on Facebook. (source).
    4. Social media use takes a toll on academic success for many young adults. A concerning 35.1% report suffering from poor academic performance due to their social media habits. (source).
    5. On average, individuals aged 16-24 spend about 2 hours and 50 minutes daily on social media, with higher usage linked to negative impacts on social well-being. (source).
    6. Nearly half (48%) of British teenagers who use social media platforms say they feel addicted to them. (source).
    7. More than half (55%) of drivers in the US confess to browsing social media behind the wheel, putting themselves and others at risk. (source).
    8. Overall, 34% of female internet users in the United States reported feeling addicted to social media. (source).
    9. Social media can be a paradox. It acts as a bridge aiming to connect us, yet research suggests it can also create a chasm of loneliness and isolation for those who spend too much time on it. (source).
    10. Facebook use emerges as a potential red flag in marital discord. Studies suggest it’s a factor in up to a third of disputes, potentially leading to divorce. This has spurred divorce lawyers to leverage social media data as evidence in court. (source).
    11. YouTube is the online video giant in the US, claiming a whopping 81% user base. (source).
    12. 40.6% of young adults complain their sleep has been affected by social media. (source ).
    13. Teenagers aren’t just seeking attention on social media – a study suggests “likes” trigger the same reward centers in their brains as getting money or enjoying chocolate. (source).
    Technology Addition Statistics
    1. The fear of missing out (FOMO) is a significant concern for young adults, with over a third (34%) experiencing it when they’re not on social media. (source).
    2. The cloak of anonymity offered by some platforms can create a breeding ground for harmful behavior, including cheating and sexual solicitation. (source).
    3. Social media presents a paradox for teens. While 80% feel more connected to their friends’ lives, a significant portion (38%) also grapple with overwhelming drama on these platforms. (source).

    Internet Addiction (Technology Addiction Statistics) 

    1. The COVID-19 pandemic saw a rise in problematic internet use, with about 33.37% of users developing unhealthy internet habits during this period​. (source).
    2. A study revealed that over 4% of the students met the criteria for internet addiction, with an additional nearly 29% at risk of developing it. (source).
    3. 30% of employers have dismissed employees due to inappropriate internet behavior, often related to excessive social media use and online gaming. (source).
    4. Close to half (40%) of the population is estimated to deal with an internet-related compulsive disorder. (source).
    5. Nearly half (43%) of users experienced a dip in self-esteem when their social media posts received no likes or comments. (source).
    6. According to a study published in the International Journal of Neuropsychiatric Medicine, roughly 1 in 8 (12.5%) of Americans experience problematic internet use. This number can be even higher in some countries, reaching up to 30%. (source).
    7. While we lack data on technology use by age, internet user demographics offer valuable insights. In 2019, the 25-34 age group dominated internet users at 32%, followed closely by 18-24 year olds at 18%. Adults aged 35-44 also formed a significant portion at 19%. (source).
    8. A concerning number of people (35%) have been victims of cyberbullying. (source).
    9. Research from the University of Michigan suggests that a significant number of people globally, roughly 210 million, struggle with addiction to social media and the internet. (source).
    10.  Image-based social media platforms like Instagram are significantly linked with body dysmorphia. (source).
    11. 9% of people have concealed their unnecessary internet activities from colleagues, friends, and relatives​. (source).
    12. A study in Malaysia found that internet addiction is a concern for Chinese ethnicity respondents, with 34% reporting symptoms. (source).
    13. A significant portion of users experience physical problems due to their internet habits. These impairments include insomnia (26.8%), daytime sleepiness (20%), and eye strain (19%). (source).

    Gaming Addiction (Technology Addiction statistics)

    1. The global video game community is thriving! With an estimated 3.09 billion active users, here’s a breakdown including projections for 2024 and yearly growth. (source).
    YearNumber of GamersIncrease Over Previous YearIncrease Over Previous Year (%)
    20152.03 billion
    20162.17 billion140 million↑ 6.9%
    20172.33 billion160 million↑ 7.37%
    20182.49 billion160 million↑ 6.87%
    20192.64 billion150 million↑ 6.02%
    20202.81 billion170 million↑ 6.44%
    20212.96 billion150 million↑ 5.34%
    20223.09 billion130 million↑ 4.39%
    20233.22 billion130 million↑ 4.21%
    20243.32 billion100 million↑ 3.11%
    Alarming Technology Addiction Statistics
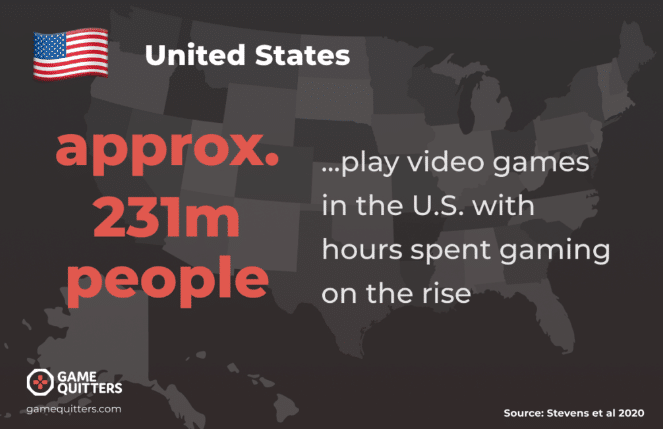
    1. In the US, with an estimated 150 to 231 million gamers and a worldwide gaming disorder prevalence of 1.96% to 3%, there could be up to 6.9 million people struggling with gaming disorder. (source).
    2. Studies indicate a higher prevalence of internet gaming disorder (IGD) among teenagers compared to teen females. (source).
    3. A significant portion of respondents (around one-third) reported marathon gaming sessions of five hours straight. This intense gaming behavior has increased by 13% compared to the 2020 survey. (source).
    4. Iran stands out with one of the world’s highest rates of video game addiction. A staggering 22.8% of the population is classified as addicted to various video games. (source).
    5. The global gaming community is booming! With over two billion active players currently, the industry is projected to reach a staggering three billion by 2023. (source).
    Technology Addition Statistics
    1. 90-99% of all American children play video games. (source).
    2. High smartphone ownership and internet use are hallmarks of Japanese society. However, this widespread digital access has led to a concerning trend: gaming addiction among youth. (source).
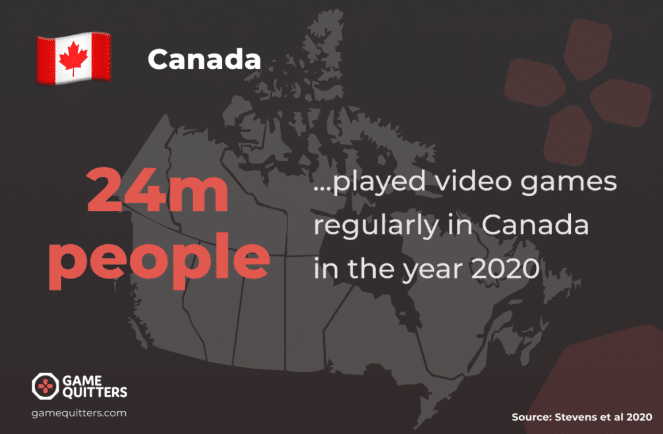
    3. A 2017 study conducted by CAMH (The Centre for Addiction and Mental Health) in Canada raised concerns about video game addiction among university students in Ontario. The research found that nearly 12% of students exhibited signs of problematic gaming behavior. (source). 
    4. A concerning trend in South Korea is the high prevalence of video game addiction. Research suggests that roughly 10% of the population may be addicted to video games. (source).
    5. 90% of gamers do not engage in behavior that is dangerous or has long-term consequences. (source).
    6. More than half of gamers (over 54%) sacrifice sleep due to their gaming habits. (source).
    7. The ease of access plays a role in the overlap between smartphone and video game addiction. With a vast library of gaming apps readily available, smartphones become a gateway to problematic gaming behavior. This is supported by the fact that 76% of users prefer mobile gaming. (source).
    8. The video game industry is a powerhouse, raking in nearly 347 billion U.S. dollars globally in 2022. Remarkably, mobile gaming reigns supreme, contributing a staggering 248 billion U.S. dollars to the total revenue. (source).
    9. A whopping 78% agree that playing online helps them forge new friendships and relationships. (source).

    Tech Use: Are You Crossing the Line? (Technology Addiction Statistics)

    Is your tech use becoming a problem? Here are some red flags to watch out for:

    • Hiding Your Habit: Do you feel guilty or ashamed about how much time you spend on your devices? Are you secretive or dishonest about your tech use with family and friends?
    • Tech Before All Else: Is your mental health suffering because of your tech habits? Do you experience increased anxiety, stress, depression, or irritability when you can’t use your devices?
    • Tech as a Crutch: Do you rely on technology to feel good? Do you ever turn to electronic devices to feel better, feel more awake, or avoid dealing with things?
    • The Need for More: Do you feel like you’re spending increasingly more time on your devices lately?
    • Losing Interest in Life: Have your favorite hobbies or social activities fallen by the wayside because of your tech use?
    • Knowing the Harm, Ignoring the Alarm: Are you aware of the negative consequences of your tech habits, but continue using devices anyway?
    • The Urge to Use: Do you experience cravings or strong urges to use your devices, even when you know you shouldn’t?
    • Risky Tech Use: Do you put yourself or others at risk by using your devices in dangerous situations, like driving or walking in traffic?

    Why We Can’t Resist These Technology Tools (Technology Addiction Statistics)

    • The Internet:  The vast amount of information feeds a cycle of wanting to know more, keeping us hooked. We can now reach the internet from nearly anywhere, through computers, tablets, phones, and even watches. The fear of missing out (FOMO) is a common problem for young people who feel pressure to stay constantly connected. Social media platforms like Facebook can also become a crutch for those struggling with anxiety or depression. The internet is both easy and rewarding to use, making it hard to resist.
    • Video Games: We naturally crave feelings of competence, independence, and connection. Challenging video games provide players with a sense of accomplishment. They also offer a wide range of choices, giving teens a feeling of control they might lack in other areas of life. Just like success in the real world, video games allow players to accumulate virtual wealth and prestige, which can translate into a kind of real-world recognition. Gamers can also connect with others who share their interests through online forums and communities. Similar to the internet, games are readily available on smartphones, keeping them constantly within reach. While games can offer social connection, they can also serve as an escape into a fantasy world where players can adopt new identities.
    • Mobile Devices: These highly portable devices allow us to stay connected constantly. Smartphones, tablets, and other smart devices like smartwatches eliminate the need for a traditional computer, making it easier than ever to stay connected and complete tasks.
    • Social Media: Social media platforms present personalized information in a user-friendly way, like a customized newsfeed or curated list of followers. Whether it’s a video call with family or a comment on a celebrity’s post, social media fulfills our need for human connection by allowing us to interact with people who might be far away. As social creatures, we crave connection for our emotional and mental well-being. Social media’s appeal lies in its ability to meet these needs without the effort or limitations of face-to-face interaction.
    • The Growing Gamble: Online gambling is another red flag. With a wider range of betting apps and games readily available, and even gambling features integrated into online gaming, the ease of access is raising concerns. While gambling addiction isn’t new, having it just a tap or click away is a whole new ball game. (See more on Gambling Disorder)
    • Retail Therapy Gone Wrong: Online shopping addiction, or online shopping/auction addiction, is the urge to compulsively shop online, even when it causes harm and disrupts your life. People with this addiction can’t resist the impulse to buy, leading to negative consequences.
    • Clicking into Trouble: Problematic online pornography use describes the compulsive viewing of online sexual content that negatively affects your relationships and mental health.

    How does technology addiction affect mental health? (Technology Addiction Statistics)

    Technology addiction can have profound effects on mental health, often leading to a range of psychological issues that can significantly impair an individual’s quality of life. Some of the most common mental health impacts of technology addiction include:

    1. Anxiety: Constant connectivity and the fear of missing out (FOMO) can lead to heightened anxiety levels, as individuals feel compelled to check their devices frequently for updates, messages, or notifications.
    2. Depression: Excessive use of technology, particularly social media, can contribute to feelings of inadequacy, isolation, and depression. Comparing oneself to others and seeking validation through likes and shares can create a cycle of negative self-talk and low self-esteem.
    3. Sleep disturbances: The blue light emitted by screens can interfere with the body’s natural sleep-wake cycle, leading to insomnia, irregular sleep patterns, and poor sleep quality. Lack of restorative sleep can exacerbate existing mental health issues and contribute to cognitive decline.
    4. Impaired social skills: Overreliance on technology can result in diminished face-to-face social interactions, leading to difficulties in forming and maintaining healthy relationships. This can further contribute to feelings of loneliness and isolation.
    5. Cognitive decline: Prolonged exposure to digital devices can negatively impact attention span, memory, and problem-solving abilities. The constant barrage of information and the need for instant gratification can hinder the development of critical thinking and decision-making skills.
    6. Emotional dysregulation: Technology addiction can interfere with an individual’s ability to regulate their emotions, leading to impulsivity, irritability, and mood swings. This can further contribute to the development and exacerbation of mental health issues.

    As technology continues to permeate our daily lives, it is crucial to recognize the potential mental health impacts of addiction and seek strategies to maintain a healthy balance between our digital and real-world experiences.

    How to Prevent and Treat Tech Addiction (Technology Addiction Statistics)

    • Breaking the Cycle: Set clear limits on your screen time each day or week, and stick to them! This will help you reclaim control of your time.
    • Unplug and Recharge: Make time for activities that don’t involve screens. Spend time with loved ones, exercise, or rediscover old hobbies. Give your mind and body a break!
    • Knowledge is Power: Learn about the potential downsides of excessive tech use, especially for younger people. Raise awareness about the risks and consequences.
    • Be Tech Savvy: Develop healthy digital habits. Learn how to use technology safely and responsibly. Identify and avoid behaviors that might lead to addiction.

    Breaking Free: Treatment Options (Technology Addiction Statistics)

    • Talk it Out: Cognitive Behavioral Therapy (CBT) can help you identify and change negative thoughts and behaviors around technology use. A therapist can guide you through this process.
    • Find Your Tribe: Support groups offer a safe space to share your experiences and learn from others struggling with tech addiction. You’re not alone!
    • Help at Your Fingertips: Many online resources can help, including self-help websites and apps. Find tools and guidance to support your journey towards healthier tech habits.
    • Considering Medication: In some cases, medication might be prescribed to manage anxiety or depression that could be contributing to your tech addiction. A healthcare professional can advise you on this.

    Conclusion (Technology Addiction statistics)

    There’s no one-size-fits-all solution. The best treatment plan for you will depend on your individual needs. Consider seeking professional help from a therapist or counselor specializing in technology addiction treatment. They can create a personalized plan to help you regain control of your tech use.

  • 61 Omnichannel Marketing Statistics In 2025 That Will Blow Your Mind

    61 Omnichannel Marketing Statistics In 2025 That Will Blow Your Mind

    Omnichannel Marketing Statistics

    Here are 61 Omnichannel marketing statistics to help you in 2025 and beyond

    What is Omnichannel? (Omnichannel marketing statistics)

    In today’s digital age, customers expect a seamless and personalized experience across all touchpoints of their buying journey. This is where omnichannel comes in.

    Omnichannel refers to a multi-channel approach to marketing, selling, and serving customers in a way that creates a seamless and integrated customer experience. It involves providing a consistent and personalized experience across all channels, including websites, mobile apps, social media, email, chat, and brick-and-mortar stores.

    The goal of omnichannel is to create a seamless and integrated customer journey that meets the needs and expectations of customers, regardless of the channel they choose. This approach recognizes that customers may use multiple channels during their buying journey and aims to provide a consistent and personalized experience across all of them.

    By implementing an omnichannel strategy, businesses can improve customer satisfaction, increase loyalty, and drive revenue. In fact, according to a study by Harvard Business Review, companies with omnichannel customer engagement strategies retain on average 89% of their customers, compared to 33% for companies with weak omnichannel customer engagement.

    Omnichannel Marketing Statistics

    1. Focus on Customer Experience: Omnichannel retail is all about creating a smooth and unified shopping journey for customers, no matter how they choose to interact with your brand – in-store, online, or mobile.
    2. Breaking Down Silos: Omnichannel retailing breaks down barriers between different sales channels. It ensures a consistent experience for customers, whether they’re browsing online or visiting your physical store.
    3. A Unified Shopping Journey: Think of omnichannel retail as creating a single, seamless shopping experience for your customers. They can seamlessly transition between online browsing, mobile app purchases, and in-store interactions.

    Highlights of Omnichannel Marketing Statistics:

    Omnichannel Marketing Statistics
    1. 59% of shoppers research on Google before buying in-store. Businesses need a strong online presence and search visibility to reach them early. (Source)
    2. Multichannel engagement boosts loyalty (89% retention). Weak channels lead to churn (33% retention). (Source)
    3. Omnichannel vs. Siloed: 90% of customers crave a smooth experience. Embrace omnichannel or risk falling behind. (Source)
    4. Heads up, retailers! 85% of online shoppers switch devices mid-purchase. Optimize your cross-device experience. (Source)
    5. As of 2022, the total value of the global omni-channel market is estimated to be $5.57 billion, and it is projected to grow at a compound annual growth rate (CAGR) of 14.53% from 2022 to 2029. (Source)
    6. Omnichannel vs. Single Channel: See a 287% jump in purchase rates by implementing a multi-channel marketing strategy. (Source)
    7. Most marketers, or 92%, use multiple channels in their marketing efforts to achieve better results. This indicates that an integrated, cross-channel approach has become a standard best practice in the marketing industry. (Source)
    8. During a survey of 1000 shoppers, it was found that more than half, or 57%, admitted to accessing a retailer’s website or mobile app while physically present in the store. This behavior, often referred to as “webrooming,” highlights the importance of a consistent and integrated online experience for retailers. (Source)
    9. Implementing an omnichannel marketing strategy can significantly improve customer retention rates compared to a single-channel approach. Specifically, businesses using omnichannel marketing have been found to have a 90% higher customer retention rate than those using only one channel. (Source)
    Omnichannel Marketing Statistics
    1. During a study of traditional brick-and-mortar stores, it was found that nearly 40% of customers had used a mobile device to assist with their shopping journey before making a purchase in-store. This behavior, known as “showrooming,” highlights the importance of a strong mobile presence and the integration of digital channels into the in-store experience for retailers. (Source)
    2. Boost revenue and win customer loyalty with omnichannel: Businesses that embrace this approach are 3 times more likely to see a significant revenue jump and 4 times more likely to experience consistently high levels of customer satisfaction and loyalty compared to those that don’t. (Source)
    Omnichannel Marketing Statistics
    1. A survey of customers revealed that only 7% identified as exclusive online shoppers, while a larger proportion, or 20%, identified as exclusive store shoppers. However, most customers, or 73%, preferred to shop through omnichannel options that integrate both online and offline channels. (Source)
    2. According to a survey of e-commerce companies in Europe and North America, nearly half, or 47%, agreed that an omnichannel marketing campaign is a significant factor in their marketing strategy. This suggests that omnichannel marketing is a growing trend and a key consideration for businesses in these regions. (Source)
    3. A significant majority of customers, or 69%, expect a uniform and uninterrupted brand experience across various digital and in-person channels. This highlights the importance of consistent and cohesive content and messaging in building a strong and recognizable brand identity. (Source)
    4. A substantial proportion of customers, or 77%, are more inclined to increase their spending with brands that they feel comfortable and at ease with. This suggests that building a positive and trusting relationship with customers can have a significant impact on their purchasing behavior and loyalty. (Source)
    5. Three significant challenges in implementing an effective omnichannel marketing strategy are restricted access to data, inaccurate marketing attribution, and violations of customer privacy. These challenges highlight the importance of investing in robust data management systems, implementing transparent and ethical marketing practices, and prioritizing customer trust and security to execute an omnichannel marketing strategy successfully. (Source)
    6. Mobile Shopping Boom:  Over half of internet users prefer to shop on their phones, and nearly 80% have made a mobile purchase in the past six months. The message is clear: mobile commerce is taking over! Businesses that optimize the mobile shopping experience are sure to win. (Source)
    7. Omnichannel personalization is gaining ground: A 2021 survey shows that 35% of businesses have successfully implemented it. This is promising, but there’s significant room for future growth and innovation in creating seamless, personalized customer experiences. (Source)
    8. Digital Sales Boom: B2B buyers are driving demand! A significant 20% are willing to invest heavily, creating a major opportunity for digital sales solutions. (Source)
    Omnichannel Marketing Statistics
    1. Forget Siloed Marketing: A whopping 80% of B2B marketers believe omnichannel is the key to success.(Source)
    2. Focus on mobile commerce growth: Mobile commerce is on the rise! Projections suggest it will account for a whopping 40.4% of all e-commerce sales by 2024. (source)
    3. Focus on the rise of mobile payments: The way we pay is changing! By 2025, mobile transactions are expected to reach 10.4% of all retail purchases. (source)
    4. Emphasize customer journey: Forget channel silos! Omnichannel marketing creates a unified customer journey. Customers can move between online and offline touchpoints with ease, ultimately leading to a purchase. (source)
    5. Highlight channel fluidity: Forget channel barriers! Omnichannel marketing creates a frictionless experience. Customers can hop between different touchpoints (website, social media, app) with ease, ensuring a smooth path to purchase. (Source)
    6. Smart omnichannel engagement pays off in a big way: Businesses that prioritize it achieve a remarkable 9.5% annual revenue increase, compared to just 3.4% for those struggling with omnichannel strategies. (Source)
    7. Focusing on efficiency: Omnichannel marketing makes you more efficient! According to research, solid omnichannel strategies can lead to a 7.5% decrease in yearly cost per contact. (Source)
    8. Highlighting the gap: The omnichannel opportunity gap is wide! Despite its benefits, research shows only 11% of organizations claim to have a well-developed omnichannel strategy in place. (Source)
    9. Focus on the data gap: Data silos hinder omnichannel success! Only 48% of less effective omnichannel companies collect customer data across various channels, compared to a stellar 77% for high performers. (Source)
    10. Highlight the dramatic increase: Multi-channel marketing is a game-changer! Companies that leverage three or more channels see their order rates skyrocket by a staggering 494%. (Source)
    11. Omnichannel results that speak for themselves! Target’s 2020 performance is a testament to the effectiveness of omnichannel retail. Their sales grew by 24.3% overall, with digital sales experiencing a phenomenal 195% increase. (Source)
    12. Target’s stores: the hidden heroes of online sales! Interestingly, during this period, Target’s physical stores fulfilled over 75% of their online orders, showcasing the crucial role stores play in their omnichannel strategy. (Source)
    13. Omnichannel marketing is a sales powerhouse! Compared to single-channel campaigns, it can boost your purchase rate by a staggering 287%. (Source)
    14. Focusing on pre-shopping research: Online inventory checks are a popular trend! A significant portion of shoppers (46%) do their research online before visiting a store in person. (Source)
    Omnichannel Marketing Statistics
    1. Omnichannel experiences unlock bigger customer wallets! Customers who experience a seamless journey across all your channels spend a significant 13% more than those limited to a single channel. ( Source)
    2. Focusing on the importance of personalization: Personalization is no longer an option, it’s a necessity! 71% of customers expect brands they engage with to deliver a personalized experience. (Source)
    3. Highlighting the financial benefits: Personalization pays off! Businesses that prioritize creating a personalized customer experience see their revenue soar by 40% compared to those that don’t. (Source)
    4. Startups are considerably more likely (55% vs. 38%) to have a digital business strategy in place compared to traditional companies. (Source)
    5. When it comes to prioritizing digital-first approaches, services (95%), financial services (93%), and healthcare (92%) are at the forefront. ( Source)
    6. Most companies (nearly 77%) report a positive relationship with technology. (Source)
    7. Two-thirds (65%) of companies express confidence in their ability to handle technological disruptions in the next three years. (Source)
    8. Over half of CEOs (56%) credit digital improvements for revenue growth. (Source)
    9. 53% of retail brands use tools to ease their selling experience. (Source)
    10. In light of seamless interactions across multiple channels, 47% of consumers acknowledge that they would want to check out online and still return in-store. (Source)
    11. US livestream viewers (44%) buy 3-4 clothing/shoe/accessory items per show, showing strong sales potential. (Source)
    12. Customers expect seamless experiences across channels (90%). (Source)
    13. Disappointing Results: Just 16% of employees believe their company’s digital transformations are effective and sustainable. (Source)
    14. Top priorities for executives: Revenue (24%) and Net Promoter Score (23%) reign supreme as the most tracked customer experience metrics. (Source)
    15. Cloud Opportunity: Only 36% of contact centers have adopted cloud solutions. There’s room for significant growth! (Source)
    16. Humans and AI: A winning team! Nearly 70% of global business leaders believe the future of business is collaborative. (Source)
    17. The AI Assistant Boom: 80% of businesses are embracing AI chatbots, already implemented or planned for by 2020. (Source)
    18. Omnichannel shoppers are worth 30% more:  Businesses that cater to customers across multiple channels can expect a significant boost in customer lifetime value compared to those relying on single channels. (Source)
    19. Returns aren’t all bad news!  Sure, they can be a hassle, but here’s the upside: 80% of in-store returners put their refund right back into your store!  And in some cases, they spend up to 10 times more than online-only shoppers. (Source)
    Omnichannel Marketing Statistics
    1. Shoppers want online info and in-store finds:  Over half of shoppers research online before buying in-store.  To avoid frustrating out-of-stock situations, make sure your online inventory reflects reality.  Seamless data syncing is key – don’t send them on a wild goose chase. (Source)
    2. Zara’s fashion win: Omnichannel scores big!  By integrating digital and physical stores in Q2 2020, Zara saw their online sales soar nearly 75% in the first half of the year. Talk about a successful omnichannel strategy. (Source)
    3. Adidas click and collect surprise: They underestimated demand BIG TIME. Aiming for low sales in 2015, they were shocked with a whopping 1,000 orders in the first week!  The program was so popular they initially ran out of stock and had to relaunch a few years later. (Source)
    4. Seamless Shopping at Oasis!  This UK fashion retailer takes convenience to the next level.  Forget the hassle of searching for a salesperson or waiting in line.  Oasis equips their staff with iPads that show real-time inventory and product details and even act as a mobile checkout. So you can find what you love, get expert advice, and pay instantly – all on the spot. (Source)
    5. Forget Generic Marketing! Personalization Delivers 5-8x ROI & 10%+ Sales Growth. (Source)
    6. Win-Win with Data Sharing:  Consumers (90%) are happy to share data when it leads to lower prices and easier shopping. It’s all about value. (Source)
    7. 53% of retail brands use tools to ease their selling experience. (Source)
    8. Get Personal, Get Sales!  Shoppers crave personalization: More than ¾ say they’re more likely to buy from brands that tailor their experience. ( Source)
    9. Personalization Drives Loyalty:  A whopping 78% of customers who experience personalized interactions are more likely to buy again. (Source)

    To create an effective omnichannel strategy, businesses need to consider the following (Omnichannel marketing statistics):

    1. Customer Research: Understand your customers’ needs, preferences, and behaviors across all channels. This can be done through surveys, focus groups, and analytics.
    2. Channel Integration: Ensure that all channels are integrated and provide a consistent and personalized experience. This involves integrating data, systems, and processes across all channels.
    3. Personalization: Personalize the experience for each customer based on their preferences, behaviors, and history. This can be done through segmentation, targeting, and automation.
    4. Measurement: Measure and track the effectiveness of the omnichannel strategy. This can be done through metrics such as customer satisfaction, loyalty, and revenue.

    A Real-World Omnichannel Marketing Case Study (Omnichannel Marketing Statistics): 

    Warby Parker’s Success Story

    Warby Parker, a prescription eyewear company, is a prime example of a successful omnichannel marketing strategy. The company started as an online-only retailer in 2010 and has since expanded its presence to include brick-and-mortar stores, mobile apps, and social media platforms. Here’s how Warby Parker has effectively implemented an omnichannel marketing approach:

    1. Consistent Branding: Warby Parker maintains a consistent brand image and voice across all channels, ensuring that customers receive a seamless experience regardless of the platform they choose to engage with.
    2. In-Store Technology: The company has integrated technology into its physical stores to enhance the customer experience. For instance, the “Home Try-On” program allows customers to select up to five frames to try on at home, and the “Virtual Try-On” feature on their mobile app uses augmented reality to let customers “see” how different frames would look on their faces.
    3. Social Media Engagement: Warby Parker actively engages with its customers on social media platforms, sharing user-generated content, responding to customer inquiries, and promoting special offers and events.
    4. Personalized Customer Experience: The company uses customer data and preferences to provide personalized recommendations and offers, both online and in-store.
    5. Seamless Integration: Warby Parker’s online and offline channels are seamlessly integrated, allowing customers to easily access their purchase history, track orders, and manage returns and exchanges.

    By implementing a well-executed omnichannel marketing strategy, Warby Parker has managed to create a cohesive and engaging customer experience that has contributed to its rapid growth and success. 

    Overall, omnichannel is a powerful approach to marketing, selling, and serving customers in today’s digital age. By implementing an effective omnichannel strategy, businesses can improve customer satisfaction, increase loyalty, and drive revenue.

    Conclusion

    Omnichannel marketing isn’t just a trend; it’s a game-changer. By creating a seamless customer experience across all channels, you can boost engagement, loyalty, and ultimately, sales.

    Here’s your action plan:

    • Dive into the data: We’ve shown you key statistics on mobile shopping, personalization, and the success of omnichannel leaders like Starbucks. Use this information to inform your strategy.
    • Break down the silos: Ensure your marketing efforts are unified and consistent across all platforms (mobile, social, email, etc.). Invest in data management systems to get a complete customer view.
    • Personalize the journey: Tailored experiences resonate with customers. Implement personalization strategies to keep them engaged and coming back for more.
    • Measure and adapt: Use data analytics to track campaign performance and identify areas for improvement.

    Remember, successful omnichannel marketing is about building trust and exceeding customer expectations. By following these steps, you can unlock the full potential of this powerful strategy and watch your business thrive.

    .

  • 70+ Important Internet Safety Statistics & Facts To Guide You in 2025

    70+ Important Internet Safety Statistics & Facts To Guide You in 2025

    Internet safety statistics

    Here are some really important internet safety statistics to guide you in 2025 and beyond;

    The Double-Edged Sword of the Internet (Internet safety statistics): Balancing Convenience with Security

    The internet has undeniably revolutionized our lives, offering unparalleled access to information, communication, and entertainment. However, this vast digital landscape also presents a growing set of security challenges. From cybercrime to online harassment, the potential threats are numerous and can impact individuals, families, and businesses alike.

    This guide explores the evolving landscape of online safety. We’ll delve into:

    • The rising prevalence of cyber threats and their potential consequences.
    • Practical strategies to safeguard yourself, your family, and your business online.
    • Resources and tools available to stay informed and combat online dangers.

    By taking a proactive approach to online safety, we can harness the full potential of the internet while minimizing the risks. Let’s navigate the digital world with confidence and create a safer online environment for everyone.

    Understanding Online Risks From Internet Safety Statistics: Key Statistics

    Internet safety statistics

    The internet has become an integral part of our lives, but it’s important to be aware of potential risks. These statistics offer insights into various aspects of online safety:

    • Youth and Online Content (internet safety statistics): A concerning statistic shows that a significant percentage of children aged 10-12 (33%) and teenagers (57%) have reportedly been exposed to online content that may have contributed to suicidal ideation. This highlights the need for age-appropriate content filters and open communication between parents and children about online safety.
    • Social Media Account Security (internet safety statistics): Data breaches are a growing concern. 25% of Americans have experienced unauthorized access to their social media accounts or devices in the past year. Implementing strong passwords and two-factor authentication can help protect accounts.
    • Parental Communication on Internet Safety (internet safety statistics): A positive trend: 91% of children aged 12-15 have discussed internet safety with their parents. Open communication is crucial for fostering safe online habits in children.
    • Data Privacy Concerns (internet safety statistics): Data privacy remains a top concern for Americans. 88% are worried about their data privacy, and a significant portion (86%) actively take steps to minimize their online footprint. Understanding privacy settings and data security practices is essential.
    • Cybercrime Costs (internet safety statistics): Cybercrime poses a substantial financial burden. Victims collectively spend an estimated 2.7 billion hours trying to resolve cybercrime-related issues. Strong cybersecurity measures can help businesses and individuals minimize risks.
    • Information Literacy Challenges (internet safety statistics): Evaluating online information can be challenging. 56% of Americans admit to having trouble verifying the legitimacy of online sources. Developing critical thinking skills and utilizing reliable sources of information are essential for safe and effective online navigation.

    General Internet Safety Statistics

    Internet safety statistics
    1. Over 6 in 10 US adults feel it’s unavoidable for companies to collect their data during daily activities. (source)
    2. Limited Optimism: While 62% of US adults believe companies always collect data. (source)
    3. A smaller but significant portion (38%) remains hopeful about avoiding data collection in daily life. (source)
    4. Government Data Collection: Similar to concerns about companies, 63% of US adults feel the government inevitably collects their data. (source)
    5.  while 36% believe some avoidance is possible. (source)
    6. Widespread Concern about Data Use: A large majority 81% in the US, expresses unease about how companies utilize collected data.(source)
    7. And 71% overall expresses unease about how companies utilize collected data. (source)
    8. Lack of Transparency: A significant knowledge gap exists, with 67% having little understanding of corporate data practices. (source)
    9. And an even larger percentage (77%) lacking knowledge of government data use. (source)
    10. Public Support for Regulation: The public overwhelmingly favors increased government regulation for online safety (72% in the US). (source)
    11. With minimal support for less regulation (7% in the US). (source)
    12. Internet dependence: The vast majority of teens (93%) rely on the internet for various purposes.(source)

    Cybersecurity Landscape (internet safety statistics):

    Internet safety statistics
    1. Cybercrime Prevalence: Consumer fraud is a significant cyber threat, with nearly 31,000 cases reported in the US during Q2 2023. (source) This statistic highlights the importance of online vigilance.
    2. Impact of Online Scams: Examples like counterfeit goods scams (affecting 42% of UK internet users lacking online safety awareness) demonstrate the real-world consequences of cybercrime. (source)
    3. The Value of Connectivity: Despite security concerns, the internet offers undeniable benefits. A 2023 study revealed that 66% of UK internet users believe the advantages outweigh the drawbacks. (source)
    4. The Rise of Social Media: The COVID-19 pandemic fueled a surge in social media and messaging service use, with a 40% increase since 2020. This trend underscores our growing reliance on online communication. (source)
    5. A majority of children aged 10-12 (67%) and teenagers (76%) have encountered instances of bullying, whether as the aggressor, observer, or victim. (source)
    6. A significant portion of children aged 10-12 (58%) and teenagers (75%) have come across online content containing sexual information. (source)
    7. A substantial number of children aged 10-12 (58%) and teenagers (77%) have been exposed to internet content related to drugs and alcohol. (source)
    8. A considerable percentage of children aged 10-12 (68%) and teenagers (82%) have encountered online content depicting violence. (source)
    9. A minority of children aged 10-12 (8%) and teenagers (10%) have experienced predatory behavior from individuals online. (source)
    10. A notable proportion of children aged 10-12 (26%) and teenagers (38%) have been exposed to internet content related to depression. (source)
    11. A significant number of children aged 10-12 (33%) and teenagers (57%) have reported attempting suicide due to online information. (source)
    12. Approximately one in six individuals have experienced online sexual abuse before reaching the age of 18. (source)
    13. The vast majority of children aged 12-15 years (91%) have received guidance on internet safety from a parent. (source)
    14. A significant percentage of children aged 8-11 years (73%) have received instruction on internet safety from a teacher. (source)
    15. Two out of ten children aged 16-17 years (20%) have been educated about internet safety by law enforcement officials. (source)
    16. Millennials and Gen Zers are more likely to report experiencing a cyber threat, with 44% of millennials and 51% of Gen Zers compared to 21% of baby boomers. (source)
    17. Identity theft is more prevalent among millennials and Gen Zers, with 25% of millennials and 24% of Gen Zers having had their identities stolen, in contrast to only 14% of baby boomers. (source)
    18. The majority of baby boomers (79%) state that they have never encountered internet safety issues or fallen victim to cybercrime. (source)
    19. Security Habits: In the UK, only 7 out of 10 internet users secure their devices with strong passwords (source).
    20.  Fingerprint or facial recognition is used for device access by over half (51%) of internet users (source).
    21. Privacy Habits: Among older UK citizens (aged 55+), 15% delete their browsing history and cookies daily (source). 
    22. This is compared to only 11% of younger citizens (16-24) who regularly delete their browsing history and digital traces (source).
    23. Online Abuse: A majority (65%) of online abuse victims in the UK are dissatisfied with the response they receive from internet companies (source). 
    24. Only 16% of victims report being happy with how their case was handled (source).
    25. VPN Usage: In the UK, a significant portion (27%) of citizens use virtual private networks (VPNs) for up to 20% of their browsing time (source). 
    26. Even more extreme, 11% of UK citizens now browse the internet exclusively through VPNs (source).
    27. Privacy Concerns: When it comes to websites tracking their personal information, 30% of UK citizens feel skeptical, while 22% feel nervous about this practice (source).
    28. Cybercrime: A concerning statistic is that nearly 330 million people across 10 countries have been victims of cybercrime within the last year (source). This translates to a substantial number of people being impacted by cybercriminals.
    29. Impact of Cybercrime: The burden of cybercrime is significant. Victims spend an estimated 2.7 billion hours trying to resolve the issues caused by these attacks (source).
    30. Remote Work Risks: The perception of increased risk is strong, with 76% of people believing remote work makes them more susceptible to cybercrime (source).
    31. Post-Attack Actions: Most Americans (99%) who experience unauthorized access to an account or device take steps to improve their cybersecurity (source). This highlights a focus on improving online safety after a security breach.
    32. Security Measures: Strong passwords are a common response to cybercrime, with 66% of affected Americans adopting this practice (source).
    33. Seeking Help: When faced with cybercrime, victims often seek help from family (33%) or invest in additional security software (18%) (source).
    34. Privacy Concerns: Data privacy is a major concern for Americans, with a significant majority (88%) expressing worry (source). 
    35. To combat this, 86% actively try to hide their online footprint (source).
    36. Safety Measures: People are taking action to protect themselves online. Stronger passwords are used by 55%, and 40% limit the information they share on social media (source).
    37. Knowledge Gap: A concerning knowledge gap exists, with 40% of Americans admitting they lack knowledge on how to protect themselves from cybercrime (source). 
    38. Additionally, nearly half (46%) would be unsure of what to do if their identity was stolen (source).
    39. Parenting Challenges: The internet presents difficulties for parents. 70% of parents believe raising children is more complex today due to social media and unsafe online content (source).
    Internet safety statistics
    1. Cybercrime Trends: There may be a slight decline in reported cybercrime. The number of reported cybercrimes in the US dipped to 800,944 in 2022, compared to 847,400 in 2021 (source). It’s important to note this might not reflect the true scale of the problem.
    Internet safety statistics
    1. Financial Impact of Cybercrime: Cybercrime is taking a significant financial toll. In 2022, there was a nearly 50% increase in financial losses, reaching $10.3 billion from $6.9 billion in the previous year (source).
    2. Phishing Dominates: Phishing attacks are the most common cybercrime, targeting a staggering 300,497 victims in 2022 and accounting for roughly 41% of all reported internet crimes (source).
    3. Age Group Targeted: Adults between 30 and 39 years old were the age group hit hardest by cybercrime in 2022, with 94,506 individuals reporting incidents (source).
    4. Investment Scams Costly: Fake investment scams were a major source of financial loss in 2022. These scams resulted in over $3.3 billion in lost assets, representing about one-third of total cybercrime losses (source).
    5. Cybersecurity Fears: A significant portion of Americans (59%) are concerned about falling victim to cybercrime (source). This highlights a general population awareness of the threat.
    6. Difficulties with Online Trust: Many Americans (56%) struggle to determine the credibility of information they encounter online (source). This highlights the challenge of navigating online information and avoiding misinformation.
    7. Social Media and Stalking: Social media is a prime hunting ground for cyberstalkers, with a staggering 82% using these platforms to gather information about their victims (source).
    8. Teens and Online Privacy: A significant portion of teens (32%) admit to hiding their browsing history, likely to shield their online activity from guardians (source). This statistic highlights potential privacy concerns among teenagers.
    9. Social Media Prevalence: A large majority of kids (73%) have social media accounts, making them potential targets online (source).
    10. Social Media and Stalking: Social media platforms are a major tool for cyberstalkers. A concerning 82% of cyberstalkers leverage these platforms to gather information about their victims (source). This information can be used to harass or endanger children.
    11. Location Risks: Social media use by children can expose personal details. A substantial portion of cyberstalkers (65%) use social media to discover a child’s location, such as where they live or attend school (source).
    12. Early Exposure: Even younger children are engaging with strangers online. A concerning 13% of kids in 2nd and 3rd grade have reported chatting with people they don’t know on the internet (source).
    13. Privacy Settings: There’s a mixed bag regarding privacy settings used by teens on social media. While 62% of teens take some steps towards privacy by making their Facebook accounts private, a significant minority (17%) leave all their information publicly available (source). This highlights the need for education on online safety and managing social media profiles.
    14. Privacy Efforts by Teens: Teens are taking steps to manage their online privacy from guardians. A significant portion (32%) admit to hiding their search history to conceal visited sites (source).
    15.  Additionally, 16% confess to using secret social media or email accounts their parents are unaware of (source).
    16. Bypassing Parental Controls: A concerning statistic reveals that 11% of kids claim to know how to deactivate parental controls on their devices (source). This highlights the need for robust parental controls and open communication about online safety.
    17. Parental Awareness Gap: Teens may be successfully concealing online activity. A substantial number of kids (40%) report stopping their online activities if they suspect parental monitoring (source). 
    18. Furthermore, 17% of kids believe their parents lack awareness of their online behavior (source). This suggests a gap in communication and the importance of open conversations about online safety.
    19. Widespread Witnessing: Cyberbullying is a significant online concern for teens. A staggering 90% of children have witnessed cyberbullying behavior in the past year (source).
    20. Increased Risk with Age: Teens become more likely to be involved in cyberbullying as they get older. Nationally, 33% of kids aged 12-17 report being victims, and the likelihood increases with age (source).
    21. Repeated Victimization: Many teens experience cyberbullying repeatedly. Around 25% of kids report being bullied online more than once, and 40% have encountered hurtful comments online on multiple occasions (source).
    22. Smartphones and Social Media: Smartphones are the primary platform for cyberbullying, unsurprising given that 80% of teens use them regularly (source). Anonymity and ease of access likely contribute to this trend.
    23. Perceived Ease: Teens overwhelmingly believe that bullying is easier online, with 81% reporting this view (source). This perception may embolden bullies and make intervention more difficult.
    24. Bystander Silence: A concerning statistic reveals that 90% of teens who witness cyberbullying on social media do not intervene (source). This highlights the need to encourage bystander action against online harassment.
    25. Limited Parental Reporting: Teens are reluctant to report cyberbullying to parents. Only 10% of teens will inform a parent if they are being bullied online (source). This creates a communication gap and makes it harder to address the issue.
    26. Disproportionate Impact: Girls are twice as likely to experience cyberbullying compared to boys (source). This highlights the need for targeted support and awareness campaigns.
    Internet safety statistics

    Privacy Concerns on the Rise (internet safety statistics)

    More than half of internet users are hitting the brakes on online sharing. Events like the Yahoo hack, the GDPR regulations, and even the COVID-19 pandemic have all put a spotlight on online privacy. This growing concern underscores the need for better education about cyber threats and the tools available to keep our digital lives secure.

    Data Woes (internet safety statistics): Half Lost in the Mix

    A whopping 50% of American adults feel uneasy about the amount of personal information floating around online. To make matters worse, nearly half (47%) aren’t sure what happens to their data once it’s collected. This information gap leaves many vulnerable to online dangers like scams, identity theft, and other malicious activities. It’s clear we need to bridge this knowledge gap and empower people to protect their digital lives.

    Email (internet safety statistics): Hotbed for Hidden Threats

    Did you know? A whopping 94% of malware lurks in emails! This stat is a wake-up call to treat every email with a healthy dose of suspicion. Even seemingly harmless messages could be packing a malicious punch. Remember, the internet isn’t always sunshine and rainbows. Stay sharp and play it safe when navigating your inbox.

    The Takeaway (internet safety statistics): Safeguard Your Online World

    The numbers paint a clear picture: the internet can be a minefield. But fear not! By understanding the risks and taking steps to protect yourselves, you and your family can navigate the digital world with confidence. Let’s turn these alarming statistics into a call to action for online safety.

    Internet Safety: Your Digital Defense Guide

    What’s Lurking Online?

    The internet is a vast and wonderful place, but it also comes with hidden dangers. Here’s a quick rundown of the top threats:

    • Scammers on the Hunt: Watch out for online cons designed to steal your money or personal information.
    • Cyberbullies Run Amok: Unfortunately, online harassment can be a real problem.
    • Inappropriate Content Around the Corner: The internet can be a Wild West, so be mindful of what you or your family might encounter.
    • Identity Theft: A Nightmare Scenario: Criminals might try to steal your personal details for malicious purposes.
    • Phishing for Trouble: Don’t fall for fake emails or websites trying to trick you into giving away personal information.

    Arm Yourself for the Digital Age

    Knowledge is power! Here are some essential internet safety rules:

    • Password Power: Create strong and unique passwords for all your accounts.
    • Double the Security: Enable multi-factor authentication (MFA) whenever possible for an extra layer of protection.
    • Think Before You Click: Only visit websites that look trustworthy and avoid suspicious links.
    • Privacy Matters: Review your privacy settings on social media and other platforms. Don’t blindly accept privacy policies – take a moment to read them!
    • Backup Regularly: Save copies of your important data to avoid losing it.
    • Clean Up Your Digital Footprint: Close old accounts you no longer use.

    What is Internet Safety?

    Think of internet safety as your digital shield. It’s all about protecting your data and personal information from unauthorized access or misuse.

    Phishing: Don’t Get Hooked

    Phishing scams are like online bait-and-switch tactics. Scammers use fake emails or websites to trick you into revealing your personal information, like passwords or credit card details.

    Stay Phish-Free

    • Be cautious of websites without “HTTPS” in the address bar – this indicates a secure connection.
    • Strong passwords are your best defense.
    • Don’t open emails from unknown senders, and delete suspicious messages immediately.
    • Use anti-virus software to help identify and block potential threats.

    How Hackers Get In

    Hackers and malicious actors use various tricks to gain access to your data. These can be hidden in emails, fake downloads, or even seemingly harmless websites. By following these tips, you can significantly reduce the risk of falling victim to these tactics.

    The Bottom Line (internet safety statistics)

    The internet offers a treasure trove of information and connections, but it’s not without its pitfalls. These internet safety statistics would be a guide to navigate it safely. We need to be smart about what we share and how we connect. This includes being cautious with social media, online banking, and any personal information we reveal. Remember, the devices we use are gateways, and we need to secure them properly. Don’t wait for trouble to find you; take steps to stay protected from the start.

  • 100+ Internet Dangers Statistics You Should Know (2025)

    100+ Internet Dangers Statistics You Should Know (2025)

    Internet Dangers statistics

    Here are 100+ Internet Danger Statistics to help you in 2024 and beyond;

    The Double-Edged Sword of the Internet (Internet dangers statistics):

    The Internet, a marvel of human ingenuity, has revolutionized communication and learning. However, like any powerful tool, it can be misused. This section explores the potential dangers lurking online, especially for children, to ensure safe and responsible internet use.

    This revised text condenses the original passage while highlighting the internet’s positive and negative aspects. It focuses on online safety and avoids overly dramatic language.

    Alarming Stats: Unveiling the Dangers of the Internet

    Here are some of the key internet danger statistics:

    • Constant Threat: Cyberattacks are alarmingly frequent, with one occurring every 39 seconds.
    • Children at Risk: A staggering 1 in 7 children face online predators with malicious intentions.
    • Financial Devastation: Ransomware attacks are taking a significant financial toll, costing businesses an estimated $20 billion in 2021, with projections reaching $265 billion by 2031. 
    • Cyberbullying on the Rise: Cyberbullying is a pervasive issue, impacting nearly 37% of youth aged 12-17.
    • Cybercrime’s High Cost: Cybercrime is a financial menace, with global losses exceeding $190,000 every second and an average cost of $13 million per incident for targeted organizations.
    • Small Businesses Most Vulnerable: Despite being the primary target for 43% of cyberattacks, only 14% of small businesses are adequately prepared to defend themselves. 
    • Students Impacted: Cyberbullying leaves a long-lasting impact, with 37% of students reporting experiencing it at some point in their lives.

    This highlights the most concerning statistics, drawing attention to the financial losses, the prevalence of cyberbullying, and the vulnerability of children and small businesses.

    Navigating the Digital Landscape (Internet Dangers Statistics): A Look at Internet Dangers

    Here’s a rephrased and summarized version of the internet danger statistics:

    The Ever-Present Threat Landscape (Internet dangers statistics):

    1. Malware on the Rise: The constant creation of new malware (230,000 samples daily) highlights the evolving threat landscape. (source)
    2. Privacy Concerns: Over half of internet users (53%) are rightfully worried about protecting their online privacy. (source)
    3. Cybercrime Trends: While cyber incidents in the financial sector decreased in 2022 (1,829 reported incidents), overall online attacks remain frequent (every 39 seconds). (source)

    Children at Risk (Internet dangers statistics):

    1. Cyberbullying Prevalence: Research confirms that cyberbullying is the most common internet danger for children worldwide. (source)
    2. U.S. Statistics: In the U.S. alone, a staggering 12 million children face cyber risks, with millions impacted by cyberbullying and threats. (source)

    Financial Risks (Internet dangers statistics):

    1. Vulnerable Seniors: Older adults are a prime target for internet scams, losing a concerning $3.1 billion in 2022. (source)
    2. Data Breach Costs: Data breaches expose millions of users (over 340 million new user registrations leaked this year) and inflict significant financial losses. (source)

    Business Security Challenges (Internet dangers statistics):

    1. DDoS Attacks: A significant portion of organizations (73%) have been affected by DDoS attacks, disrupting operations. (source)
    2. Insider Threats: Surprisingly, human error is the leading cause of data breaches for organizations, as highlighted by a survey (84% of IT leaders). (source)
    3.  Insider data breaches are also remarkably common (94% of organizations). (source)

    Phishing and Identity Theft (Internet dangers statistics):

    1. Phishing Prevalence: The sheer volume of phishing emails sent daily (around 3 billion) underscores the importance of online vigilance. (source)
    2. Identity Theft Concerns: Identity theft remains the most frequent type of data breach (59%), highlighting the need for robust security measures. (source)
    3. Slow Detection Rates: The average time to identify a data breach in 2019 was a concerning 206 days, allowing attackers a significant window of opportunity. (source)

    Vulnerability Surge (Internet dangers statistics):

    1. Explosive Growth: The number of new cybersecurity vulnerabilities discovered in the first week of 2024 (over 612) is alarming. (source)
    2. exceeding the entire total for 2023 (29,000). This highlights the need for continuous security updates and vigilance. (source)

    This condenses the information, and groups-related statistics for better readability and focuses on key takeaways for different user groups (children, businesses, general users). It emphasizes the constant threat of new malware, privacy concerns, the vulnerability of children and seniors, and the financial and operational risks associated with cybercrime.

    1. Ransomware Rampage: The financial burden of ransomware attacks is significant, reaching $20 billion in 2021. (source)
    2. Ransomware’s Devastating Rise: Ransomware attacks are not only the fastest-growing cybercrime but are also projected to inflict colossal damage – exceeding $265 billion globally by 2031. (source)
    3.  The frequency of attacks is alarming, predicted to target a business every 2 seconds by 2031. (source)
    4. Surge in Victims: The number of ransomware victims reached an alarming new high in 2023, with over 4368 attacks reported. This surpasses the total number of victims in 2022, with the second and third quarters of 2023 alone exceeding the entire previous year. (source)
    5. Prime Targets: The United States is the most targeted region for ransomware attacks, with businesses being the primary victims. (source)
    6. Approximately half (49%) of teenagers report that their parents take no action to supervise their device usage. (source)
    7. Seventy percent (70%) of children aged 7 to 18 have unintentionally encountered online pornography, often while conducting homework-related web searches. (source)
    8. Predatory behaviors from online individuals were experienced by nearly 10% of tweens and over 20% of teenagers. (source)
    Internet Danger Statistics
    1. Around 89% of instances of sexual solicitation targeting youth occurred in chat rooms or via instant messaging platforms. (source)
    2. According to a survey, 86% of surveyed girls admitted to engaging in online chat without parental awareness, while 57% could access their parents’ emails, and 54% could initiate cyber relationships. (source)
    Internet Danger Statistics
    1. Law enforcement officials estimate that up to 50,000 sexual predators are active online at any given time. (source)
    2. Sixty-five percent (65%) of parents and 64% of teenagers acknowledge that teens engage in online activities they prefer their parents not to be aware of. (source)
    3. An estimated 725,000 children have faced aggressive solicitation for sexual encounters, defined as proposals to meet in person. (source)
    4. Twenty percent (20%) of the approximately 24 million children accessing the internet have been approached for sexual encounters in the past year. (source)
    5. Forty-four percent (44%) of teenagers confessed to watching online content that their parents would disapprove of. (source)
    6. Only 15% of parents are well-informed about their children’s social networking habits and the potential for these behaviors to lead to cyberbullying. (source)
    7. A study found that 77% of online predators target victims aged 14 or older. (source)
    8. Research indicates that girls are more frequently targeted by cyberbullies than boys. (source)
    9. It has been reported that 28% of teenagers have experienced various forms of cyberbullying. (source)
    10. Nearly two-fifths (37%) of youth aged 12-17 have been bullied online, and a disturbing 30% have faced it repeatedly. (source)
    11. A recent study revealed that around one-quarter of middle and high school students have encountered cyberbullying in the past month. (source)
    12. Over 41% of Americans have firsthand experience with being cyberbullied. (source)
    13. Cyberbullying is a widespread concern, with nearly all Americans (92%) acknowledging it as a serious problem. (source)
    14. Facebook appears to be a primary platform for cyberbullying, with three out of four targets being harassed there. (source)
    15. There is a potential link between cyberbullying and the rise in youth suicides, highlighting its severity. (source)
    16. A significant portion (42%) of US teens report encountering offensive name-calling online, indicating a prevalence of cyberbullying behavior. (source)
    17. Almost a quarter (24%) of teenagers from low-income households (earning less than $30,000 annually) report facing physical threats online. (source)
    18. In stark contrast, only 12% of teenagers from high-income households (earning $75,000 or more) say they experience similar threats online. (source)
    19. A 2019 study found that over a third (37%) of students have encountered cyberbullying at some point in their lives. (source)
    20. A significant portion (25%) of social media users unknowingly expose sensitive data online. (source)
    21. Instagram has emerged as a significant platform for cyberbullying, with nearly half (42%) of young people experiencing it there. (source)
    22. Facebook remains the leading platform for cyberbullying, affecting 27% of young people surveyed. Snapchat follows closely at 21%.(source)
    Internet Danger Statistics
    1. Nearly a quarter (24%) of social media users have had private or embarrassing information exposed publicly without their consent. (source)
    2. Almost a third (29%) of users have been stalked or contacted by strangers online. (source)
    3. A concerning number of teens (12%) witness negative behavior “frequently” on social networking sites. (source)
    4. Over 15% of teenagers on social media have been targeted by online meanness. (source)
    5. A staggering 88% of teenagers have witnessed cyberbullying firsthand on social networking websites. (source)
    6. Social networking sites appear to be a breeding ground for online predators, with 29% of internet sex crime relationships starting there. (source)
    7. There has been a disturbing 300% increase in sexual assault cases linked to social media platforms. (source)
    8. Excessive social media use, particularly among teenage girls, appears to be linked to an increased risk of depression. (source)
    9. A study revealed that 40% of girls spending more than five hours daily on platforms like Instagram, Facebook, and WhatsApp exhibit symptoms of depression. (source)
    10. An estimated one-third (33 million) of households invest in antivirus software for added protection. (source)
    11. A strong majority (85%) of adult Americans believe antivirus software is a valuable tool for their computers. (source)
    12. Over four-fifths (81%) of parents acknowledge the importance of online safety features to safeguard their children. (source)
    13. Parents of younger children (ages 6-12) are significantly more likely to utilize platform-based safety tools compared to parents of teenagers. On average, they use 4.4 tools compared to parents of teens. (source)
    14. Personal computers are the primary platform for antivirus software usage, accounting for 85%. Mobile phones and tablets follow with usage rates of 24% and 17%, respectively. (source)
    15. A Norton Lifelock study revealed that more than two-thirds of adults are increasingly data-conscious, leading them to implement safety measures. (source)
    16. The global cost of cybercrime is projected to skyrocket by a staggering $5.7 trillion between 2023 and 2028. (source)
    17. Cybercrime costs are on a continuous upward trend, with forecasts predicting further increases in the coming years. (source)
    18. Organizations are facing a significant financial burden from cybercrime, with the average cost reaching $13 million, a $1.4 million jump from previous years. (source)
    19. Cyberattacks remain prevalent, with nearly 40% of UK businesses reporting incidents within the past year, showing no signs of decline. (source)
    20. Investment fraud emerged as the most expensive cybercrime in 2022, inflicting an average loss of $70,811 per victim. (source)
    21. The Asia-Pacific region witnessed a staggering 168% surge in cybercrime between May 2020 and May 2021. (source)
    22. Ransomware attacks have become a lucrative source for cybercriminals, with over $4 billion in Bitcoin laundered through extortion schemes. (source)
    Internet Danger Statistics
    1. The financial toll of cybercrime is immense, with an estimated loss of $190,000 every second. The situation worsened during the COVID-19 pandemic.(source)
    2. Reported cybercrime cases have seen a dramatic 300% increase, and global costs are expected to reach a staggering $10.5 trillion by 2025. (source)
    3. In a major cyberattack on April 29, 2021, the Russian cybercrime group DarkSide targeted oil giant Colonial Pipeline. They demanded a $4.4 million ransom for stolen data. (source)
    4. The United Kingdom and the United States have a considerably higher rate of cybercrime victims per million internet users compared to other countries. (source)
    5. A staggering 6.5 million lives were tragically lost due to cybercrime between 2001 and 2021, with economic costs estimated to be nearly $26 billion. (source)
    6. The US government reported a sharp increase in healthcare data breaches in the first five months of 2022, nearly double the number compared to the same period in 2021. (source)
    7. Phishing scams reign supreme as the most prevalent cybercrime, according to a U.S. Internet Crime Complaint Center report. Over 300,000 victims were targeted in 2022 alone. Additionally, a concerning 85% of organizations globally admitted to encountering bulk phishing attempts, and three-quarters reported being targeted by smishing scams (phishing via SMS). (source)
    8. Small businesses are a prime target for cyberattacks, with 43% falling victim. However, only 14% are adequately prepared to defend themselves. (source)
    9. Spear-phishing tactics are prevalent, with an estimated 62% of cyberattacks leveraging data obtained through this method. (source)
    10. The COVID-19 pandemic caused a surge in cybercrime victims, with a jump from 2019 to 2020 reflected in a 69% increase. (source)
    11. Identity theft poses a significant threat to young adults, with 20% of Millennials and 18% of Gen Z having fallen victim. (source)
    12. More than half (50%) of people feel a lack of privacy online. (source)
    13. Cybercrime appears to disproportionately target individuals between 20 and 39 years old. (source)
    14. Social media accounts seem particularly vulnerable, with 46% of women and 37% of men reporting hacks. (source)
    15. Online safety is a concern for many, with 31% of people feeling unsafe online. (source)
    16. Parental involvement is evident, as 61% of parents monitor their teenagers’ web browsing history. (source)
    17. Nearly 40% (39%) of parents utilize parental controls to restrict, filter, or monitor their teenagers’ online activities. (source)
    18. In 2003, there were approximately 1.3 million pornographic websites, encompassing a total of 260 million pages. (source)
    19. Estimates of the total profit generated by the porn industry range from $4 billion to $10 billion, with the total U.S. revenue in 2005 reaching $12.6 billion. (source)
    20. Adult DVD/video rentals in the United States reached almost 1 billion in 2005. (source)
    21. Fifty-five percent of hotel guests engage in viewership of adult films. (source)
    22. Approximately 45 million unique users visit adult websites monthly. (source)
    23. More than 70% of men aged 18 to 34 visit a pornographic website in a typical month. (source)
    Internet Danger Statistics
    1. Ten percent of adults admit to being addicted to Internet sexual content, with 28% of them being women. (source)
    2. Over 20,000 images of child pornography are posted online every week. (source)
    3. About 20% of all Internet pornography involves children. (source)
    4. It is estimated that 100,000 websites offer illegal child pornography. (source)
    5. As of December 2005, the child pornography industry had an annual revenue of $3 billion. (source)
    6. A survey conducted in 2003 by the American Academy of Matrimonial Lawyers revealed that two-thirds of the 350 divorce lawyers in attendance attributed the Internet to play a significant role in divorces over the past year, with excessive interest in online pornography contributing to more than half of such cases. This contrasts with the minimal role pornography played in divorces just seven or eight years prior. (source)
    7. Roger Charman, representing Focus on the Family’s Pastoral Ministries, reports that approximately 20% of the calls received on their Pastoral Care Line pertain to issues such as pornography and compulsive sexual behavior. (source)
    8. In a 2000 survey conducted by Christianity Today, 33% of clergy members admitted to visiting sexually explicit websites. Among those who had visited such sites, 53% did so “a few times” in the past year, and 18% visited sexually explicit websites a couple of times a month and more than once a week. (source)
    9. According to research by The Barna Group, 29% of born-again adults in the United States believe it is morally acceptable to watch movies containing explicit sexual behavior. (source)
    10. A survey conducted by Christians and Sex Leadership Journal in March 2005 found that 57% of pastors consider addiction to pornography to be the most sexually damaging issue affecting their congregation. (source)
    11. A poll conducted by Today’s Christian Woman revealed that 34% of female readers admitted to intentionally accessing internet pornography. Furthermore, the poll found that 1 out of every 6 women, including Christians, struggles with pornography addiction. (source)
    12. According to a poll by Focus on the Family, 47% of families acknowledge pornography as a problem in their household. (source)
    13. The Internet played a significant role in two out of three divorces, as reported by the American Academy of Matrimonial Lawyers in 2003, according to Divorcewizards.com. (source)

    While the internet offers a vast array of benefits, the recent statistics paint a sobering picture of the online threats lurking beneath the surface. From relentless cyberbullying to the ever-growing presence of cybercriminals, the data exposes the constant dangers individuals and organizations face.

    The numbers are staggering (Internet dangers statistics): an online attack occurs every 39 seconds, and a disturbing 1 in 7 children encounter predators online. Businesses are projected to lose over $20 billion to ransomware alone, with reported losses reaching $10.3 billion in 2022.

    These statistics serve as a stark reminder of the importance of online safety. By familiarizing ourselves with the risks and implementing robust cybersecurity measures, we can all take an active role in creating a safer and more secure digital environment.

    FAQs On Internet Dangers Statistics

    1. How frequently do hacker attacks occur?

    Hacker attacks occur at a high frequency, with an average of one attack transpiring every 39 seconds worldwide.

    1.  What is the extent of social media usage by cyberstalkers to gather information about potential victims?

    Up to 82% of cyberstalkers utilize social media platforms to collect information about their intended targets.

    1. How many teens confess to concealing their search history from their parents or guardians?

    Seventy percent (70%) of teenagers admit to hiding their online activities from their parents or guardians. They employ various methods to do so, including:

    • Deleting their browser history (53%)
    • Concealing or erasing instant messages or videos (34%)
    • Using internet-enabled mobile devices (21%)
    • Adjusting privacy settings to restrict content access to friends only.
    1. What percentage of tweens report receiving uncomfortable messages online?

    Approximately 17% of tweens have reported receiving unsettling messages via online platforms.

    1. What proportion of children are likely to have stumbled upon pornographic material online by the age of 15?

    Around 70% of teenagers aged 15 to 17 have reported inadvertently encountering pornography on the internet.

    1. How many young individuals have encountered cyberbullying?

    According to a report from the Pew Research Center, a significant number of young people have experienced cyberbullying. The report reveals that 59% of U.S. teens have personally encountered at least one of six types of abusive online behaviors. Additionally, another report from the same source in 2022 unveiled that a total of 28% of teens have faced multiple forms of cyberbullying.

    1. How frequently is malware disseminated via email?

    Malware is commonly distributed via email. Various sources indicate that 92-94% of all malware is delivered through emails, making it a prevalent and effective method for cyber attacks. Phishing emails, designed to deceive users into downloading malware, have become increasingly sophisticated over time, contributing to the substantial percentage of malware transmitted via email.

    1. What are the best safety measures to mitigate internet dangers?

    To safeguard yourself and your family from internet threats, consider implementing these safety measures:

    • Refrain from oversharing personal information online.
    • Verify the security of the websites you visit.
    • Regularly back up your data.
    • Utilize two-factor authentication (2FA).
    • Exercise caution when connecting to free WiFi hotspots.
    • Consider using a Virtual Private Network (VPN), especially while traveling.
    • Avoid opening random links.
    • Implement parental control settings for children.
    • Keep your software up to date with the latest updates and patches.
  • 80+ Amazon Book Sales Statistics And Amazing Facts to know in 2025

    80+ Amazon Book Sales Statistics And Amazing Facts to know in 2025

    Amazon Book Sales Statistics

    Here are 80+ Amazon Book sales Statistics And Facts To Help You;

    Amazon revolutionized publishing, empowering anyone to become a published author and achieve financial success. (Amazon Book Sales Statistics)

    However, navigating this new landscape requires understanding Amazon book sales’s current state and future outlook. These key Amazon book sales statistics will equip you to:

    • Identify winning strategies: Learn what works in the Amazon book market.
    • Target the right audience: Reach the readers most interested in your genre and content.
    • Project your earning potential: Gain insights into potential revenue streams.

    Armed with this valuable data, you can craft a targeted strategy to maximize your success as a self-published author on Amazon.

    Amazon Book Sales Statistics

    Dominating the Market: (Amazon Book Sales Statistics)

    • Amazon reigns supreme in the e-book market, capturing a whopping 67% share of sales in the United States.
    • Their reach extends beyond digital, with an estimated 300 million printed books sold annually, generating $28 billion globally.

    What’s Hot on Kindle? (Amazon Book Sales Statistics)

    • Competition is fierce in the world of Kindle books, with the Romance genre (particularly Contemporary Romance) being the battleground for the most attention.

    Top Sellers & Trends:(Amazon Book Sales Statistics)

    • Books continue to be a bestseller on Amazon, with a staggering 57.2 million sales recorded.
    • In 2022, readers gravitated towards personal stories, with memoirs and biographies emerging as the top-selling genres.

    Audiobooks on the Rise:(Amazon Book Sales Statistics)

    • Amazon holds a significant share (approximately 41%) of the audiobook market, highlighting the growing popularity of audio formats.

     Amazon Book Sales Statistics

    Amazon Book Sales Statistics
    1. Dominant Market Share: Amazon holds a staggering 50% share of all printed books sold in the US, solidifying its position as the retail giant for physical books. (source
    2. Further strengthening its lead, Amazon boasts 78.5% of e-commerce sales in the Books, Video, and Music categories. (source)
    3. Massive Sales Volume: They sell a mind-blowing 300 million printed books. (source)
    4. And 487 million ebooks annually. (source)
    5.  Books themselves reign supreme as the most popular product category on Amazon with a record 57.2 million sales. (source)
    6. Financial Powerhouse: These staggering sales translate to a significant revenue stream. Amazon rakes in a whopping $28 billion annually.(source)
    7. From global book sales, contributing a notable 10% to their overall revenue. (source)
    8. Reader Preferences: Interestingly, 71% of readers reported buying a book from Amazon last year. (source)
    9.  In terms of genre, memoirs and biographies emerged as the top sellers in 2022. (source) Looking for recommendations? 
    10. Amazon Editors have crowned ‘The Heaven and Earth Grocery Store’ by James McBride as the best book of 2023. (source)
    11. Amazon dominates the UK book market, holding over half the share and selling more than 106 million books annually. (source)
    12. Focusing on reader reach: Over 487 million ebooks find new homes through Kindle each year. (source)
    13. Kindle Unlimited Thrives: With over 3 million subscribers, Kindle Unlimited boasts a robust membership base. (source)
    14. Massive Reader Reach: A staggering 71% of UK readers and 67% of US readers have turned to Amazon for books in the past year. (source)
    15. Genre Giants: The realm of Kindle ebook sales sees fierce competition, with contemporary romance reigning supreme. (source)
    16. Market Leader: Amazon maintains a dominant market share of 60-70% in book sales, with a vast pool of 1.4 million self-published titles as of 2018. (source)
    17. E-reader King: Kindle holds a commanding 72% share of the e-reader market, with a significant portion of users (33.7%) dedicating 60-90 minutes daily to Kindle reading. (source)
    18. Distribution Powerhouse: Amazon exerts immense control over book distribution in the US, reaching up to 80% of the market. (source)
    19. Author Insights: The average book sells around 200 copies in its first year on Amazon, reaching 1,000 total sales over its lifetime on the platform. (source)

    These statistics paint a clear picture of Amazon’s undeniable influence in the world of ebooks and book sales in general.

    Amazon’s Continued Growth: Publishing Power and E-reader Dominance (Amazon Book Sales Statistics)

    1. Expanding Reach: Beyond its marketplace dominance, Amazon actively participates in book publishing, releasing roughly 1,000 new titles annually under its publishing arm. (source)
    2. Solidified E-reader Presence: In the US market, Amazon Kindle further strengthens its position with a staggering 75% share of the e-reader market. (source)

    These points add to the overall picture you’ve created, highlighting not just Amazon’s sales dominance but also its expanding reach in publishing and continued leadership in the e-reader market.

    Unveiling the Amazon E-book Universe: A Sea of Content with Shifting Tides (Amazon Book Sales Statistics)

    Amazon Book Sales Statistics
    1. Content Library: Amazon boasts a vast e-book library, offering over 12 million titles for readers to explore. (source)
    2. Engaged Reader Demographics: Interestingly, women over 45 emerge as the top purchasers of ebooks, accounting for a significant 37% of all e-book sales. (source)
    3. Format Popularity: Ebooks hold a strong position within Amazon’s book sales, contributing 21% of their total revenue by revenue. (source)
    4. Notably, ebooks account for an even larger share (36%) when considering the total number of books sold. (source)
    5. Market Titan: Amazon reigns supreme in the e-book market, capturing a market share of at least 67%. (source)
    6. which jumps to a staggering 83% when including Kindle Unlimited subscribers. (source
    7. Some estimates suggest Amazon controls up to 85% of all e-book sales. (source)
    8. Price Variety: Catering to budget-conscious readers, Amazon offers ebooks at various price points, with some titles available for free or under $1. (source)
    Amazon Book Sales Statistics

    1. Market Fluctuations: E-book sales experienced an 11% rise in 2020, but faced a 3.7% decline in 2021, hinting at a possible shift in reading trends. (source)
    2. The Association of American Publishers further confirms a decline in e-book sales during the first quarter of 2022. (source)

    These Statistics highlight the dominance of Amazon in the e-book market, the diverse range of content available, and the recent fluctuation in e-book sales.

    A Statistical Compendium (Amazon Book Sales Statistics)

    1. UK E-book Sales: A Downturn: E-book sales in the UK dipped in 2021, reaching their lowest point since 2012 according to The Bookseller. (source)
    2. UK Reader Preferences for Purchasing Books: Despite the decline in e-book sales, a 2022 survey revealed that a strong majority (71%) of Britons still purchased a book from Amazon in the past year. This figure is even higher than the percentages reported in Italy (66%) and Germany (62%) for the same survey. (source)

    The above statistics highlight the decline in e-book sales but also emphasize the continued popularity of Amazon for book buying in the UK.

    The UK E-book Market: Amazon’s Domain (Amazon Book Sales Statistics)

    1. UK E-book Market: A Powerhouse: The UK boasts the second-largest e-book market globally, showcasing the strong digital reading trend in the region. (source)
    2. E-books Thrive, But Face Challenges: Ebooks capture a significant 34% share of all book sales in the UK (source)
    3.  However, this market faces a potential barrier, as e-book purchases are subject to a 20% VAT (Value Added Tax) unlike physical books. (source)
    4. Amazon Dominates, But Sales Dip: Amazon.co.uk reigns supreme, capturing a staggering 87.9% of the UK e-book market share. (sources)
    5. However, e-book sales itself declined in 2021, dropping from 95 million sold in 2020 to 80 million. (sources)

    This highlights the UK’s strong e-book market, the dominance of Amazon, and the recent decline in e-book sales. It also sheds light on the potential impact of VAT on e-book purchases.

    E-books on Amazon in the US (Amazon Book Sales Statistics)

    Amazon Book Sales Statistics
    1. Amazon King of US E-books: Amazon reigns supreme in the US e-book market, capturing a commanding 83% share. The remaining slice of the pie is divided amongst competitors like Apple Books, Barnes & Noble, Kobo, and Google Play Books. (source)
    2. The Million-Download Day: Back in January 2016, the sheer volume of e-book sales on Amazon US reached a staggering one million paid downloads in a single day. (source)
    3. Independent Authors: A Strong Force: Indie ebooks authored by single writers contribute a significant 40% to the total retail value of US e-book sales. (source)
    4. Beyond Kindle Unlimited: For independent authors, Kindle Unlimited generates around 12% of their income, similar to what they earn from non-Amazon US sales channels. However, this balance might shift when distributing ebooks outside the US and UK. (source)

    Choose the rephrased title that best reflects the key insights you want to convey from the data you have collected.

    The Rise of Audiobooks: Amazon’s Audible Leads the Charge (Amazon Book Sales Statistics)

    1. Audible: The King of Audiobooks: With a massive library exceeding 800,000 titles, Audible, owned by Amazon, reigns supreme as the most popular audiobook platform. (source)
    2. A Nation of Listeners: In the US alone, an impressive 20% of the population have tuned into audiobooks on Audible within the past year. (source)
    3. Amazon’s Audiobook Market Share: While not as dominant as in e-books, Amazon still holds a significant share of the audiobook market, capturing approximately 41%. (source)
    4. A Content Powerhouse: Adding to its vast library, Audible produces a staggering 10,000 new audiobook titles annually. (source)
    5. Audiobook Sales Surge: Audiobook sales experienced a remarkable 22% jump in 2022, reaching a value of $3.04 billion. (sources)
    6. This growth significantly outpaces the audiobook market in the US, which saw a more moderate increase of 3.43% in 2021, reaching $1.81 billion in revenue. (sources)
    7. Year of the Audiobook: Further reflecting the rising popularity of audiobooks, over 74,000 new titles were published on Audible in 2021 alone. (source)

    This highlights the dominance of Audible in the audiobook market, the increasing popularity of audiobooks, and the impressive growth in audiobook sales.

    Unveiling Kindle Unlimited: A World of Ebooks and Reader Engagement (Amazon Book Sales Statistics)

    Amazon Book Sales Statistics
    1. A Thriving Community: Kindle Unlimited boasts an estimated 150 million subscribers, creating a vast audience for authors. (source)
    2. Rewarding Reads: Authors on Kindle Unlimited earn royalties based on a unique system – the more pages Kindle Unlimited subscribers read, the more they earn. (source)
    3. Publishing Updates: Recently, Amazon implemented a policy limiting self-published authors to releasing a maximum of three books per day. (source)
    4. Reads Translate to Revenue: The core principle of Kindle Unlimited payouts lies in the number of pages read by subscribers. Authors with high reader engagement see a direct financial benefit. (source)
    5. Beyond Sales Metrics: Amazon offers two distinct ranking systems: “best-selling” based on raw sales figures, and “most read” which reflects the actual reading habits of Kindle Unlimited subscribers. (source)
    6. A Self-Publishing Powerhouse: A staggering 92% of books available on Kindle Unlimited are estimated to be self-published works, showcasing the platform’s role in empowering independent authors. (source)
    7. Amazon holds a commanding market share in ebooks, capturing at least 67%, and a staggering 83% when including Kindle Unlimited subscriptions. (source)
    8. In the UK, Amazon’s influence extends even further, controlling an estimated 87.9% of yearly ebook sales. (source)
    9. Interestingly, despite ebooks’ initial surge, the trend seems to be shifting. Currently, Amazon sells three times more print books than ebooks. (source)
    Amazon Book Sales Statistics
    1. A Flood of Self-Published Titles: Amazon’s Kindle Direct Publishing (KDP) platform is a powerhouse for self-publishing, releasing over 1.4 million books annually. This figure likely underestimates the true volume, as it excludes books without an ISBN. Regardless, KDP reigns supreme as the world’s largest self-publishing platform. (source)
    2. Author Earnings and Reach: KDP empowers authors by offering them the option to publish in 40 languages and provides significant financial opportunities. Amazon pays over $520 million in royalties each year to over 1 million self-published KDP authors. (source)
    3. E-book Dominance: Self-published books are a driving force behind e-book sales, accounting for a substantial 31% of all ebooks sold on Amazon. (source)
    4. Audiobook Niche: While ebooks thrive in the self-publishing realm, audiobooks remain a less common avenue for self-published work, with only 1% of titles on Audible being self-published. (source)
    5. In 2007, Kindle Direct Publishing (KDP) was a fledgling platform, with a mere 5.7% share of the self-published book market. (source)
    6. However, by 2018, the landscape had dramatically transformed. KDP had become a self-publishing powerhouse, accounting for a staggering 91.5% of all self-published books in the U.S. (source)
    7. This incredible growth is further illustrated by the explosion in the number of self-published titles on KDP, surging from just 3,804 in 2007 to a whopping 1,416,384 in 2018. (source)
    8. Brick-and-Mortar Bookstores Face a Downturn: The number of physical bookstores in the USA has plummeted dramatically. From 1998 to 2020, bookstores shrank by more than half, going from 12,000 stores to a mere 5,773. (source)
    9. Independent Bookstores Hit Particularly Hard: Independent bookstores have been especially vulnerable in this decline. From 1995 to 2022, the number of independent stores dropped by a staggering 63.2%. (source)
    10. and the number of their physical locations decreased by an even steeper 64.2%. (source)
    11. The Rise of Online Retail: While brick-and-mortar bookstores struggled, online book sales soared. Notably, Amazon itself captured at least 50% of all book sales in the USA, highlighting the shift towards online book purchasing. (source)
    12. Adult Reads Reign Supreme: A whopping 82.35% of Amazon’s publishing imprints cater to the adult audience, reflecting a focus on mature content. (source)
    13. A Niche for Young Readers: While the majority caters to adults, Amazon imprints do allocate 17.65% of their titles towards the children and young adult (YA) segment, offering content for younger audiences as well. (source)
    14. Author Success and Reader Reach: Boasting over 80 authors with a global readership exceeding 1 million each, Amazon imprints have become a launchpad for successful writers. (source)
    15. Publishing Powerhouse: Amazon Publishing leads the pack within the company, publishing over 55.3% of all Amazon books. (source)
    16. Thomas & Mercer and Montlake follow closely, each contributing around 11.3% of published titles. (source)

    From Page to Screen: Success Stories in Genre Fiction (Amazon Book Sales Statistics)

    1. “The Martian” Takes Flight: Andy Weir’s science fiction masterpiece, “The Martian,” has become a global phenomenon. It has sold a staggering 5 million copies within the U.S. alone, captivating readers with its thrilling story. (source)
    2. Weir’s success transcended the page in 2015, with the book’s film adaptation grossing $630 million worldwide. (source
    3. Further solidifying his talent, Weir secured a lucrative $3 million deal just five years later, selling the film rights to his next book, “Project Hail Mary,” to MGM. (source)
    4. Self-Publishing Powerhouse: Romance author Marie Force is another shining example of success in the genre fiction world. She has become a multiple New York Times bestseller, selling a remarkable 12 million copies of her books globally. (source
    5. Notably, Force highlighted the power of self-publishing in 2016, revealing that a significant portion (80%) of her revenue stemmed from her 30 self-published titles. (source)

    This text condenses the information and focuses on the commercial success of both authors. It highlights the impressive sales figures of “The Martian” and the film adaptation’s revenue, while also mentioning Weir’s subsequent deal. For Marie Force, it emphasizes her global sales and the significant contribution of self-publishing to her financial success. 

    1. Paperbacks: Authors earn a 40% royalty on the listed price of their paperback book after Amazon deducts all costs associated with printing and fulfillment. (source)
    2. Ebooks: Royalty rates for ebooks depend on whether you enroll in Kindle Direct Publishing (KDP) Select, a program offering exclusive distribution through Amazon. For KDP Select ebooks, authors receive a 70% royalty on the list price, minus expenses. For non-exclusive ebooks, the royalty rate is 35%, minus expenses. (source)
    3. Audible: Similar to ebooks, Audible offers tiered royalty structures. Authors can earn a 40% royalty for audiobooks sold exclusively through Audible, or a 25% royalty for non-exclusive audiobooks. (source)
    Amazon Book Sales Statistics

    Amazon Reigns Supreme in the Book Industry (Amazon Book Sales Statistics)

    • A Book Behemoth: Amazon sits firmly on the throne of the book industry, boasting a commanding 67% market share of US e-book sales and selling a staggering 300 million printed books annually. This dominance translates to a global revenue of $28 billion. (source)
    • Beyond E-books: Interestingly, despite the surge in e-books, physical books remain a major player. Books are Amazon’s most popular product category, generating sales of 57.2 million. (source)
    • The Power of Independent Sellers: A noteworthy aspect of Amazon’s success is the crucial role played by independent sellers. Over 60% of sales on the Amazon platform come from these independent vendors, highlighting the platform’s role in fostering a diverse marketplace. (source)
    • A Leader in All Formats: From its vast e-book selection to its success in audiobooks, Amazon has solidified its position as a leader across all book formats.

    This revised text condenses the information while maintaining the core message. It emphasizes Amazon’s dominance in the market, highlights the ongoing popularity of physical books, and acknowledges the contribution of independent sellers.

    Demystifying Amazon Book Sales: Your Frequently Asked Questions Answered (Amazon Book Sales Statistics)

    Earning Through Book Sales on Amazon (Amazon Book Sales Statistics)

    • Royalties and Profits:
      • Amazon offers royalty rates between 35% and 70% of the book’s selling price, minus printing costs for hardcovers.
      • Earnings can vary greatly depending on book type, pricing, and sales volume. Successful self-published authors can earn over $10,000 per month, but income is highly influenced by factors like genre, marketing, and sales strategies.

    Costs Associated with Selling on Amazon (Amazon Book Sales Statistics)

    • Breakdown of Fees:
      • There are various fees involved:
        • 15% referral fee per book sold.
        • $1.80 closing fee per book sold.
        • $5.00 rental book service fee (for textbook rentals).
        • $0.005 per inactive listing monthly fee (if you have over 100,000 listings).
      • For a high-volume bookselling business, consider the Professional selling plan with a flat monthly fee, plus additional service-specific charges.

    Publishing and Selling Your Ebook on Amazon (Amazon Book Sales Statistics)

    • The KDP Process:
      • Utilize Kindle Direct Publishing (KDP) to create and sell your ebook:
        1. Create a KDP account (if you don’t have one already).
        2. Prepare your manuscript (write, edit, and format).
        3. Publish your ebook: upload your manuscript, and cover, and set the price through your KDP account.
        4. Promote your ebook to reach a wider audience and boost sales.
      • New to self-publishing? Carefully review KDP guidelines to ensure your ebook meets Amazon’s publishing standards.

    Listing Your Book for Sale on Amazon (Amazon Book Sales Statistics)

    • Steps to Sell:
      • Choose a selling plan and create a seller account on Amazon.
      • List your books for sale on the platform.
      • Set competitive book prices based on type, condition, and competitor pricing.
    • Self-Publishing Option: Utilize KDP to publish your book in both print and digital formats, making it available on Amazon stores worldwide within 72 hours.

    Understanding Amazon’s Book Sales Rank (Amazon Book Sales Statistics)

    • Sales Rank Explained:
      • Amazon’s sales rank reflects a book’s relative customer activity compared to other books.
      • It updates frequently (every 60-90 minutes) and is relative, meaning a book’s rank can fluctuate even with consistent sales activity.
      • A good sales rank is generally under 100,000, indicating decent sales performance. However, it’s not an absolute measure of sales volume and should only be used as a general indicator.
  • 100 Best Workplace Collaboration And Teamwork Statistics To Boost Your Employee Performance 2025

    100 Best Workplace Collaboration And Teamwork Statistics To Boost Your Employee Performance 2025

    Workplace collaboration and teamwork statistics

    Here are the top Workplace collaboration and teamwork statistics to help you in 2024 and beyond;

    Building a Dream Team: The Power of Collaboration And Teamwork

    It’s no secret that organizations thrive on teamwork. A strong, ambitious team fueled by open communication, shared goals, and clear roles is a recipe for success. But here’s the surprising catch: many managers aren’t confident their employees grasp the company’s direction.

    The solution? Fostering a collaborative environment where everyone works together seamlessly towards shared objectives. This article dives deep into the power of teamwork, equipping you with insightful statistics and the latest trends in team building and collaboration.  By the end, you’ll have the tools to create a truly efficient workforce and propel your business forward.

    Teamwork vs. Collaboration: Unveiling the Nuances

    Workplace collaboration and Teamwork statistics

    At first glance, teamwork and collaboration might seem like synonyms. After all, both involve people working together towards a common goal. However, employers often differentiate between these terms, and for good reason. Here’s how they differ:

    • Teamwork: A Building Block: Teamwork is the foundation. It involves individuals contributing their assigned tasks to achieve a shared objective. Think of it like constructing a building – each team member lays a specific brick.
    • Collaboration: A Symphony of Ideas: Collaboration takes teamwork a step further. It’s a more fluid process where people work as equals, often without a designated leader. They share ideas, brainstorm solutions, and make collective decisions. Imagine an orchestra – each musician plays a part, but they listen and adapt to each other to create a harmonious piece.

    The Power of Collaborative Teamwork (workplace collaboration and teamwork statistics)

    While both teamwork and collaboration are valuable, the magic truly happens when they’re combined. This sweet spot, known as collaborative teamwork, leverages the best of both worlds:

    The Power of Collaboration And Teamwork: Statistics That Speak Volumes

    Building a successful organization hinges on a strong foundation – teamwork and collaboration. Here are some compelling statistics that highlight their undeniable impact:

    1. The Cornerstone of Success: A resounding 75% of employers agree that teamwork and collaboration are essential ingredients for a thriving workplace (source).
    Workplace collaboration & Teamwork statistics
    1. The Cost of Disunity: Collaboration breakdowns are a major pain point, with 86% of business leaders citing them as a root cause of workplace failures (source).
    2. The Ripple Effect: Effective communication and collaboration have a far-reaching impact on businesses. Strong teamwork fosters trust, employee retention, engagement, and, ultimately, productivity (source).
    3. The Power of “We” Over “Me”: Companies that embrace teamwork and collaboration outperform their less collaborative counterparts by a staggering 5 times (source). This is a clear testament to the power of a unified team.
    4. A Growing Market: The demand for collaboration is evident in the software market. Revenue for collaboration software is predicted to rise continuously by 10.4% between 2023 and 2028 (source).
    5. The Human Touch Endures: Even in an increasingly remote work landscape, a surprising statistic emerges: most U.S. workers emphasize the importance of in-person collaboration for their jobs (source). This highlights the value of fostering opportunities for face-to-face interaction alongside remote collaboration tools.
    6. Shared Ownership: With solid leadership, collaborative teamwork ensures everyone feels invested in the goal. Tasks are distributed fairly, often based on individual strengths. (source)
    7. Efficiency Through Synergy: Collaborative teamwork allows for efficient work. By sharing ideas and expertise, the team can find the best solutions faster. (source)
    8. Motivation Boost: Working together can be energizing! Collaborative teamwork fosters a sense of community and shared purpose, leading to a more motivated workforce. (source)
    Workplace collaboration & Teamwork statistics
    1. The In-Office Advantage: While remote work has become a prominent trend, there’s a clear preference for in-office collaboration. Nearly half (49%) of surveyed U.S. workers find collaborating in the office easier compared to just 15% who prefer doing so at home (source). This suggests the value of physical proximity for some aspects of teamwork.
    2. The Power of Shared Knowledge: Collaboration isn’t just about brainstorming – it fuels performance! A significant 30% of employee performance improvements are attributed simply to information sharing among colleagues (source). This highlights the importance of fostering open communication within teams.
    3. The Collaboration Boost: Teamwork isn’t just about feeling good – it’s good for business! Studies suggest that teamwork and collaboration in the workplace can lead to a substantial sales increase of 27% (source). This is a compelling argument for investing in collaborative practices within your organization.

    Collaboration And Teamwork: The Cornerstone of Success in Today’s Workplace

    The statistics paint a clear picture: collaboration is no longer a nice to have. It’s a game-changer. Here’s how collaboration is impacting businesses today:

    Workplace Collaboration & Teamwork Statistics
    1. Marketing Magic: Marketers are witnessing the power of collaboration firsthand. Over a quarter (28%) report that working together on marketing initiatives is a key driver of visibility (source).
    2. A Must-Have Skill: Collaboration isn’t just for marketing teams. According to Forbes, it’s one of the top 5 skills every worker needs to succeed (source).
    3. A Booming Market: The demand for collaboration tools is surging! The global market for enterprise collaboration is expected to balloon to $90.60 billion by 2028, driven by the rise of online and mobile collaboration solutions (source).
    4. Tech to the Rescue: A whopping 83% of employers leverage technology to foster collaboration (source). This includes tools like video conferencing, project management apps, and instant messaging platforms.
    5. The Future is AI-Powered: Collaboration is evolving! Over 1,500 companies are already integrating human intelligence with AI for collaborative projects (source). 
    6. In fact, 94% of companies are actively exploring solutions that combine human intelligence and AI to enhance collaboration (source).
    7. The Employee Desire: Employees crave a collaborative environment. A staggering 91.1% express a desire to work in organizations that prioritize open communication and collaboration (source).
    8. The Cost of Disunity: Both employees (97%) and employers (97%) agree a lack of teamwork hinders overall results (source).

    The message is clear: fostering collaboration through communication, technology, and open-mindedness is the key to building a successful and thriving organization.

    Teamwork: Supercharging Employee Wellbeing and Business Success (workplace collaboration and teamwork statistics)

    Effective teamwork isn’t just about achieving goals – it fosters a thriving work environment. Here’s how collaboration benefits both employees and businesses:

    Workplace Collaboration & Teamwork statistics
    1. Employee Wellbeing: Teamwork is a well-being booster! It provides essential emotional support, helping to reduce burnout for a significant 60% of workers. (source)
    2. Self-Awareness & Engagement: Collaboration enhances self-discovery. 41% of employees report that teamwork helps them identify their strengths and weaknesses, leading to increased engagement and reduced absenteeism. (source)
    3. Productivity Boost: Collaboration platforms aren’t just a fad – they’re productivity powerhouses! Forrester’s research suggests that effective team collaboration platforms can improve productivity by a remarkable 10%. This translates to employees saving 5-10% of their work time, leading to reduced stress. (source)
    4. Retention Rocket Fuel: Happy employees stay longer! Effective communication and collaboration can generate a staggering 4.5 times higher talent retention rate. (source)
    5. Happiness & Productivity Hand in Hand: Happiness is contagious, and it’s good for business! A report reveals that a positive work environment fosters a 13% increase in employee productivity. Teamwork helps create a friendlier and less stressful atmosphere, leading to happier and more productive employees. (source)
    6. The Collaboration Advantage: The numbers speak for themselves! Employees who experience effective communication and collaboration report a 72% increase in productivity, a 63% improvement in customer service, and a well-deserved 60% boost in confidence. (source)
    7. The Open Collaboration Effect: Openness breeds productivity! When teamwork and collaboration create an open environment, it leads to a significant 17% increase in worker productivity. (source)
    8. The Happiness Advantage: Happy employees are high performers! Studies show that happy employees outperform their unhappy counterparts by a remarkable 20%. This reinforces the importance of fostering a positive and collaborative work environment. (source)
    9. The Stress Factor: Workload isn’t the only culprit behind employee stress. While heavy workloads contribute to over 36% of stress, team dynamics play a surprisingly large role, impacting a whopping 92% of stress factors related to employees. This highlights the importance of fostering healthy team dynamics to create a more positive work environment. (source)
    10. The Remote Collaboration Challenge: Collaboration isn’t always seamless, especially for remote teams. A significant 16% of remote workers identify difficulties in collaboration and communication as a major hurdle. This underlines the need for effective communication strategies and collaboration tools to bridge the gap for geographically dispersed teams. (source)

    Challenges on the Path to Collaboration (workplace collaboration and teamwork statistics)

    While collaboration offers numerous benefits, it’s not without its hurdles. Here are some common roadblocks to address:

    1. Communication Breakdowns: Miscommunication is a deadline killer! Nearly a third (28%) of employees report that miscommunication is a primary culprit behind missed deadlines. (source)
    2. Alignment Blues: A team on the same page is a productive team. A staggering 97% of business leaders and employees agree that a lack of alignment within a team significantly impacts project outcomes. (source)
    3. The Shadow of Skill Overlap: Collaboration isn’t always sunshine and rainbows. Skill overlap within teams can sometimes lead to issues, along with reduced engagement and unhealthy internal competition. Careful team composition and management are crucial to mitigate these challenges. (source)
    4. Silo Mentality: Breaking down departmental barriers is key to success. A significant 41% of respondents find collaborating across departments more challenging than working within their own departments. (source)
    5.  This is further emphasized by the statistic that 75% of business executives admit their departments compete rather than collaborate on digital projects. These findings highlight the need to foster a culture of cross-functional collaboration throughout the organization. (source)
    6. Feeling Isolated, Not Inspired: Employees who feel isolated are less productive! Studies show that feelings of employee isolation can lead to a significant 21% decrease in productivity. (source)
    7. Goal Setting Gaps: Unclear goals can lead to confusion and hinder teamwork. Nearly 36% of surveyed U.S. employees admit they don’t personally track their team’s goals. (source
    8. Over half (53%) reported having limited to no visibility into other teams’ goals. This underscores the importance of setting clear, transparent goals that everyone understands. (source)

    Bridging the Distance: The Rise of Online Collaboration Tools (workplace collaboration and teamwork statistics)

    Technology is transforming the way we work together, especially for remote teams. Here’s how online collaboration tools are making a difference:

    1. Video Conferencing Takes Center Stage: A whopping 76% of the global workforce leverages video conferencing as a vital remote work tool. (source)
    2. Younger Generations Embrace Tech: There’s a clear generational preference for online collaboration tools. A significant 86% of younger employees (25-34) prefer video conferencing for online teamwork compared to just 46% of older employees (55+). This highlights the need for a variety of communication methods to cater to different preferences. (source)
    3. Tech-Savvy Collaboration: Young employees are leading the way in embracing technology for collaboration. Around 60% of younger employees effectively utilize at least three online tools to collaborate with colleagues. (source)
    4. The Collaboration Boom: The use of collaboration tools is skyrocketing! There’s been a remarkable 44% increase in these tools for work purposes between 2019 and 2021. This surge reflects the growing acceptance and importance of online collaboration in today’s work environment. (source)
    Workplace collaboration & Teamwork statistics

    The Evolution of Collaboration And Teamwork: Pre-Pandemic, Pandemic, and Beyond

    The way we collaborate has undergone a transformation:

    1. Pre-Pandemic Collaboration Landscape: Before COVID-19, in-person and online collaboration played a significant role in the workday. U.S. workers dedicated about 43% of their time to collaborative efforts. (source)
    2. The Pandemic Shift: The pandemic impacted collaboration patterns. With a shift to remote work, the percentage of time spent collaborating dropped to 27%. This highlights the need for effective strategies to foster collaboration in remote environments. (source)
    3. A Booming Collaboration Software Market: The demand for collaboration tools is surging! The global collaboration software market is projected to reach a staggering $17.9 billion by 2025. (source
    4.  with the team collaboration software market expected to reach $24.2 billion by 2027. (source)
    5. The Rise of Remote Collaboration Tools: Specific tools gained popularity during the shift to remote work. In 2020, Zoom emerged as a top choice in the U.S., with over 36% of workers using it for video conferencing. (source)
    6. The Collaboration App Surge: The need for remote collaboration solutions accelerated rapidly. In May 2020, there was a massive 176% increase in the installation of enterprise collaboration apps, reflecting the growing number of remote jobs. (source)
    7. Communication Champions: Communication is a cornerstone of collaboration. Two popular platforms, Slack and Microsoft Teams, exemplify this trend. A Slack report revealed that over 600,000 companies used Slack for team messaging in 2019. (source
    8. while a VentureBeat report indicated that over 500,000 companies utilized Microsoft Teams as a collaboration tool in the same year. (source)

    Building Strong Teams Virtually: A Growing Trend (workplace collaboration and teamwork statistics)

    Workplace Collaboration & Teamwork Statistics

    Team building isn’t just for in-person offices anymore! Here’s how virtual team building is taking center stage:

    Workplace collaboration & Teamwork Statistics
    1. The Rise of Virtual Teams: A significant portion of the global workforce (over 25%) now relies on virtual team building to foster collaboration. (source)
    2. The Future of Work: Virtual & Permanent: Virtual team setups are here to stay! A strong 64% of surveyed companies believe virtual teams will become a permanent fixture in business operations. (source)
    3. Leaders Invest in Team Culture: Business leaders recognize the value of team building. Over half (55%) believe investing in team-building activities will lead to a more positive and productive team culture. (source)
    4. Virtual Success Stories: The numbers speak for themselves! 75% of surveyed workers report experiencing improved performance remotely due to virtual team-building initiatives. (source)
    5. Global Leaders in Virtual Team Building: Singapore takes the top spot when it comes to investment in virtual team building, with the U.S. following closely behind. This reflects the growing importance of building strong virtual teams in today’s globalized workplace. (source)
    6. An Employee Desire: More Team Building: Employees crave a focus on team building! A resounding 73% of workers express a desire for their organizations to invest more in effective team-building activities. (source)
    7. Emphasizing the Widespread Need: Teamwork makes the dream work! A significant portion of the U.S. workforce – more than 50% – indicates that collaboration is essential to their daily tasks. (source)
    8. Highlighting the Value: Strong teamwork is a top priority! A whopping 75% of employees rate collaboration and teamwork as essential for success in their roles. (source)
    9. Modernizing Communication Channels: Reaching employees where they are! A significant 56% of employers are embracing online collaboration tools and social media as communication channels to engage with their employees. (source)
    10. Leaders See the Collaboration Gap: Breakdown in Teamwork = Breakdown in Success! Leaders on the front lines know it best – 86% of them identify a lack of collaboration as the primary reason for projects and initiatives falling short. (source)
    11. The Collaboration Retention Connection: Keeping your best talent? Companies that prioritize collaboration and communication have been linked to a significant drop (50%) in employee turnover. (source)
    12. The Collaboration-Happiness Connection: Feeling good at work? Teamwork might be why! Studies show that employees who collaborate with colleagues experience a jump of 17% in job satisfaction on average. (source)
    13. The Collaboration Revolution: Working together is the new normal! Over the past 20 years, there’s been a dramatic shift towards collaboration in the workplace, with a minimum increase of 50%. (source)
    14. The Collaboration Advantage: Tech-powered teamwork unlocks a happier workplace! When employees have the opportunity to collaborate effectively with the help of digital tools, their satisfaction with their jobs and the overall work environment jumps by up to 17%. (source)
    15. A Recipe for Peak Performance: Top performers excel by strategically dividing their time. 45% goes to focused individual work, 45% to collaborative teamwork, and the remaining 10% is invested in learning and social interaction – all crucial components of workplace success. (source)
    16. The Power of “We” Over “Me”: Collaboration unlocks success! Studies show that individuals working collaboratively achieve tasks more than 50% faster than their independent counterparts. (source)
    17. Employees Value Collaboration: Teamwork tops the charts! Most (52%) of U.S. employees rank teamwork as highly important in their work environment. (source)
    18. A Collaboration Disconnect: Many employees (39%) feel their colleagues don’t collaborate enough, highlighting a potential gap between perceived and desired collaboration levels. (source)
    19. Communication Room for Improvement: Only 27% of respondents felt confident in their communication skills, suggesting a need for communication training or initiatives to bridge this gap and foster more effective collaboration. (source)
    20. Emphasizing the Strong Preference: People Crave Collaboration! An impressive three-quarters (75%) of people view collaboration in the workplace as highly important. (source)
    Workplace collaboration & Teamwork statistics

    The Hidden Dollars in Teamwork (workplace collaboration and teamwork statistics):

    Studies reveal the financial benefits of fostering a collaborative work environment:

    1. Idea Sharing & Task Collaboration Boost: Simply by collaborating on tasks and sharing ideas, organizations unlock an estimated $1,660 in value per employee annually. (source)
    2. Quality Improvement Through Teamwork: Collaboration doesn’t just boost efficiency; it elevates quality! Effective teamwork is associated with an impressive $2,517 improvement in quality per employee each year.

    These numbers highlight the significant return on investment that collaboration brings to businesses. (source)

    Unlocking Success Through Collaboration:

    A Frost & Sullivan study revealed a powerful connection between collaboration and business success. Here’s how teamwork pays off:

    1. Sales Surge: Companies with strong collaboration see a remarkable 27% increase in sales, highlighting the power of teamwork in driving revenue growth. (source)
    2. Happier Customers, Higher Ratings: Collaboration fosters a customer-centric approach, leading to a 41% improvement in customer satisfaction ratings. (source)
    3. Enhanced Product Quality: When teams work together effectively, the quality of products improves by a significant 34%, ensuring customer satisfaction and brand reputation. (source)
    4. Faster Product Development: Collaboration streamlines processes, resulting in a 30% improvement in product development speed, allowing companies to stay ahead of the curve. (source)
    Workplace collaboration & Teamwork statistics

    These statistics paint a clear picture: collaboration isn’t just a feel-good notion; it’s a strategic driver of business success.

    1. Collaboration Signals Employer Investment: Working together shows you matter! Companies that prioritize collaboration are 22% more likely to have employees who feel their well-being is valued. Collaboration suggests an investment in fostering a positive work environment. (source)
    2. The Collaboration Multiplier Effect: Teamwork multiplies success! Organizations that prioritize collaboration experience a staggering fivefold increase in the likelihood of achieving high-performance status. (source)

    The Stress Factor: How Collaboration Can Be the Cure (workplace collaboration and teamwork statistics)

    1. Feeling overwhelmed at work? You’re not alone.  A whopping 80% of employees experience stress on the job. (source)
    2. Studies reveal a surprising culprit behind much of this stress: team dynamics.  A staggering 92% of work-related stress is linked to how well teams function. (source)
    3. The solution? Meaningful communication and collaboration! Experts recommend fostering open communication and teamwork as a powerful way to improve team dynamics.  This, in turn, can significantly lower stress levels and help employees avoid burnout. (source)

    By prioritizing collaboration, companies can create a more positive and productive work environment for everyone.

    Innovation Ignites, Productivity Soars: The Power of Collaboration And Teamwork

    Frost & Sullivan’s research highlights the undeniable benefits of collaboration for businesses:

    1. Innovation Powerhouse: Companies that embrace collaboration unlock a 30% boost in innovation. Teamwork fosters a dynamic environment where ideas can flourish, and creativity thrives. (source)
    2. Productivity on Autopilot: Collaboration isn’t just about good ideas; it’s about getting things done! Organizations with strong collaboration see a remarkable, at least 36% increase in productivity. Effective teamwork streamlines processes avoid bottlenecks and keeps projects moving forward efficiently. (source)

    The Impact of Remote Work on Collaboration And Teamwork:

    The shift to remote work has impacted how teams collaborate. Here’s what a recent poll revealed:

    1. Reduced Collaboration Time: Employees working full-time from home dedicate nearly half (48%) less time to collaboration compared to working in an office setting. ( source)
    2. Shifting Work Environment: The poll attributes this drop in collaboration to the significant changes in the work environment brought about by the COVID-19 pandemic. (source)

    Time Management for Remote Workers: A Breakdown (workplace collaboration and teamwork statistics)

    Research sheds light on how online employees typically distribute their workday:

    1. Focus Time Reigns Supreme: A significant portion of the workday (62%) is dedicated to focused individual work, such as completing tasks or tackling specific projects. (source)
    2. Collaboration Takes Second Place: While essential, collaboration occupies a smaller portion of the online workday, clocking in at 27%. (source)
    3. Investing in Learning and Socialization: Online employees dedicate 6% of their time to learning new skills or expanding their knowledge, while 5% is spent on social interaction with colleagues. (source)
    Workplace collaboration & Teamwork statistics

    This breakdown highlights the importance of creating a structured workday for remote employees, ensuring they balance focused work with opportunities for collaboration, learning, and social connection.

    Boosting Productivity Through Social Collaboration And Teamwork: A Generational Look

    The rise of social networks has impacted how we work together. Here’s how employees view its influence on productivity:

    1. Overall Preference for Social Collaboration: Nearly half (45%) of the workforce believes that collaborating via social networks can enhance workplace productivity. (source)

    Generational Breakdown: A closer look reveals interesting generational preferences:

    1. Tech-Savvy Millennials: The youngest generation surveyed, Millennials (born between 1981 and 1996), shows the strongest preference for social collaboration, with 50% reporting a belief in its productivity benefits. (source)
    2. Gen X Embraces Tech: Gen X (born between 1965 and 1980) follows closely behind, with 46% viewing social networks as a potential productivity booster. (source)
    3. Boomers Wary, But Open: Baby Boomers (born between 1946 and 1964) are the most cautious, with 40% acknowledging the potential benefits of social collaboration for productivity. (source)

    These statistics suggest a growing acceptance of social networks as a valuable tool for workplace collaboration, with younger generations leading the way. As technology continues to evolve, social collaboration is likely to play an increasingly important role in boosting productivity across all generations.

    Collaboration: A Blessing and a Curse in the Digital Age (workplace collaboration and teamwork statistics)

    While collaboration is a proven productivity booster, online tools can introduce new challenges.  Here’s what research reveals about distractions in the online workplace:

    1. Double-Edged Sword: Despite collaboration’s benefits, online tools can be a source of distraction. A significant portion of these distractions (41%) stem from personal conversations happening online during work hours. (source)
    2. Focus Disrupted: Incoming requests are another major distraction (39%), pulling employees away from their current tasks and projects. (source)

    These findings highlight the need for a balanced approach.  Organizations can leverage online collaboration tools for their many advantages while implementing strategies to minimize distractions and ensure employees can focus on their work.  This might involve setting communication guidelines, establishing dedicated focus times, or utilizing features within the collaboration tools themselves to manage notifications and distractions.

    The Collaboration And Teamwork Tech Landscape: A Multi-Platform World

    With nearly 90% of businesses utilizing online collaboration tools for internal communication, a diverse range of platforms have emerged to meet their needs. Here’s a breakdown of some popular choices:

    1. Microsoft Takes the Lead: Microsoft Teams emerges as the frontrunner, with 31% of businesses preferring it for communication and collaboration. (source)
    2. Strong Showing for Skype: Microsoft Skype for Business remains a popular choice for 27% of businesses, showcasing its continued relevance. (source)
    3. Google Chat Gains Traction: Google Chat claims a significant share of the market, with 21% of businesses favoring its integration with other Google Workspace tools. (source)
    4. Cisco WebEx Teams and Zoom Round Out the Options: Cisco WebEx Teams (15%) and Zoom (13%) round out the top choices, offering businesses additional options to suit their specific needs. (source)
    Workplace collaboration & Teamwork statistics

    This variety reflects the evolving nature of workplace communication. Businesses can choose the platform that best aligns with their existing workflows, team size, and desired functionalities.

    The Rise of Video Conferencing in 2019 (workplace collaboration and teamwork statistics):

    A 2019 report by Life-size, the “2019 Impact Of Video Conferencing Report,” revealed a surge in video conferencing adoption at work:

    1. Video Calls on the Rise: Significantly more employees (48%) reported using video conferencing more frequently in 2019 compared to just two years prior. This highlights a growing preference for face-to-face interaction, even in a virtual setting. (source)
    2. Young Professionals Embrace Video: The study found that young professionals (aged 18-29) were leading the video conferencing charge, with a significant portion (25%) using it daily. This suggests a comfort level with technology and a desire for real-time collaboration. (source)
    3. Innovation Through Video: Interestingly, over half (51%) of survey respondents associated companies using video conferencing with being more innovative. This suggests a perception that video calls foster better communication and idea exchange, ultimately leading to a more innovative work environment. (source)

    These statistics paint a clear picture: by 2019, video conferencing was rapidly becoming a preferred method of communication in the workplace, especially among younger generations. It was not only seen as a convenient tool but also linked to fostering a more innovative work culture.

    Building Stronger Teams in 2024: Trends and Strategies for the Modern Workplace (workplace collaboration and teamwork statistics)

    In today’s dynamic business landscape, effective teamwork is no longer a luxury – it’s a necessity.  As we navigate a world shaped by remote work, hybrid teams, and an emphasis on innovation, the way we collaborate continues to evolve.

    This guide explores the latest trends in teamwork, providing valuable insights and actionable strategies you can leverage to:

    • Boost team morale and engagement in an era of dispersed workforces.
    • Optimize communication and collaboration, fostering a culture of innovation and problem-solving.
    • Develop strong team relationships that transcend physical distance.

    By understanding these trends and implementing the right strategies, you can empower your teams to achieve peak performance and propel your business model forward in 2024 and beyond.

    The Future of Teamwork (workplace collaboration and teamwork statistics): Embracing Collaboration in a Virtual World

    The COVID-19 pandemic has fundamentally reshaped the way we work. Gone are the days of centralized offices and traditional team dynamics. Now, businesses are embracing a virtually connected work environment.

    This shift has sparked a wave of innovation in team collaboration, with companies adapting their management styles and utilizing a robust suite of communication and collaboration tools.  In this dynamic landscape, staying ahead of the curve is crucial.

    This resource will delve into the latest team collaboration trends for the virtual workplace. We’ll explore how companies are:

    • Leading virtual teams effectively in this new normal.
    • Leveraging technology to bridge geographic distances and foster seamless collaboration.
    • Building strong team connections despite physical separation.

    By understanding these trends, you can equip your teams with the tools and strategies they need to thrive in the virtual workspace and unlock their full potential.

    Collaboration And Teamwork Trends

    1. Feedback (workplace collaboration and teamwork statistics): The Fuel for High-Performing Teams

    Effective teamwork hinges on clear and consistent feedback. A recent survey of 1,000 U.S. employees underscores this notion: a staggering 74% of respondents identified frequent constructive feedback as a hallmark of high-performing teams.

    This feedback loop empowers teams to continuously improve their strategies and execution. Recognizing this, organizations are placing a greater emphasis on providing constructive feedback that motivates and inspires employees, particularly those working remotely.

    To facilitate this, companies are increasingly investing in sophisticated collaboration and communication tools that enable seamless feedback exchange, regardless of location.  This investment not only strengthens team dynamics but also paves the way for sustained high performance.

    2. Communication Tools (workplace collaboration and teamwork statistics): Building Bridges in the Virtual Workplace

    Workplace collaboration & Teamwork statistics

    The rise of virtual teams, geographically dispersed and operating across time zones, has placed a premium on clear and efficient communication. As the demand for workplace flexibility continues to grow, companies are strategically shifting from on-premise collaboration tools to cloud-based solutions.

    Workplace collaboration & Teamwork statistics

    These cloud-based tools offer a multitude of benefits:

    • Seamless Communication: They enable real-time communication across locations, ensuring everyone stays on the same page.
    • Enhanced Collaboration: Team members can work together on projects, share files, and provide instant updates regardless of their physical location.
    • Accessibility Across Devices: Accessibility on various devices (desktops, laptops, mobile phones) empowers everyone to stay connected and contribute, fostering a truly inclusive work environment.

    The market offers a diverse range of tools to cater to specific needs, including:

    • Video conferencing: Enables face-to-face interaction for building rapport and fostering teamwork.
    • Conference chat services: Facilitate real-time conversations and quick updates.
    • Commenting systems: Enable collaborative feedback and document editing.

    Additionally, all-in-one solutions, such as email-based project management tools, streamline workflow by allowing teams to manage projects and communicate within a familiar platform, such as their email.

    By investing in the right communication tools, companies can bridge geographical distances, create a more connected workforce, and unlock the full potential of their virtual teams.

    3. The Metaverse (workplace collaboration and teamwork statistics): A Collaborative Frontier (Emerging Technology)

    The emergence of the metaverse, a virtual world where users can interact and collaborate, presents exciting possibilities for the future of teamwork.

    • Enhanced Collaboration: Companies are exploring the potential of creating virtual workspaces within the metaverse, allowing geographically dispersed teams to feel more connected and collaborate as if they were in the same physical location.
    • Bridging the Distance Gap: By utilizing Augmented Reality (AR) and Virtual Reality (VR) technologies, teams can hold meetings and work together in virtual environments that mimic physical offices, fostering a sense of presence and shared experience.
    • Idea Sharing & Innovation: These virtual spaces allow for dynamic idea-sharing and collaborative problem-solving, potentially sparking innovation and creativity within teams.

    It’s important to acknowledge that the metaverse is still a developing technology, and its potential impact on teamwork is an ongoing discussion.  While not all companies are currently implementing it,  those pioneering this approach are exploring its capabilities to unlock new avenues for collaboration and build a more immersive and engaging work experience.

    4. Asynchronous Collaboration (workplace collaboration and teamwork statistics): Embracing Flexible Work Schedules

    The rise of remote and hybrid work models has fueled the popularity of asynchronous collaboration. This approach allows team members to contribute to projects on their own schedules without requiring real-time interaction.

    • Flexibility for Remote Teams: Asynchronous collaboration empowers remote teams by granting them the flexibility to work when they are most productive, regardless of location or time zone.
    • Employee Preference: A Buffer study revealed that a significant 52% of employees desire asynchronous work policies. This approach caters to individual work styles and preferences, potentially leading to increased employee satisfaction and engagement.
    • Accessibility and Convenience: Asynchronous collaboration tools and platforms allow employees to access project materials and contribute their work at their convenience, fostering a more inclusive work environment.

    By embracing asynchronous collaboration, companies can unlock the benefits of a flexible workforce. This will empower employees to contribute their best work while maintaining a healthy work-life balance.

    Building Strong Teams in a Virtual World: Trends and Strategies for 2024 and Beyond

    Team building has always been a cornerstone of effective collaboration. However, the rise of remote and hybrid work models necessitates a shift in our approach.  This guide explores the latest trends in virtual team building, providing valuable insights and actionable strategies you can leverage to:

    • Foster strong team connections despite physical separation.
    • Boost team morale and engagement in a geographically dispersed workforce.
    • Cultivate a sense of belonging and shared purpose within your virtual teams.

    By embracing these trends and implementing the right strategies, you can ensure your virtual teams thrive in the new world of work.

    The Remote Revolution: Why Virtual Team Building Matters More Than Ever

    The surge in remote work arrangements is undeniable. As more companies adopt flexible work models, the ability to build and maintain strong teams across distances becomes paramount.

    Statistics show that remote work is here to stay, making virtual team building a critical investment.  This section will delve deeper into the reasons why virtual team building is essential for success in today’s workplace.

    1. The Rise of Hybrid Teams (workplace collaboration and teamwork statistics): A New Era of Work

    The concept of hybrid work, where employees split their time between working in an office and remotely, has gained significant traction in recent years.  According to Murray Seward, CEO of Outback Team Building and Training,  hybrid work models are poised to become increasingly dominant in the professional landscape.

    This shift presents both opportunities and challenges for organizations:

    • Adapting to Hybrid Work: Businesses must decide on the most suitable hybrid model for their needs, whether it’s a specific number of in-office days or a more flexible approach.
    • Unlocking Potential: Hybrid models leverage the benefits of both in-person and remote work, potentially boosting productivity and employee satisfaction.
    • Addressing Remote Work Challenges: Effective management of remote teams remains crucial. This includes fostering a strong company culture, building positive relationships despite physical distance, and finding creative ways to facilitate collaboration and teamwork in a virtual environment.

    By taking a proactive approach to these considerations, organizations can design successful hybrid work models that create a thriving and engaged workforce.

    2. Prioritizing In-Person Events for Stronger Connections (workplace collaboration and teamwork statistics)

    The rise of remote work highlights the importance of fostering strong team relationships.  To bridge the physical gap and build stronger bonds, consider the following:

    • Increased Frequency of In-Person Events: Move beyond annual team-building activities and schedule more frequent in-person gatherings. This allows team members to connect on a more personal level, fostering a sense of camaraderie and belonging.
    • Structured Activities for Engagement: Plan well-structured activities that encourage interaction and participation from all team members. This could involve team-building exercises, social events, or workshops that are both enjoyable and promote a sense of connection.
    • Focus on Organic Relationship Building: While structured activities provide a framework, the ultimate goal is to create opportunities for organic relationship building. These events should allow for informal interactions and conversations, fostering a more cohesive and collaborative team spirit.

    By prioritizing in-person events, companies can bridge the physical divide inherent in remote work and nurture strong team connections – a critical ingredient for a successful and engaged workforce.

    Note: I’ve replaced “inorganic relationship” with “organic relationship building,” as the former suggests a forced or artificial connection,  while the latter emphasizes fostering genuine connections.

    3. Tech-Powered Team Building (workplace collaboration and teamwork statistics): Fostering Collaboration in the Virtual Sphere

    The rise of virtual teams has fueled the innovative use of technology to facilitate team building.  This shift offers exciting possibilities:

    • Enhanced Engagement: Technology takes team building to a new level by offering interactive and engaging virtual activities. These activities promote participation and create a more fun and dynamic environment for remote teams.
    • Focus on Real Production Value: Companies are seeking solutions that go beyond basic virtual interaction. Tech-powered team-building platforms offer high-quality experiences with real production value, ensuring a professional and engaging atmosphere.
    • Promoting Teamwork Skills: Virtual games and activities can be specifically designed to hone critical teamwork skills like creative problem-solving and critical thinking. Examples include virtual escape rooms ( Jewel Heist ) or collaborative online challenges.

    By strategically leveraging technology, organizations can create engaging virtual team-building experiences that foster connections and enhance essential teamwork skills. This empowers remote teams to collaborate effectively and achieve outstanding results.

    4. Breaking Down Silos (workplace collaboration and teamwork statistics): The Rise of Cross-Departmental Collaboration

    2023 witnessed a surge in cross-departmental team building, and this trend is expected to continue its upward trajectory in 2024.  A growing number of companies recognize the value of fostering interactions and collaboration beyond individual teams.  This shift offers significant advantages:

    • Breaking Down Departmental Silos: By encouraging cross-departmental interaction, companies can break down silos that may exist between departments. This fosters a more collaborative and integrated work environment, leading to better information sharing and problem-solving.
    • Maximizing Company Performance: Cross-departmental collaboration allows teams to leverage diverse perspectives and skill sets. This synergy can lead to more innovative solutions and, ultimately, maximize overall company performance.
    • Preserving Company Culture: In a remote work environment, maintaining a cohesive company culture can be challenging. Cross-departmental activities create opportunities for employees across different departments to connect and build relationships, fostering a stronger sense of shared purpose and belonging.

    By embracing cross-departmental team building, organizations can unlock the full potential of their workforce and cultivate a collaborative culture that drives success, regardless of physical location.

    5. Adapting Recruitment Strategies for the Remote Landscape (workplace collaboration and teamwork statistics)

    The rise of remote work presents new challenges for talent acquisition and assessment.  Previously, direct observation during the hiring process allowed for easier evaluation of a candidate’s cultural fit.  However, remote interactions necessitate a shift in strategy:

    • Prioritizing Cultural Alignment: In a virtual environment, ensuring a strong cultural fit remains crucial for maintaining company culture. Employers are implementing more structured methods to assess a candidate’s alignment with company values, such as behavioral interviewing techniques and in-depth discussions about company culture during the interview process.
    • Evaluating Skills Virtually: Remote hiring necessitates evaluating essential skills through reliable virtual assessments. This could involve online simulations, project-based tasks, or pre-recorded presentations that showcase a candidate’s capabilities beyond a traditional interview setting.
    • Building Trust During Remote Interviews: Creating a positive and engaging interview experience is essential in a virtual setting. Employers are focusing on clear communication, providing opportunities for candidates to ask questions, and utilizing technology effectively to create a professional and trustworthy first impression.

    By adapting their recruitment strategies for the remote landscape, companies can continue to attract and hire top talent who are not only skilled but also a strong cultural fit for their organization.

    6. The Power of Purposeful Communication (workplace collaboration and teamwork statistics): Building Bridges in the Virtual Workplace

    Effective communication is the cornerstone of successful teamwork, and this is especially true in virtual environments.  Purposeful communication, where every team member expresses ideas and information clearly and with a specific goal in mind, offers significant benefits:

    • Enhanced Productivity: Research shows that purposeful communication can boost employee productivity by a remarkable 60%. This is because clear and concise communication minimizes misunderstandings, delays, and wasted time.
    • Stronger Understanding and Alignment: When team members communicate purposefully, they actively listen to each other, fostering a deeper understanding of individual perspectives and project goals. This leads to better collaboration and a higher likelihood of achieving desired outcomes.

    Here are some key strategies to promote purposeful communication in your virtual teams:

    • Clarity and Concision: Team members should strive to articulate their thoughts and ideas clearly and concisely, ensuring their message is understood accurately. This might involve using bullet points, visuals, or screen-sharing tools to enhance clarity.
    • Active Listening: Effective communication is a two-way street. Active listening, where team members pay close attention to each other’s contributions and ask clarifying questions, is essential.
    • Adaptability: Communication styles can vary. Being adaptable and tailoring communication methods to the audience (written vs. verbal, individual vs. group) ensures everyone feels heard and understood.
    • Non-Verbal Communication: Even in a virtual setting, non-verbal cues like body language and tone of voice matter. Encourage team members to use video conferencing whenever possible to enhance communication and build rapport.
    • Reflection and Feedback: Regular reflection on communication effectiveness is crucial. Encourage team members to provide constructive feedback to each other in a safe and supportive environment. This will help everyone continuously improve their communication skills.

    By prioritizing purposeful communication, companies can empower their virtual teams to collaborate effectively, achieve goals, and build a strong sense of connection despite physical distance.

    7. Embracing Diversity and Inclusion (workplace collaboration and teamwork statistics): Building a Stronger Team

    Diversity and inclusion (D&I) are not just buzzwords; they are essential ingredients for successful team building in today’s workplace.  Here’s why:

    • Fueling Innovation: Teams composed of individuals from diverse backgrounds bring a wealth of unique ideas, perspectives, and skills to the table. This fosters a culture of innovation and creativity, leading to better problem-solving and groundbreaking solutions.
    • Tackling Complex Challenges: Diverse teams are better equipped to tackle complex problems. Each member brings a different lens to the situation, allowing for a more comprehensive analysis and a higher chance of finding effective solutions.
    • Boosting Employee Engagement: A culture that embraces D&I fosters a sense of belonging and psychological safety for team members. This leads to increased employee engagement, motivation, and a willingness to contribute their best work.
    • Building Stronger Relationships: D&I initiatives encourage collaboration and understanding across differences. This builds stronger relationships within teams, ultimately fostering a more cohesive and supportive work environment.

    By prioritizing D&I, companies can create high-performing teams that leverage the collective power of diverse perspectives and experiences. This fosters a more innovative, engaged, and successful workforce.

    The Future of Teamwork: Embracing Collaboration in a Virtual World

    The statistics presented in this report underscore the undeniable power of collaborative teamwork. Effective teamwork fuels organizational success fosters a positive work environment and empowers employees to achieve remarkable results.

    However, the workplace landscape is evolving.  The rise of virtual and hybrid work models necessitates a shift in our approach to team building and collaboration.

    The good news is there’s a wealth of innovative strategies and technologies at our disposal. By embracing purposeful communication, fostering a culture of diversity and inclusion, and leveraging the latest virtual team-building trends, organizations can cultivate high-performing teams that thrive in a remote or hybrid environment. Remember, successful teams are built on a foundation of mutual respect, clear communication, and a shared sense of purpose.  By prioritizing these elements and continuously adapting your approach, you can unlock the full potential of your workforce and ensure your organization remains competitive in the ever-changing world of work.

  • 100+ Important Video Game Addiction Statistics, Facts & Trends 2025

    100+ Important Video Game Addiction Statistics, Facts & Trends 2025

    Video Game addiction statistics

    Here are some video game addiction statistics, facts, and trends to help you in 2024 and beyond;

    Buckle Up: Diving Deep into Video Game Addiction

    Video games: fun pastime or potential pitfall? Let’s enjoy the wild world of video game addiction statistics!

    We’re all familiar with that feeling – when gaming goes from a casual hobby to a full-on obsession. The line between enjoyment and addiction can be blurry. But video game addiction, also known as Internet Gaming Disorder (IDG), is a real issue with growing recognition.

    The WHO classified it as a mental health disorder in 2022. Now, that’s a game-changer!

    But what does this all mean? Here’s the scoop: we’ve got 82 eye-opening video game addiction statistics to shed light on what’s happening behind the screen.  Forget dry numbers – this is like peering into the unfiltered world of our gaming habits.

    So, grab your controller (figuratively, for now) and get ready for a real talk about the ups and downs of video gaming. Let’s keep it honest!

    Video Game addiction statistics

    Game Over? A Look at Video Game Addiction Numbers

    Here’s a breakdown of some key stats on video game addiction:

    • Millions in the Game: A staggering 60 million people worldwide are estimated to be struggling with gaming disorders.
    • A Gender Gap: Guys seem to be more susceptible, with 75-90% of video game addiction cases affecting males.
    • The 3-4% Club: Around 3-4% of gamers globally are battling internet gaming disorders.
    • The Daily Grind: If you’re clocking over 10 hours a day or 30 hours a week on video games, it might be time to re-evaluate your habits – that’s considered addiction territory.
    • Multiplayer Mania: In the US, 22% of gamers spend a massive chunk (61-80%) of their gaming time on multiplayer games. Talk about teamwork (or team obsession)
    • Rocket Woes: Rocket League currently holds the crown for the most addictive game, with over 14.5% of reviewers labeling it so.
    • Teens at Risk: Adolescence seems to be a vulnerable time, with video game addiction rates ranging from 4% to a concerning 20% among young people.

    Global Video Game Addiction Statistics

    Unveiling the Video Game Landscape ( Video Game Addiction Statistics ): Stats and Trends

    Here’s a breakdown of some key statistics and trends shaping the world of video games:

    1. Millions in the Game: A staggering 60 million people globally are estimated to be struggling with gaming disorders (source).
    2. Gaming on the Rise: The video game market is booming, with projected revenue reaching a whopping $282.3 billion in 2024 and expected to keep growing at a healthy clip (source). 
    3. By 2027, the market is expected to be worth a cool $363.2 billion! (source)
    4. Global Gamer Growth: The number of video game users is projected to climb to a massive 1.4 billion by 2027 (source). Get ready for some serious online competition!
    5. Scientific Studies Confirm: A 2021 scientific review found a global prevalence of gaming disorder around 3.05% (source).
    6. US Gamers Take Charge: The United States boasts a hefty online gaming population, with an estimated 160 million adults playing online games (source).
    7. UK Gamers on the Rise: The UK gaming scene is thriving, with the number of video game users expected to reach a significant 57.56 million by 2027 (source).
    8. Where’s the Line? Spending over 10 hours a day or 30 hours a week on video games is considered addiction territory (source). Remember, moderation is key!
    9. Average Gamers: The typical video gamer enjoys about 6 hours of playtime each week (source).
    10. Teens and Tech: Teenagers spend a significant amount of time on video games, averaging almost 2 hours daily (source).
    11. At-Risk Population: It’s important to note that between 0.3% and 1% of the general population experience symptoms linked to gaming disorder (source).
    12. Warning Signs: Preoccupation with gaming is a red flag for potential video game addiction (source). Be mindful of your gaming habits and their impact on your life.

    Video Games: The Good, the Bad, and the Playtime

    Here’s a look at some interesting trends and potential drawbacks of video games:

    Video Game addiction statistics
    1. Pandemic Play Boost: The COVID-19 lockdowns fueled a global gaming surge, with average playtime jumping by a significant 39% (source).
    Video Game addiction statistics
    1. South Korea’s Gaming Economy: In South Korea, video game addiction comes with a hefty price tag – an estimated annual cost of $3.5 billion. (source)
    2.  However, the gaming industry there also generates a substantial annual gain of $24.3 billion (source). Interesting duality!
    3. US vs. Global Playtime: American gamers clock in at an average of 7.71 hours per week, while the global average sits slightly higher at 8.45 hours (source). Who are the world champions of playtime?
    4. Lockdown Loneliness and Lost Hygiene: A concerning statistic: around 30% of Britons reportedly skipped meals and showers during the 2020 lockdowns in favor of video games (source). Remember, self-care is important!
    5. Gender Gap in Gaming Disorders: Men seem to be more susceptible to gaming disorders compared to women (source).
    6. Gamers vs. Addicted Gamers: The average gamer is 35 years old, while someone struggling with a gaming addiction is typically younger, around 24 years old (source).
    7. WHO Sounds the Alarm: According to the World Health Organization, an estimated 3% of the global population suffers from internet gaming disorder (source).

    Age and Addiction (Video Game Addiction Statistics): Who’s Most at Risk?

    While anyone can develop a gaming addiction, some age groups seem to be more susceptible:

    Video Game addiction statistics
    1. Teens and Tech Addiction: Teens appear to be particularly vulnerable, with the prevalence of video game addiction among them rising by 4% since 2007 (source). It’s important to find a healthy balance.
    2. The Multiplayer Mindset: A significant portion of American gamers (22%) dedicate a massive chunk of their playtime (61-80%) to multiplayer games (source). This intense focus on online competition can have implications for how people interact and prioritize activities.
    3. Sleepless in Seattle (or Anywhere You Game): A survey revealed a concerning trend: 67% of gamers admitted to frequently sacrificing sleep for continued gaming sessions (source). Remember, a healthy sleep schedule is crucial for overall well-being.
    4. The Dark Side of the Game: Research suggests a link between internet gaming disorder and difficulties with decision-making, impulse control, and emotional regulation (source). These challenges can affect various aspects of life.
    5. Mental Health Concerns: Video game addiction can be a contributing factor to sleep disorders, depression, and anxiety (source). It’s important to seek help if you’re experiencing these issues.
    6. The Vast Majority: Thankfully, the vast majority of gamers (90%) don’t exhibit dangerous or long-term problematic behaviors related to gaming (source). This is a positive takeaway!

    Top Contenders (Video Game Addiction Statistics): The Games Gamers Can’t Quit

    While enjoyment is a core part of gaming, some titles seem to be particularly captivating:

    1. Rocket League Takes the Crown: Currently, Rocket League reigns supreme as the most addictive game, with a whopping 14.53% of reviewers labeling it so (source). Buckle up for intense car-soccer action!
    2. Littlewood Lures You In: Littlewood nabs the second spot, with 12.50% of reviewers finding it highly addictive (source). This game might be more captivating than you bargained for!
    3. Animal Crossing: Charmingly Addictive?: Believe it or not, the seemingly peaceful Animal Crossing: New Horizons makes the list at number 13, with 1.58% of reviewers finding it addictive (source). Who knew island life could be so engrossing?
    4. The Sims 4: Not Quite as Gripping: The Sims 4, known for its life simulation gameplay, sits lower on the list with only 0.97% of reviewers tagging it as addictive (source). It seems managing virtual lives can be slightly less captivating than some other options.
    5. Dota 2: The Moderate Challenge?: Dota 2, a popular online battle arena game, sits at a score of 1.68% of reviewers finding it addictive (source). This suggests a slightly lower potential to become all-consuming compared to the top contenders.
    6. Tom Clancy’s Rainbow Six Siege: A Strategic Simmer?: Tom Clancy’s Rainbow Six Siege nabs a spot with 2.02% of reviewers labeling it addictive (source). The strategic elements might provide a different kind of appeal compared to fast-paced action games.
    7. The Elder Scrolls V: Skyrim: A Moderately Enchanting Adventure?: The Elder Scrolls V: Skyrim, a sprawling open-world RPG, comes in with 1.35% of reviewers finding it addictive (source). The vast world might offer a captivating experience, but perhaps at a slower pace.
    8. Counter-Strike: Global Offensive: Strategic Sprays (and Not-So-Addictive Plays?) Counter-Strike: Global Offensive, another popular online shooter, sits at 1.27% of reviewers considering it addictive (source). The tactical gameplay might provide a strategic challenge without necessarily being all-consuming.
    9. Fallout 3: Post-Apocalyptic Appeal (But Not Overly Gripping): Fallout 3, a post-apocalyptic RPG, scores 1.28% of reviewers finding it addictive (source). The unique setting offers a different kind of immersion, but perhaps with a less intense hold on players.
    10. Call of Duty Black Ops III: A Soldier’s Life (With Moderate Captivation): Call of Duty Black Ops III, a first-person shooter, rounds out the list with 1.22% of reviewers labeling it addictive (source). The action-packed gameplay might be moderately captivating, but not necessarily lead to uncontrollable play sessions.
    11. The Demigod Dilemma: Demigod comes in third place, with 10.77% of reviewers finding it addictive (source). Be warned – this game might have a godlike hold on your playtime!
    12. Stardew Valley’s Allure: Stardew Valley, the charming farming simulator, nabs the fourth spot with 6.67% of reviewers labeling it addictive (source). Don’t underestimate the captivating pull of virtual farm life!
    13. League of Legends: Competitive Craving?: League of Legends, a popular online battle arena game, sits at number five with 4.28% of reviewers finding it addictive (source). The competitive nature might be what keeps players hooked.
    14. Path of Exile: Less is More (Relatively Speaking): Path of Exile holds the interesting distinction of having a negative addiction score (-3.60%) based on reviewer data (source). This suggests it’s less likely to be seen as highly addictive compared to other games on the list.
    15. My Time at Portia: Crafting Calmly?: My Time at Portia, a relaxing crafting and simulation game, scores 3.33% on the reviewer addiction scale (source). The laid-back gameplay might offer a more chill experience.
    16. Fortnite: Not Quite a Frenzy?: Fortnite, the popular battle royale game, comes in at 2.59% of reviewers finding it addictive (source). This suggests it might be less likely to trigger uncontrollable play sessions compared to some other entries.
    17. Planetside 2: Large-Scale Battles (Without Extreme Addiction?): Planetside 2, a large-scale online shooter, nabs a spot with 2.38% of reviewers labeling it addictive (source). The focus on large-scale battles might offer a different kind of appeal, potentially with less individual player obsession.
    18. Frostpunk: The Management Challenge (Not the Addiction Trap): Frostpunk, a city-building survival game, scores 3.89% on the reviewer addiction scale (source). The strategic management aspects might provide a different kind of engagement, potentially with less risk of excessive play.
    19. The Realm of MMORPGs: According to Statista, the massive multiplayer online role-playing genre (MMORPG) takes the crown as the genre with the highest perceived addiction risk (source). These vast online worlds can be incredibly captivating.
    20. MOBA: The Thrill of Competition: Multiplayer Online Battle Arena (MOBA) games, known for their intense team-based battles, also rank high in perceived addiction risk (source). The competitive nature and strategic depth can be highly engaging.
    21. Beyond the Top Contenders:  (source) Here’s a look at how other genres fare on the addiction scale (all based on reviewer data):
      1. Social Simulation: 5.92%
      2. MOBA Battle Arena: 3.58% (slightly lower risk than standard MOBAs)
      3. Multiplayer Online Sports: 2.96%
      4. Action Role-playing: 1.28%
      5. Survival: 1.12%
      6. Tactical Shooter: 0.55%
      7. Action Adventure: 0.35% (considered low risk)
      8. Battle Royale: 0.52% (lower risk than standard MOBAs)
      9. First-person Shooter: 0.75%

    Gender Gap in Gaming Addiction (Video Game Addiction Statistics)

    While anyone can develop a gaming addiction, research suggests a gender disparity:

    Video Game addiction statistics
    1. Men at Higher Risk: Males appear to be significantly more susceptible to video game addiction, making up an estimated 75-90% of reported cases (source).
    2. Women and Gaming Addiction: Women are not immune, but they account for a smaller portion of cases, at around 10-25% (source). It’s important to note that these are general trends, and individual experiences can vary.

    Age and Vulnerability (Video Game Addiction Statistics): Who’s Most at Risk for Video Game Addiction?

    While video game addiction can affect anyone, certain age groups seem to be more susceptible:

    1. Children and Gaming: Among children aged 8-18, an estimated 8.5% are grappling with video game addiction (source). This highlights the importance of parental guidance and healthy gaming habits for younger players.
    2. The Teenage Tech Trap: Adolescence, particularly between 13-18 years old, appears to be a prime time for video game addiction, with prevalence rates ranging from 4% to a concerning 20% (source).
    3. Young Adults and Gaming: Young adults (18-24 years) also face significant risk, with studies reporting addiction rates between 5% and 10% (source). Balancing gaming with other life responsibilities becomes crucial during this period.
    4. Gaming Across Generations: Even adults aged 25 and above can experience video game addiction, with prevalence rates varying from 2% to 5% (source). It’s a reminder that responsible gaming practices are important for all ages.

    Global Gaming Landscape (Video Game Addiction Statistics): Addiction Rates Around the World

    Video game addiction is a concern that transcends national borders. Here’s a glimpse into the situation in different countries:

    1. The UK Gaming Scene: An estimated 700,000 to 1 million UK gamers, roughly 2-3% of the population, struggle with video game addiction (source). 
    2. This highlights the issue’s prevalence. However, it’s important to note that over a quarter (26%) of UK adults play online games casually, averaging 1-5 hours per week (source). 
    3. Before lockdowns, the average UK gamer spent a more significant chunk of time playing, clocking in at 13 hours weekly (source). This suggests a potential pre-lockdown issue with excessive gaming habits.
    4. Australia’s Gaming Landscape: A study by Macquarie University revealed that 2.8% of Australian adolescents meet the criteria for internet gaming disorder (source).
    5.  Interestingly, the study also found a significant gender gap, with boys (96%) being far more likely to be addicted than girls (6%) (source).
    6.  Despite this, video games remain popular in Australia, with 67% of the population playing regularly and averaging 89 minutes of daily playtime (source).
    7. Gaming addiction rates were higher among males than females, with 96% of boys and 6% of girls exhibiting addiction tendencies. (source)
    8. Approximately 67% of Australians engage in regular video game play, dedicating an average of 89 minutes to gaming daily. (source)
    9. The government of Japan has officially recognized video game addiction as a public health concern. (source)
    10. Research indicates that Singaporean teenagers devote more time to gaming compared to their American counterparts, spending 20 and 13 hours on average, respectively. (source)
    11. In Taiwan, a 2018 survey revealed that around 6% of adolescents exhibited severe addiction to online gaming. (source)
    12. A survey conducted in Thailand identified video game addiction among children aged 6 to 18 years old. (source)
    Video game addiction statistics

    The Global Gaming Landscape (Video Game Addiction Statistics): Players, Risks, and Rewards

    The world of video games is booming! Here’s a look at some interesting trends:

    1. Gamers on the Rise: Over two billion people worldwide play video games, and that number is projected to hit a staggering three billion by 2023 (source).
    2. The Grip of Gaming: While most gamers enjoy a healthy balance, a small percentage struggle with addiction. Estimates suggest that up to 4% of gamers and 3.05% of the global population experience gaming disorder (source). This translates to roughly 60 million people worldwide.
    3. Not Everyone Gets Hooked: It’s important to remember that addiction is not the norm. While some people might exhibit symptoms associated with gaming disorder (between 0.3% and 1% of the general population), responsible gaming is the reality for the vast majority (source).
    4.  In the US, for instance, only 10% of adults who play video games consider themselves avid gamers (source).
    5. The Allure of the Game: Games can be truly engaging! The dopamine rush experienced while playing is a well-documented phenomenon (source). 
    6. Thankfully, most gamers (around 90%) don’t exhibit dangerous or long-term negative behaviors due to their playtime (source).

    Video Games (Video Game Addiction Statistics): A Global Phenomenon with Potential Challenges

    The world of video games is vast and ever-changing. Here’s a look at some interesting trends and potential issues:

    1. The Pandemic Playtime Boom: Lockdowns fueled a global gaming surge, with the average playtime jumping a significant 39% (source).
    2. Gaming and ADHD: A Link to Consider: Research suggests a connection between symptoms of ADHD and varying levels of video game addiction (source). It’s important to consult a healthcare professional if you suspect ADHD.
    3. Gaming Disorder on the Rise: The worldwide prevalence of gaming disorder reached 3% in 2019 (source), highlighting a growing concern.
    4. The American Gamer: The average American gamer spends 7.71 hours per week playing video games (source). Finding a healthy balance is key.
    5. A Global Perspective: Studies show that between 0.3% and 1% of the general population worldwide exhibit signs of internet gaming disorder (source).
    6. Lockdown’s Dark Side: A concerning statistic emerged during the 2020 lockdowns: around 30% of Britons reportedly neglected meals and showers in favor of video games (source). Prioritizing self-care is crucial.
    7. Gaming Rules in China: China enforces stricter regulations on youth gaming, limiting weekday playtime to 90 minutes (source).
    8. Growth of Gaming Disorder: A large-scale study spanning 2009 to 2019 revealed a 3% increase in the global prevalence of gaming disorders by 2019 (source). This suggests a need for awareness and responsible gaming practices.
    Video game addiction statistics

    Navigating the Gaming Landscape (Video Game Addiction Statistics): Stats, Trends, and Age Groups

    The world of video games is multifaceted, with a range of players, habits, and potential risks. Here’s a breakdown of some key statistics:

    1. Gaming Disorder Prevalence: Estimates for the prevalence of gaming disorder vary slightly. Some studies suggest 3%, while others indicate a lower rate of 1.96% (source). Regardless, it’s an issue to be aware of.
    2. Gender Gap in Gaming Addiction: Men seem to be more susceptible to gaming disorder than women, with a current ratio of roughly 2.5 men to 1 woman experiencing the condition (source).
    3. Global Gaming Habits: The average American gamer spends 7.71 hours playing video games per week (source). 
    4. This pales in comparison to China, where the average jumps to a significant 12.39 hours weekly (source).
    5.  Vietnam follows closely behind with an average of 10.16 hours (source
    6. highlighting a global phenomenon with regional variations. The worldwide average sits at 8.45 hours weekly (source).
    7. American Gamers by Age: Interestingly, statistics from 2017 indicate that over 22% of American gamers dedicate 61-80% of their playtime to online multiplayer games on PC (source).
    Video game addiction statistics
    1.  A wider look reveals that a staggering 90-99% of American kids play video games (source)
    2. with 48-56% of young adults also engaging regularly (source).
    3.  The average gamer falls between 18 and 34 years old (source)
    4.  while the average person with a gaming addiction is slightly younger at 24 (source).
    5. Gaming Addiction in Youth: While most gamers enjoy a healthy balance, youth addiction is a concern. Studies suggest that 8% of kids and adolescents globally could be struggling with video game addiction (source). 
    6. This highlights the importance of parental guidance and age-appropriate gaming habits. Furthermore, the prevalence of video game addiction among teenagers appears to be on the rise, with a 4% increase since 2007 (source).

    Canada’s Thriving Gaming Scene (Video Game Addiction Statistics): Players, Profits, and Popularity

    Video game addiction statistics

    The video game industry is a booming sector in Canada:

    1. Powering Up the Economy: The industry’s contribution to Canada’s GDP is impressive, reaching $4.5 billion in 2019 (source).
    2. A Nation of Gamers: Gaming isn’t just for a niche group. A whopping 94% of Canadians aged 18-34 are gamers (source). 
    3. This enthusiasm extends beyond this age range, with 64% of the entire Canadian population, roughly 23 million people, playing video games regularly (source). These statistics highlight the widespread popularity of gaming in Canada.
    4. The Growing Gamer Nation: The number of Canadians who play video games regularly has surged, jumping from 19 million in 2015 to a significant 24 million in 2020 (source). This highlights the increasing popularity of gaming across the country.
    5. A Shadow Over the Fun?: While gaming offers enjoyment for many, a 2017 CAMH study raises a concern. It found that nearly 12% of Ontario university students exhibit signs of video game addiction (source), suggesting a potential issue, particularly among young adults.
    6. Potential Scope of Addiction: Estimates suggest that video game addiction could impact between 470,400 and 720,000 Canadians (source). 
    7. Additionally, some studies indicate that as many as 3 million Canadian gamers might be at risk of unhealthy gaming habits (source). These numbers highlight the need for awareness and responsible gaming practices.

    The UK Gaming Landscape (Video Game Addiction Statistics): A Look at Players, Habits, and Concerns

    The United Kingdom boasts a vibrant video game scene, but potential issues deserve attention:

    1. A Nation of Gamers: A sizeable portion of the UK population enjoys video games. In 2020, an estimated 36 million Britons, or nearly half the population (50%), played regularly (source).
    2. Gaming Habits: While many enjoy a balanced approach, some gaming habits raise concerns. A study revealed that 18% of UK gamers dedicate a significant amount of time, clocking in at 6 or more hours daily (source).
    3.  Another concerning statistic shows that roughly 30% of gamers reportedly neglected basic hygiene like showering in favor of playing (source). 
    4. The most frequent gamers fall within the 13-25 and 25-34 age groups (source).
    5. Gaming Among Youth: A staggering 93% of UK children engage with video games in some way (source). While gaming can be fun and educational, parental guidance is crucial for fostering healthy gaming habits.
    6. Popular Games in the UK: Games like FIFA, Fortnite, World of Warcraft, and Call of Duty appear to be top contenders for UK gamers’ attention (source).
    7. The Pandemic’s Impact: Reports suggest a troubling trend: the number of gamers struggling with addiction in the UK may have tripled due to the pandemic (source).
    8. Potential Scope of Addiction: With 36 million regular gamers, estimates suggest that between 700,000 and 1 million UK gamers might be grappling with video game addiction (source).

    Warning Signs Beyond the Screen:

    • Unplugging Blues: Feeling sad, anxious, or irritable when you can’t play.
    • The Craving Grows: Needing to spend increasingly more time gaming to feel satisfied.
    • Quitting Feels Impossible: Struggling to cut back on gaming despite wanting to.
    • Game Over for Other Hobbies: Losing interest in activities you used to enjoy due to gaming.
    • Trouble Doesn’t Stop the Play: Continuing to game even when it causes problems in your life.
    • Living a Lie: Lying about how much time you spend playing games.
    • Escape Through Gaming: Using games to cope with negative emotions like guilt or hopelessness.
    • Real-Life Fallout: Putting your job, relationships, or other important aspects of life at risk due to gaming.

    The Future of Fun (Video Game Addiction Statistics): Emerging Trends in Video Games

    The video game industry is constantly evolving, and exciting trends are shaping the future of play:

    • Get Ready to Gear Up: Virtual Reality (VR) and Augmented Reality (AR) are poised to become more mainstream, offering immersive gaming experiences that blur the lines between the real and virtual worlds (source).
    • Cloud Power: Cloud gaming services are on the rise, allowing players to access high-end games without expensive hardware. This could make gaming more accessible to a wider audience (source).
    • The Rise of Esports: Esports, competitive video gaming, is gaining massive popularity. Expect to see more professional leagues, tournaments, and spectator engagement (source).
    • Mobile Mania: The mobile gaming market continues to boom, with smartphones and tablets becoming powerful platforms for innovative and engaging games (source).
    • Subscription Services: Subscription services offering access to a library of games for a monthly fee are becoming increasingly popular, similar to models used for movies and music (source).
      These are just some of the exciting trends shaping the future of video games. Stay tuned for a world of immersive, accessible, and competitive gaming experiences!

    Power On the Past: The Rise of Retro Gaming

    The world of video games is obsessed with the future, but there’s a growing trend looking back: retro gaming!

    • Old is Gold: People are rediscovering the joys of classic video games. This isn’t just a niche hobby anymore; retro gaming has become increasingly popular in recent years.
    • Remakes for a New Age: Fueling this trend is the wave of remakes by gaming companies. These aren’t just simple rehashes; they’re thoughtful blends of nostalgia and modern technology.
    • Beyond Nostalgia: These remakes offer more than just a trip down memory lane. Developers skillfully combine beloved narratives with contemporary gameplay mechanics and stunning graphics. This allows a whole new generation of gamers to experience classic stories freshly and excitingly.
    • Enduring Entertainment: The popularity of retro gaming highlights a timeless truth: great gameplay mechanics, just like classic music and movies, can hold their own across generations.

    Level Up with AI (Video Game Addiction Statistics): How Generative AI is Reshaping Gaming

    The world of video games is getting a boost from artificial intelligence, with a specific type called generative AI making a big impact:

    • Game Development on Fast Forward: Generative AI is becoming a game-changer for developers. This technology can create code, art, dialogue, and more, significantly speeding up game production. This translates to richer, more immersive game worlds for players to explore.
    • The Future of Game Development: Experts predict that generative AI will play a major role in over half of video game development within the next 5-10 years.
    • AI-Powered Personalization: Imagine a game that adapts to your playstyle! Generative AI can analyze player behavior and in-game data to predict actions and adjust game elements on the fly. This could create a truly personalized and dynamic gaming experience.

    Blurring the Lines (Video Game Addiction Statistics): The Rise of VR and AR Gaming

    The future of gaming is getting real, or rather, unreal…and augmented! Here’s a breakdown of two exciting trends:

    • VR: Stepping into the Game: Virtual Reality (VR) offers a complete immersion experience. Players wear headsets that transport them entirely into virtual worlds, creating a truly unforgettable gaming experience. However, VR typically requires dedicated equipment and a designated play space.
    • AR: Bringing the Game to You: Augmented Reality (AR) takes a different approach. Instead of shutting you off from the real world, AR overlays digital elements onto your physical surroundings using your smartphone or other device. Imagine battling aliens while walking down the street or solving puzzles in your living room! AR allows for more flexible play and interaction with the real world.
    • The Future of Play: Both VR and AR offer exciting possibilities for immersive experiences, deeper user engagement, and innovative new game concepts. As these technologies continue to develop, the future of gaming promises to be mind-blowing!

    Breaking Barriers (Video Game Addiction Statistics): The Push for Diversity in Games

    The gaming world is becoming more inclusive, with a growing focus on diversity:

    • A World of Players, a World of Characters: This trend aims to create video games that better reflect the real world’s rich tapestry of people. This means promoting characters and storylines that celebrate gender, racial, and ethnic diversity.
    • Progress, but Room to Grow: While the industry has made strides toward inclusivity, there’s still a significant journey ahead.
    • Building a More Representative Industry: To achieve genuine diversity in games, a two-pronged approach is crucial. The gaming industry itself needs to be more inclusive and diverse in terms of its workforce and the content it creates. This will foster a richer gaming experience for everyone.

    All You Can Play: The Rise of Subscription Gaming

    The way we access games is evolving, and subscription services are taking center stage:

    • Game Libraries at Your Fingertips: Subscription gaming offers a library of games accessible for a monthly fee, similar to models used for music and movies. This growing trend is transforming the industry, with the global market expected to reach a staggering $10.92 billion by 2024 (source).
    • Play on Your Terms: This model provides flexibility and convenience. Subscribers can access games on a variety of devices, including smartphones, PCs, tablets, and consoles. This allows users to stream or download games, depending on their preference and internet connection.

    On-the-Go Entertainment (Video Game Addiction Statistics): The Mobile Gaming Boom

    Mobile gaming is a force to be reckoned with, and it’s not slowing down:

    • A Pocket-Sized Powerhouse: The mobile gaming industry is experiencing explosive growth. This trend gained further momentum during the pandemic, with people seeking entertainment at home.
    • More Players, Fewer Payers: While the player base is expanding, the number of people spending money on mobile games has dipped.
    • Monetization Innovation: This shift in spending habits is pushing developers to get creative. The industry is seeing a rise in innovative monetization strategies to keep mobile gaming sustainable. This means developers need to adapt to changing market dynamics and constantly push the boundaries of innovation to keep players engaged.

    Ever-Evolving Entertainment (Video Game Addiction Statistics): Fresh Genres and Returning Favorites

    The world of video games thrives on constant reinvention. Here’s a glimpse into what’s hot:

    • Fresh Concepts Take Center Stage: New game genres are flourishing every year, while some forgotten favorites are experiencing a resurgence. Extraction games, realistic shooters, and arcade-style racing games are capturing the attention of gamers worldwide.
    • 2024’s Hottest Hits: Keep an eye out for these genres predicted to dominate in 2024: extraction shooters, post-disco-era RPGs (role-playing games), and cooperative horror games.
    • Catering to Niche Audiences: Developers are also exploring genres with dedicated followings, such as roguelike deck builders. These niche genres target players who enjoy a deep dive into a specific style of gameplay, often trying out multiple titles within the genre.

    Why Do Video Games Get So Engaging?

    Video games can be incredibly fun and captivating, and there’s a scientific reason why. Here’s a breakdown:

    • The Dopamine Reward System: When you play a game and experience something enjoyable, like winning a level or overcoming a challenge, your brain releases dopamine. Dopamine is a neurotransmitter associated with pleasure and reward. This dopamine rush motivates you to keep playing, as your brain craves more of that positive feeling.
    • Similar to Other Enjoyable Activities: This dopamine response isn’t unique to video games. You experience it when you eat your favorite food, listen to music you love, or achieve a goal.
    • Hyperarousal and the Gaming Connection: Studies suggest that video games can trigger a state of hyperarousal, a heightened state of excitement. When this happens during gameplay, your brain might associate the game itself with dopamine release, making you want to return to the game to experience that feeling again.

    Video Game Addiction Help

    Struggling with Video Game Addiction? Here’s Help!

    Video game addiction statistics

    If you or someone you know is battling video game addiction, you’re not alone. Here we have resources to support your journey:

    • Weekly Articles: Gain valuable insights and practical strategies through our library of informative articles about video game addiction (source).
    • Respawn Gamers Program: Explore our comprehensive program designed to help gamers overcome addiction and reclaim control (source).
    • Reclaim Family Program: Foster healthier family dynamics by learning how to address gaming conflicts within the household (source).
    • Supportive Community: Connect with others who understand your challenges. Join our forum and find a safe space to share your experiences and receive encouragement (source).
    • Therapist Directory: Locate a qualified video game addiction therapist in your area for personalized guidance and support (source).

    Video Game Addiction: FAQs Answered

    Concerned about video game addiction? Here are answers to some frequently asked questions:

    1. Why Are Video Games So Engaging?

    Video games tap into our brain’s reward system. Gameplay can trigger the release of dopamine, a neurotransmitter associated with pleasure and motivation. This “dopamine rush” makes us want to keep playing to experience that positive feeling again. Similar to enjoying music or delicious food, games can be inherently rewarding.

    2. What Factors Contribute to Video Game Addiction?

    Several factors can influence addiction, including:

    • Game Design: Many games are meticulously crafted to keep players hooked. Features like rewards, progression systems, and cliffhangers encourage continued engagement.
    • Dopamine Release: As mentioned earlier, the dopamine response plays a key role. The brain starts associating gameplay with pleasure, driving the urge to play more.
    • Escape Mechanism: For some, video games might serve as an escape from stress or difficult emotions.

    3. Helping a Child Overcome Video Game Addiction:

    If you suspect your child struggles with video game addiction, here are some steps to consider:

    • Educate Yourself: Learn about video game addiction and its signs.
    • Set Limits: Work with your child to establish clear boundaries around screen time and gaming habits.
    • Consequences and Consistency: Enforce consequences for exceeding limits, and be consistent in your approach.
    • Create an Action Plan: Develop a plan to gradually reduce gaming time and encourage alternative activities.
    • Lead by Example: Model healthy screen habits yourself.

    4. Video Game Addiction Statistics:

    Statistics on video game addiction prevalence vary. While not everyone who plays games is addicted, it’s a concern worth addressing. Here’s some general information:

    • Engagement: A large portion of the population enjoys video games. Estimates suggest that around 16.35% of people worldwide play. In the US, 90% of teenagers reportedly play video games.
    • Not All Games Are Addictive: While some games are designed to be highly engaging, not all are inherently addictive.
    • Potential Risks: Studies suggest a possible link between video game addiction and brain changes similar to those seen in substance abuse disorders. Additionally, research indicates a potential correlation between addiction and mental health issues like depression.

    5. Seeking Help:

    If you or someone you know is struggling with video game addiction, resources are available. Consider seeking professional guidance from a therapist specializing in video game addiction.

  • 81 Top Virtual Event Statistics For Marketers & Organizers (2025)

    81 Top Virtual Event Statistics For Marketers & Organizers (2025)

    Virtual event statistics

    Here are some Virtual event Statistics to help you in 2024 and beyond :

    Data is king when it comes to innovative business choices, and the world of virtual events is no exception.

    The COVID-19 pandemic fueled a surge in virtual event platforms. In essence, virtual events let people connect and participate online instead of gathering in person.

    Feeling overwhelmed by planning a virtual event? Relax, I’ve compiled essential statistics to guide you through planning, promotion, and hosting a smash-hit event.

    But before we dive into the numbers, let’s explore the various types of virtual events.

    Unveiling the Virtual Event Landscape: A Look at Key Formats

    Let’s break down the exciting world of virtual events! Here are some of the most popular formats:

    1. Webinars: Imagine an online presentation hosted by a company or organization broadcast live to a chosen audience on their computers. That’s the magic of a webinar!
    2. Virtual Conferences:  Think of a traditional conference but without the travel! Virtual conferences allow attendees from anywhere in the world to participate in live sessions and events happening at a real-world location, all from the comfort of their computers.
    3. Internal Hybrid Events:  These events are designed to connect your company’s internal staff, including clients, partners, employees, and leadership. They combine virtual participation with a physical location.
    4. External Hybrid Events:  This format opens the doors to a broader audience beyond your company. Think conferences, summits, concerts, networking events, workshops, classes, trade shows, and product launches – all with both in-person and virtual participation options!

    Virtual Events Statistics: A Booming Industry

    The virtual event landscape is experiencing explosive growth! Here are some key statistics to chew on:

    Virtual event statistics
    1. Market on the Move (virtual event statistics): The global virtual event market is projected to surge at a staggering 21.4% compound annual growth rate (CAGR) between 2022 and 2030. (Source)
    2. Marketing Must-Have: In the realm of virtual events statistics, a whopping 74% of businesses consider virtual events a cornerstone of their overall marketing strategy. (Source)
    3. Revenue Rocket (virtual event statistics): The virtual event market was a powerhouse in 2021, exceeding $116 billion in revenue. By 2030, that number is expected to skyrocket to a mind-blowing $810.2 billion. (Source)
    4. Virtual Boom: The shift to virtual events is undeniable. In 2021, 92% of organizers embraced virtual experiences, which climbed to a staggering 98% in 2022. Additionally, 67% of companies leveraged hybrid events (combining virtual and in-person elements) to fuel brand growth. (Source)
    5. Attendee Appetites: Virtual events statistics have shown that while 43% of attendees crave more virtual conferences in 2023, the desire for in-person connection remains strong, with 48% planning on-site events. Interestingly, 41% also show interest in virtual roundtables. (Source)
    6. Virtual Here to Stay: The virtual event trend is far from fading. A whopping 94% of surveyed companies in 2022 planned to host virtual events, solidifying their place in the event landscape. (Source)
    7. Learning is King: The primary reason people flock to virtual events? To gain knowledge about companies and their products – making virtual events a powerful educational tool. (Source)
    8. Webinars Rule Small Business (virtual event statistics): In the realm of virtual events statistics, small businesses are embracing webinars with gusto. A survey revealed that a remarkable 99% of over 2,000 small businesses incorporate webinars into their marketing plans. (Source)

    Filling Those Virtual Seats (virtual event statistics): Attendance Trends

    Let’s delve into the world of virtual event attendance! Here are some compelling statistics:

    Virtual event statistics
    1. Live Webinars on Fire: In virtual events statistics, The number of people attending live webinars has skyrocketed by 66% in the past two years, highlighting their growing popularity. (Source)
    2. Last-Minute Mania:  Mark your calendars! Virtual events statistics have shown that Over 68% of registrations for virtual or hybrid events happen within a week of the event date. (Source)
    3. Pandemic Push (virtual event statistics):  The pre-pandemic world saw only 45% of people attending virtual events. Thankfully, that number has surged to a whopping 87% due to the lasting effects of COVID-19. (Source)
    4. In-Person Attendance Blues: In the realm of virtual events statistics for 46% of marketers, securing a solid turnout remains a significant hurdle for in-person events.  Virtual events seem to be offering a more reliable solution. (Source)
    5. Virtual Advantage:  Virtual events boast an average attendance of 1,356, exceeding the average of 908 attendees for traditional meetings. It looks like virtual gatherings might attract a wider audience! (Source)
    6. Measuring Success: Virtual event statistics show that nearly half (45%) of companies rely on total registration and attendance figures to gauge the success of their virtual events. (Source)
    7. Free Events Dominate: In virtual events statistics, a massive 74% of event marketers choose to offer virtual events for free, making them a cost-effective way for attendees to participate. (Source)
    8. Small Scale, Small Price Tag (virtual event statistics):  Hosting a virtual event with a cozy group of 10-100 attendees? Expect a monthly cost range of $50-$250.(Source)

    Large Scale, Larger Costs:  Jumbo events with 500-2500+ attendees come with a higher monthly price tag, ranging from $625 to $8,000.

    1. Cost per Guest:  According to virtual event statistics to 33.7% of event marketers, you can expect to spend an average of $500-$1,000 per virtual attendee. (Source)
    2. Sponsorship Revenue Streams (virtual event statistics):  Monetization opportunities exist!  The average virtual sponsorship package costs around $8,456, offering a potential revenue stream for organizers. (Source)
    3. Platform Power:  Virtual event statistics show that a whopping 87% of event planners actively seek platforms that allow virtual booth sponsorships, highlighting the value of this revenue source. (Source)
    4. Hybrid Hurdle:  Finding the right price point can be tricky! In the realm of virtual events statistics, Roughly 32% of businesses grapple with pricing as the biggest challenge for hybrid events. (Source)
    5. Event Size & Spending (virtual event statistics):  The cost varies depending on the event size. Small virtual events (under 250 attendees) range from $3,000 to $15,000, while larger events can set you back between $5,000 and $30,000.(Source)
    6. Accessibility Advantage:  Virtual events are budget-friendly for attendees!  Only 10% require a paid ticket, compared to over 25% of hybrid or in-person events. (Source)
    7. Future Investment:  The future is virtual! A significant 57.7% of businesses plan to increase their budget for online events, with another 35.4% unsure but open to the possibility. (Source)
    8. ROI Timeline: In the realm of virtual events statistics, Patience is key!  For 74% of B2B virtual event organizers, it takes six months to see a positive return on investment (ROI). (Source)
    9. COVID-19 Impact (virtual event statistics): Due to COVID-19, in 2020, there was a significant shift towards virtual events. A staggering 74.9% of event planners switched from in-person to virtual, while 47% canceled events and 39.8% postponed them.(Source)
    Virtual event statistics

    Planning & Promotion (virtual event statistics):

    1. Promotion Timeline: The average virtual event promotion time is 56 days, so plan ahead!(Source)
    2. Virtual Here to Stay: A significant 93% of event organizers are committed to incorporating virtual events into their future strategies.(Source)
    3. Spreading the Word: Email marketing reigns supreme, virtual event statistics shows that with 40% of event marketers considering it the most effective channel for virtual event promotion.(Source)
    4.  Interestingly, 59% of marketers would even cancel an in-person event to prioritize a virtual one.(Source)
    5. B2B Focus: However, for B2B marketers, their website takes the crown as the most effective marketing channel.(Source)

    Virtual Event Design:

    1. Speaker Spotlight (virtual event statistics): On average, virtual events typically feature around 20 speakers.(Source)
    2. The Virtual Pivot (virtual event statistics): A massive 93% of surveyed marketers plan to shift from in-person to virtual events in 2023, although only 30% have a concrete plan in place.(Source)
    3. Focus on Learning (virtual event statistics): The primary reason attendees join virtual events? Education! A whopping 80% participate to gain knowledge.(Source)
    4. Promotion Timeframe (virtual event statistics): While small virtual events require 3-6 weeks for successful promotion, larger events might need more prep time. A significant 65% of marketers say they need over six weeks for large-scale events.(Source)

    The Future of Virtual Events:

    1. Virtual is Here to Stay: Embracing the shift, 85.3% of event marketers believe virtual experiences are a permanent fixture in the event landscape.(Source)

    Measuring Success (virtual event statistics):

    1. Opportunities Abound: In the realm of virtual events statistics For 87% of marketers, the opportunities generated by virtual events are a key success factor.(Source)
    2. Top Benefits: Increased registrations, attendee engagement, and higher ROI are the top three benefits of virtual events, according to surveyed organizers.(Source)

    Challenges & Considerations (virtual event statistics):

    Virtual event statistics
    1. Networking Hurdle: Creating substantial networking opportunities remains challenging for virtual events; statistics show that 68.8% of event marketers acknowledge it as an obstacle. (Source)
    2. Success Factors: Closed deals (71%). (Source
    3.  Virtual events statistics show that attendee satisfaction is (85%). (Source
    4. and replicating event formats virtually (43%) are all considered success factors by event organizers and marketers. (Source)
    5. Finding Speakers: Fortunately, 39.5% of event organizers consider it easy to find great speakers for virtual events. (Source)
    6. Logistics & Focus: While 52.5% of event marketers find logistics challenging. (Source
    7. A positive note is that 91% of surveyed companies report their virtual event was successful. (Source
    8. Additionally, 54% of event planners prioritize attendee experience over logistics. (Source)
    9. Technical Glitches: Technical problems can occur, with 38% of marketers facing them. Investing in good microphones is crucial. (Source
    10. 70% of event planners consider them critical to a successful virtual event. (Source)
    11. The Hybrid Advantage: While virtual is prominent, 67% of businesses find hybrid events more beneficial. (Source)
    12. Engagement Challenge:  Keeping attendees engaged remains a hurdle, with 67.7% of event marketers finding it difficult. (Source)

    Virtual Events: Keeping Your Audience Captivated

    Here’s how virtual events are winning over audiences and driving engagement:

    Virtual event statistics
    1. Target Audience Outreach (virtual event statistics): In the realm of virtual events statistics, 45.3% of surveyed business marketers leverage online events to connect with their target audience. (Source)
    2. Mobile Engagement Matters (virtual event statistics):  Mobile apps are game-changers!  62% of event marketers say they boost audience engagement in virtual events. (Source)
    3. High Satisfaction Rates (virtual event statistics):  The good news?  73% of virtual event attendees walk away satisfied with their experience. (Source)
    4. Engagement Strategies (virtual event statistics): Polling is a widespread technique, with 71% of marketers using it to keep audiences interactive. (Source)
    5. Benefits for Attendees (virtual event statistics):  What makes virtual events popular?  Here’s what attendees say: According to 67%, the top perk is the ease of attendance. (Source
    6. For 49%, virtual events offer a low-cost way to participate. (Source
    7. Reduced pressure to be physically present benefits 36% of attendees. (Source)
    8. In-Person Preference (virtual event statistics): In a head-to-head battle, in-person events win for B2B marketers! Over 57% prefer the in-person experience at hybrid events, compared to 33% who favor the virtual option. The remaining 10% are undecided. (Source)
    9. Webinar Reigns Supreme (virtual event statistics): When it comes to virtual event formats, webinars take the crown! Over half (51%) of surveyed virtual event visitors prefer them, while live meeting software follows closely behind at 43%. (Source)
    10. Zooming Ahead (virtual event statistics):  Zoom is the preferred virtual event platform for companies that host them.  A significant 50.3% choose Zoom, followed by Microsoft Teams at 12% and Facebook Live at 9.4%. (Source)

    The Challenge of Virtual Fatigue (Virtual Event Statistics): Keeping Audiences Engaged

    Virtual events have become a mainstay, but there’s a potential downside: fatigue. Here’s how it can impact attendees and organizers:

    1. Audience Attention Span:  A red flag for B2B marketers! Virtual event statistics show that Half of surveyed B2B tech marketers and influencers report a significant level of virtual event fatigue among customers, with another 40% experiencing some fatigue. (Source)
    2. Zoom Fatigue is Real:  For virtual event attendees, Zoom fatigue is the biggest challenge, impacting 54% of them. This highlights the need for engaging formats. (Source)
    3. Combating Fatigue:  Experts recommend keeping virtual events concise, with an ideal length of 3-5 hours, to minimize fatigue. (Source)
    4. Organizer Challenges:  Virtual fatigue isn’t just an attendee issue.  Nearly 38% of surveyed companies identify it as a significant challenge when running virtual events, likely due to participants experiencing it from attending too many similar events. (Source)

    The Rise of Hybrid Events: Blending the Best of Both Worlds (virtual event statistics)

    Hybrid events are emerging as a popular choice, combining the virtual and in-person experiences. Let’s delve into the trends and challenges surrounding them:

    1. Hybrid’s Growing Popularity:  While virtual events remain prominent, hybrid events are gaining traction.  Among marketers planning virtual events in 2023, 18% will incorporate a hybrid format. (Source)
    2. High Demand:  The future looks bright for hybrid events!  An overwhelming 97% of respondents anticipate seeing more of them. (Source)
    3.   In fact, over 90% of companies believe large-scale events will be virtual or hybrid in 2023.(Source)
    4. B2B Preference: However, B2B marketers seem to favor the in-person aspect of hybrid events.  Over half (57%) prefer the in-person experience. (Source)
    5. Challenges to Overcome:  Creating a seamless experience across virtual and in-person elements presents the biggest hurdle for hybrid events.  Nearly half (49%) of B2B marketers cite this as their primary obstacle. (Source)
    6.   Managing hybrid logistics (42%) and convincing attendees to attend in person (36%) are also significant challenges. (Source)
    7. Driving Innovation & Connection:  C-suite executives see the value of hybrid experiences. 43% of critical countries invest in hybrid events to offer more innovative and personalized experiences, while 40% emphasize fostering a stronger connection with their audience. (Source)
    8. The Virtual Shift: The pandemic accelerated the virtual trend.  According to a 2021 survey of over 8,000 marketers, 40% of events were predicted to be virtual in 2022, with in-person and hybrid events each capturing 35%. (Source)
    9. The Long-Form Boom: Get ready for long videos! Webinars, live events, and similar long-form video content have witnessed a staggering surge of over 11,000% growth in the past decade, making them the fastest-growing video segment. (source)
    10. Emphasizing the Trend: B2B marketers are placing a growing emphasis on content marketing, with 71% indicating its increased importance to their organizations in the last year. (source)
    11. Emphasizing the Widespread Use: In 2021, the power of visuals became undeniable. More than half of marketers used them in 91% of their content pieces. (source)
    12. Highlighting Originality: When it comes to visuals, marketers are getting creative! A Venngage survey reveals that original graphics reign supreme, used by 36% of marketers, followed closely by stock photos at nearly 34%. (source
    13. Highlighting Blog Focus: Blogs are a top destination for visual content! A study reveals that 30% of marketers prioritize creating visuals specifically for blogs, followed by social media platforms like Facebook and LinkedIn. (source)
    14. Focusing on the WHO Statistic: The World Health Organization estimates that 2.2 billion people globally have visual impairments. (source)
    15. Focusing on Widespread Use: Visual content reigns supreme in marketing strategies. A survey reveals that over 50% of marketers consider it essential. (source)
    16. Focusing on the Pain Point: Visual content creation can be challenging! According to a survey, 33% of marketers find consistently producing visual content their biggest content production challenge. (source)
    17. Highlighting Mobile Dominance: Short-form video content captivates the US! An impressive 75% of adults in the US use mobile devices to watch this type of content. (source)
    18. Focusing on Viewing Behavior: Gen Z viewers are hooked on short-form videos for discovery! A significant 59% leverage these apps to find content, leading them to watch more extended versions elsewhere. (source)
    Virtual event statistics

    The Virtual Revolution: Key Takeaways and Moving Forward (virtual event statistics)

    The data speaks for itself – virtual events are a powerful force in today’s marketing landscape. Here are some key takeaways to inform your 2024 marketing strategy:

    • Virtual Events Here to Stay: These statistics paint a clear picture: virtual events are not a passing fad. They offer a valuable and accessible way to connect with your audience.
    • Embrace the Power of Virtual: Consider incorporating virtual events into your 2024 marketing plan. The potential for engagement, education, and brand awareness is undeniable.
    • Learn & Grow: People attend virtual events to learn about your company and offerings. Use these insights to craft compelling content that resonates with your target audience.
    • Data-Driven Decisions: Let the statistics be your guide! This information provides valuable insights to help you develop a solid virtual event plan for 2024.
    • Beyond Numbers: While statistics offer a strong foundation, remember that the human element is crucial. Focus on creating engaging and interactive experiences for your virtual attendees.

    By leveraging these key takeaways and staying informed about virtual event trends, you can position your brand for success in the ever-evolving marketing landscape.

  • 100+ Sales Funnel Statistics In 2025

    100+ Sales Funnel Statistics In 2025

    Here are some sales funnel statistics to help you in 2024 and beyond;

    Optimizing Your Sales Funnel for Success

    I’ve poured my heart and soul into marketing and sales, but seeing efforts go to waste can be disheartening.  That’s why I became laser-focused on improving sales funnel conversion rates.  My goal?  To achieve the best results possible, for both myself and my clients.

    Through extensive research, I’ve compiled valuable data on sales funnel statistics and insights from successful marketers and sales funnel experts.  This information is designed to be a two-fold resource:

    • Identify Gaps and Opportunities In Sales Funnel:  These statistics will help you pinpoint areas for improvement within your existing sales funnel strategy.
    • Visualize the Customer Journey In Line with Sales Funnel:  Gain a clear understanding of the customer journey, from initial awareness to conversion.  This will empower you to effectively guide prospects through your value ladder.

    The following sales funnel statistics represent the latest trends and insights in sales funnels.  By leveraging this data, you can make informed decisions, optimize your marketing and sales strategies, boost conversion rates, and gain a competitive edge in your market.

    Sales funnel statistics

    The Sales Funnel: Your Guide to Customer Conversion

    Imagine a path leading potential customers from simple brand awareness to becoming loyal fans. That’s the essence of a sales funnel! It visually represents the stages a customer goes through on their journey with your company, ultimately leading to a purchase.

    Here’s a breakdown of stages in sales funnel:

    • Awareness In Sales Funnel: This is where potential customers first encounter your brand. They might see an ad, read a blog post, or hear about you from a friend.
    • Interest In Sales Funnel: Now they’re intrigued! They’re actively seeking more information about your product or service and how it can benefit them.
    • Desire In Sales Funnel: The spark has ignited! They understand your value and consider your product as a solution to their needs.
    • Action In Sales Funnel: This is the moment of truth! The customer is ready to commit and makes a purchase.
    • Loyalty In Sales Funnel: It doesn’t end there! By exceeding expectations and fostering a positive relationship, you can turn satisfied customers into loyal brand advocates who recommend you to others.

    The goal of your sales funnel is to guide potential customers smoothly through each stage, ultimately influencing their decision to buy and become loyal brand supporters. Companies use sales funnels to gain valuable insights into customer behavior, allowing them to tailor their marketing and sales efforts for maximum conversions and a thriving customer base.

    Boost Your Conversions: Essential Sales Funnel Statistics

    Looking to optimize your sales funnel and turn more leads into customers? Here are some eye-opening statistics to keep in mind:

    1. Conversion Rate Benchmark In Sales Funnel:  The average sales funnel conversion rate is between 3% and 7% (source).  This highlights the importance of optimizing your funnel to maximize the number of leads who convert into paying customers.
    2. Speed is Key In Sales Funnel:  Landing pages and funnels with lightning-fast loading times (0-3 seconds) see the highest conversion rates (source).  Every second counts when capturing customer attention, so prioritize page speed optimization.
    Sales funnel statistics

    By understanding these key benchmarks in sales funnel statistics and focusing on factors like loading speed, you can start optimizing your sales funnel for superior conversion rates and a thriving business.

    Sales funnel statistics
    1. Don’t expect an immediate sale from every visitor! Sales funnel statistics show that While 96% may not purchase on their first visit, they could be convinced to share their details for valuable content. (source)
    2. Speed is king in e-commerce! In sales funnel statistics, shoppers on a site that zips along in 1 second are 2.5 times more likely to convert than those on a site that takes 5 seconds to load. (source)

    General Conversion Rates Sales Funnel Statistics:

    1. Sales funnel statistics show that while the average landing page conversion rate hovers around 2.35%, the top performers are converting at over 5.3%. There’s room for significant improvement! (source)
    2. Sales funnel statistics show that the best landing pages are in a league of their own, boasting conversion rates exceeding 11.45%. (source)

    Conversion Rates by Device Sales Funnel Statistics:

    1. Sales funnel statistics show that desktops lag behind with an average conversion rate of 1.9%, but if you’re hitting 4.7% or higher, you’re in the top 20%. Reaching 7.2% puts you in the elite 10%. (source)
    2. Sales funnel statistics show that mobile takes the lead in e-commerce traffic (68%), but the conversion rate sits at just 2%. (source)

    Conversion Rates by Source Sales Funnel Statistics:

    Sales funnel statistics
    1. Sales funnel statistics show that paid search traffic boasts the highest average conversion rate (2.9%) among traffic sources. (source)
    2.  Sales funnel statistics show that Facebook ads are conversion powerhouses, averaging 9.21%. However, this varies significantly by industry (retail: 3.26%, fitness: 14.29%). Focus on your specific niche for better benchmarks. (source)

    Boosting Conversion Rates Sales Funnel Statistics:

    1. Sales funnel statistics show that a strong middle-of-the-funnel (MoFu) strategy can skyrocket your response rates by 4-10 times! (source)
    2. Sales funnel statistics show the e-commerce industry is experiencing a growth spurt, with the average conversion rate reaching 3.65% (as of late 2022). (source)

    Industry-Specific Conversion Rate Sales Funnel Statistics:

    1.  Sales funnel statistics show that the “Catering and Restaurants” industry reigns supreme with the highest average conversion rate (a whopping 9.8%) across all sales funnels. (source)
    2. Sales funnel statistics show that conversion rates are a pain point for many businesses. Just a fifth (22%) report satisfaction with their current rates. (source)

    Marketing Strategy and Conversion Focus Sales Funnel Statistics:

    1.  Sales funnel statistics show that belief isn’t everything! While 71% of marketers have faith in their strategy (source)
    2.  only 69% prioritize converting leads into paying customers. (source)

    B2B Conversion Rates by Industry Sales Funnel Statistics:

    1. Not all B2B industries are created equal. Professional/financial services shine with a 10% conversion rate (source)
    2. while nonprofits struggle at just 2%. (source)

    Shopping Cart Abandonment Sales Funnel Statistics:

    1. Watch out for hidden costs! Sales funnel statistics show that nearly half (48%) of online shoppers in the US ditch their carts at checkout due to unexpected fees like shipping and taxes. (source)
    2.  Sales funnel statistics show that landing and sales pages featuring video content can see conversion rates skyrocket by up to 86%. (source)

    Product Page Expectations Sales Funnel Statistics:

    1. Sales funnel statistics show that young adults (18-24) and millennials (35-44) expect a rich product experience. They crave 8 images and 4-5 videos to get a full picture of what they’re buying. (source)

    Social Proof Power Sales Funnel Statistics:

    1. Don’t underestimate the power of social proof! Sales funnel statistics show that landing pages with testimonials and trust signals convert 1.1% higher (12.5% vs 11.4%). It might seem like a small jump, but it can significantly impact sales. (source)

    Top Landing Page Features Sales Funnel Statistics:

    Sales funnel statistics
    1. Top landing pages are all about trust and clarity. Sales funnel statistics show that a whopping 36% use testimonials, 30% leverage video content, and 78% feature their location in the title tag. (source)

    The Power of Headlines Sales Funnel Statistics:

    1. Your headline is prime real estate! Sales funnel statistics show that an eye-catching headline grabs attention, with 90% of visitors reading it and your CTA. (source)

    Focus on Your Headline (Sales Funnel statistics):

    1. Content is king, but headlines rule! Sales funnel statistics show that while only 20% of visitors will delve into your content, nearly everyone (90%) reads the headline. Make it count! (source)

    Keep Your CTA Clear (Sales Funnel Statistics):

    1. Less is more! Sales funnel statistics show that landing pages with a single, clear call to action (CTA) outperform those with multiple CTAs by 1.6%. A focused CTA converts at 13.5% compared to 11.9% for pages with distractions. (source)

    Simplify Your Offer In Sales Funnel:

    1. Avoid confusing visitors with too many choices! Sales funnel statistics show that landing pages with a single offer convert up to 266% better than those bombarding visitors with multiple options. (source)

    Keep Forms Short ( Sales Funnel Statistics):

    1. Short and sweet forms win! Sales funnel statistics show that asking for just 3 pieces of information can increase your conversion rate by 10%. (source)

    Create More Landing Pages ( Sales Funnel Statistics) :

    1. More landing pages, more leads! Sales funnel statistics show that Companies with over 30 landing pages see 7 times more leads than those with less than 10. (source)
    2.  Sales funnel statistics show that the lead generation advantage gets even bigger with 40+ landing pages (12 times more leads than those with less than 5). (source)

    Embrace A/B Testing (Sales Funnel Statistics):

    Sales funnel statistics
    1. Testing is your friend! Sales funnel statistics show that a whopping 60% of businesses find A/B split testing highly valuable for optimizing conversions. (source)

    Optimize with Testing and Targeting ( Sales Funnel Statistics):

    1. Don’t underestimate the power of good testing and targeting! Sales funnel statistics show it can significantly boost conversions by up to 300%. (source)

    Sales Funnel Testing Gap ( Sales Funnel Statistics):

    1. The testing gap in sales funnels! Sales funnel statistics show that Over 20% of businesses using them lack a reliable testing method to measure and improve their effectiveness. (source)

    The User Attention Challenge ( Sales Funnel Statistics):

    1. The clock is ticking! Sales funnel statistics show that the average internet user only dedicates 37 seconds to reading an article. Capture their attention and drive action in that short window. (source)

    B2B Landing Page Power ( Sales Funnel Statistics):

    1. B2B loves landing pages! Sales funnel statistics show that 68% of B2B businesses surveyed leverage strategic landing pages to generate and nurture leads. (source)

    Focus on Retention ( Sales Funnel Statistics):

    1. Retention is king! Sales funnel statistics show that It’s 5 times more expensive to acquire a new customer than retain an existing one. Boosting customer retention by just 5% can increase profits by over 25%. (source)

    General Business Sales Funnel Statistics

    Widespread Use of Sales Funnels ( Statistics):

    1. Sales funnels are a popular tool for websites! Sales funnel statistics show that a recent study found over 570,000 websites (out of 673 million analyzed) leverage sales funnel-building software. (source)

    ClickFunnels Reigns Supreme ( Sales Funnel Statistics):

    1. When it comes to sales funnel builders, ClickFunnels dominates the market with a whopping 55.8% share. That translates to roughly 320,000 websites using ClickFunnels out of the total 570,000 employing sales funnel software. (source)

    The Measurement Gap in Sales Funnels ( Sales Funnel Statistics):

    1. Many businesses are missing out on valuable insights! Sales funnel statistics show that a surprising 68% haven’t implemented a system to measure their sales funnel performance. Regular tracking of sales funnel metrics is crucial for identifying areas for improvement. (source)

    Streamline Your Buying Process for More Sales (Sales Funnel Statistics):

    1. Make it easy for customers to buy! Sales funnel statistics show that businesses offering a smooth buying experience are 62% more likely to close high-quality sales. (source)

    Conversion Rate Optimization Matters ( Sales Funnel Statistics):

    1. Sales funnel statistics show that Top-performing businesses prioritize conversion rate optimization (CRO). In fact, they dedicate at least 5% of their budget to CRO efforts. (source)

    Focus on Existing Customers for Profit Growth (Sales Funnel Statistics):

    1. Upselling is your friend! Sales funnel statistics show that It’s 68% cheaper to upsell existing customers than acquire new ones. (source)

    Upselling Boosts Revenue (Sales Funnel Statistics):

    1. Sales funnel statistics show that Upselling products or services are a proven revenue booster, generating an average increase of 10% to 30%. Interestingly, upsells can account for a significant portion of a company’s revenue, with some reporting up to 95% coming from upselling. (source)

    The Long Road to Conversion (Sales Funnel Statistics):

    1. Not all leads are created equal! Brace yourself – Sales funnel statistics show that a whopping 79% of your leads won’t convert into immediate sales. (source)

    Lead Readiness (Sales Funnel Statistics): A Marathon, Not a Sprint:

    1. Be patient with your leads – 73% aren’t quite ready to buy just yet. They require nurturing before converting. (source)

    Lead Conversion Timelines (Sales Funnel Statistics):

    1. Don’t give up on leads too quickly! Sales funnel statistics show that 63% won’t convert for at least 3 months; surprisingly, 20% take a year or more to become paying customers. (source)

    The Follow-Up Gap (Sales Funnel Statistics):

    1. Follow-up is key! Shockingly, Sales funnel statistics show that only 20% of sales leads are followed up. The remaining 80% are likely lost due to neglect. (source)

    Nurturing Leads Pays Off (Sales Funnel Statistics):

    1. Invest in lead nurturing! Sales funnel statistics show that Businesses that nurture leads see a significant benefit – 50% more sales at 33% lower costs. (source)

    The Power of Lead Nurturing Emails (Sales Funnel Statistics):

    1. Emails are powerful tools for lead nurturing. Sales funnel statistics show that Lead nurturing emails boast an impressive average click-through rate (CTR) of 8%, compared to just 3% for standard emails. (source)

    Personalization is King (Sales Funnel Statistics):

    1. Personalize your outreach! Sales funnel statistics show that Personalized emails enjoy an average open rate of 18.8% and a click rate of 2.1%, significantly outperforming generic emails. (source)

    More Landing Pages, More Leads (Sales Funnel Statistics):

    Sales funnel statistics
    1. Expand your landing pages! Sales funnel statistics show that Websites with 10-15 landing pages generate up to 55% more leads. (source)
    2. Generating leads in the sales funnel keeps marketers up at night! Sales funnel statistics show that Over half (61%) say it’s their primary obstacle. (source)
    3. Lead gen gets the green light in the sales funnel! A significant portion of marketing budgets go towards lead generation. Sales funnel statistics show that Over half (53%) of marketers dedicate at least half their budget to this crucial activity. Only 34% allocate a smaller portion. (source)
    4. Surprisingly, most marketers (0%) believe automation generates more leads. But the data tells a different story! Sales funnel statistics show that Businesses that leverage marketing automation tools see a significant boost in leads (up to 451% for some!), with 80% reporting an increase. Additionally, 77% experience higher conversion rates. (source)
    5. Don’t underestimate email! Sales funnel statistics show that It’s still the go-to content distribution channel for most marketers, with a dominant 93% relying on it. (source)

    Email Crushes Social Media for Acquisition (Sales Funnel Statistics):

    1. Social media might be trendy, but email is the king of customer acquisition in the sales funnel! Sales funnel statistics show that Email marketing is a whopping 40 times more effective than social media for bringing in new customers. (source)

    Email Delivers ROI Like No Other In The Sales Funnel:

    1. Get the most bang for your buck with email! Sales funnel statistics show that Email marketing boasts a sky-high return on investment (ROI) – for every dollar invested, you can expect a whopping $42 back (a 4400% ROI!), outperforming any other lead generation or marketing tool (source)

    Businesses Love Email for Lead Gen (Sales Funnel Statistics):

    Sales funnel statistics
    1. Email is a lead gen powerhouse! Sales funnel statistics show that 42% of businesses consider email one of their most critical channels for generating leads. (source)

    Focus on Conversion with Email (Sales Funnel Statistics):

    1. Turn those leads into customers! Sales funnel statistics show that 69% of marketers agree that converting leads into paying customers should be their top priority. Email marketing excels at this task. (source)

    Qualify Your Leads with Email In The Sales Funnel:

    1. Not all leads are created equal in the sales funnel! Statistics show that at least half (50%) of your prospects may not be a good fit for your products or services. Targeted email campaigns can help you qualify leads and focus on those most likely to convert. (source)

    Budget Constraints? Email Saves the Day! (Sales Funnel Statistics)

    1. Stretch your marketing budget with email! Budget constraints are the top deal-breaker for many businesses in the sales funnel. A whopping 55% of respondents in a survey cited budget limitations as the number one or two reasons deals fall apart. The cost-effectiveness of email marketing makes it a powerful tool for businesses facing budget limitations. (source)

    The Phone Still Rings True for Sales In The Sales Funnel:

    1. Pick up the phone! Surprisingly, over 41% of survey respondents identified phones as their most effective sales tool in sales funneling. (source)

    Low-Cost Competition (Sales Funnel Statistics): A Small Business Challenge:

    Sales funnel statistics
    1. Small businesses face the low-cost squeeze! A significant portion (31%) of small businesses surveyed named competing with lower-priced providers as their biggest sales challenge in the sales funnel. (source)
    2. Mobile users are searching for local options! “Where to buy” and “near me” mobile queries have skyrocketed by over 200% in the past two years. This shows a clear trend towards location-based buying decisions in the sales funnel. (source)
    3. Convenience is king in Sales Funnel! Nearly 60% of shoppers surveyed say a mobile-friendly shopping experience is crucial when choosing a brand or retailer. Businesses with accessible mobile apps can capture a larger share of mobile shoppers. (source)

    Mobile Research Fuels Online Purchases (Sales Funnel Statistics):

    1. Smartphones guide buying decisions! Over half (51%) of shoppers surveyed use Google on their phones to research products they plan to buy online. This highlights the importance of a strong online presence and mobile-optimized website for capturing these research-savvy customers in the sales funnel. (source)

    Reviews Rule Online Shopping In The Sales funnel Market:

    1. Reviews are king! A whopping 95% of online shoppers rely on product reviews before making a purchase. Positive reviews can significantly influence buying decisions in the sales funnel. (source)

    Personalized Recommendations Drive Sales in The Sales Funnel Market:

    1. Shoppers crave personalization! With respect to Sales Funnel, Half of US internet users appreciate receiving product recommendations tailored to their interests. Interestingly, while 45% say this is the type of content they see most often, there’s still room for improvement. (source)

    Understanding Builds Trust In The Sales Funnel Market:

    1. Recommendations based on needs resonate with customers! One in five survey respondents felt understood when brands recommended relevant products. Focusing on needs and understanding your audience in the sales funnel market builds trust and loyalty. (source)

    High-Quality Product Information is Key (Sales Funnel Statistics) :

    1.  Delving into the realm of sales funnel statistics, Shoppers prioritize product details! For 85% of consumers, high-quality product information and pictures are essential factors when choosing a retailer or brand. Invest in clear and informative product descriptions and visuals. (source)

    Repetition Builds Belief (Sales Funnel Statistics):

    1. Patience is key in sales and marketing! Delving into sales funnel statistics, Consumers typically need to hear a company’s claims 3-5 times before fully believing them. Be persistent with your messaging across different channels. (source)

    Sales Reps Still Deliver (Sales Funnel Statistics):

    Sales funnel statistics
    1. Don’t underestimate the power of sales reps in the world of sales funnel! Despite the rise of e-commerce, 53% of sales representatives still meet or exceed their sales quotas. Practical sales training and support are crucial for the sales funnel. (source)

    The Power of Unplanned Purchases (Sales Funnel Statistics):

    1.  Delving into sales funnel statistics, Targeted recommendations can trigger impulse buys! 34% of US digital product users have made unplanned purchases due to compelling product recommendations. Optimize your recommendation engine to increase sales. (source)

    The Sales Closer Club (Sales Funnel Statistics):

    1. Not all salespeople are created equal! In sales funnels, only a select group (around 20%) consistently brings in big wins, closing over 80% of sales. (source)

    Sales Tech Tools Drive Deals (Sales Funnel Statistics):

    1. Tech helps close deals in the realm of the sales funnel! A significant portion of sales reps (around 70%) find CRM tools highly valuable in closing deals. Sales engagement and sales intelligence software also come in at 69% each, highlighting the importance of technology in the sales process. (source)

    Honesty is the Best Policy (Sales Funnel Statistics):

    1. Don’t mislead potential customers! Delving into sales funnel statistics, Nearly half (48%) of surveyed buyers say they’ll walk away from deals with salespeople who provide inaccurate information. Building trust and transparency is key to closing sales. (source)

    Social Media’s Sales Influence (Sales Funnel Statistics):

    1. Social media connects for sales! Delving into the realm of sales funnel statistics, Over half (54%) of salespeople report being able to trace closed deals back to social media engagement. Leveraging social media effectively can be a powerful sales tool.(source)

    Buyers Want Solutions, Not Just Sales Pitches (Sales Funnel Statistics):

    1. Focus on solutions in the sales funnel, not just selling! A solid 62% of buyers want to hear from marketers who actively seek solutions to their problems. Tailor your outreach to address specific customer needs. Interestingly, despite the rise of digital marketing, 82% of consumers still prefer face-to-face meetings with salespeople who reach out. Don’t underestimate the power of personal interaction In the sales funnel market.(source)

    Organized Sales Pipelines Drive Growth (Sales Funnel Statistics):

    1. Get your sales pipeline in order! Delving into the realm of sales funnel statistics, Businesses with well-organized sales pipeline management experience a significant growth advantage (28% more) compared to those without. A structured pipeline helps track leads and opportunities, ultimately leading to more sales.(source)

    Pipeline Management: Room for Improvement (Sales Funnel Statistics):

    1. Pipeline management: a missed opportunity? Although crucial, a surprising 44% of business executives believe their company struggles with managing their sales pipelines effectively. Investing in pipeline management training and tools can significantly improve sales performance in the sales funnel.(source)

    Qualified Leads: The Key to Sales Success In The Sales Funnel :

    1. Sales reps crave qualified leads! Delving into the realm of sales funnel statistics,Nearly half (46.2%) identify a lack of qualified leads as the biggest hurdle to sales effectiveness. In the sales funnel, focus on lead generation and qualification to empower your sales team.(source)

    Long Sales Cycles? Not a Top Concern In The Sales Funnel:

    1. Don’t fear the long sales cycle! Interestingly, only 27% of sales reps consider long sales cycles a major barrier in the realm of sales funnel. Effective pipeline management can help navigate extended sales cycles.(source)

    Sales Process Optimization: A Top Priority In Sales Funnel:

    1. Streamline your sales process! Delving into the realm of sales funnel statistics, Almost 30% (28.3%) of sales managers believe optimizing the sales process should be a top priority for sales management. Revamping your sales process can boost efficiency and effectiveness.(source)

    Marketing and Sales Funnel Tracking is Common Practice:

    1. Sales and marketing funnel tracking is key in propagating sales funnel! A significant majority (77%) of marketing professionals say they track the performance of their marketing and sales funnels as part of their marketing analytics. Understanding your funnel performance helps identify areas for improvement and optimize lead generation and conversion. (source)

    Lead Nurturing Stats:

    Sales Reps Struggle with Prospecting In The Sales Funnel:

    1. Lost on where to begin?  Delving into the realm of sales funnel statistics, a whopping 37% of marketers struggle most with prospecting for leads. Without a steady stream of leads, building a strong sales pipeline is difficult. (source)

    Sales Funnels Drive Growth:

    1. Leaky sales funnels? Delving into the realm of sales funnel statistics, a staggering 68% of companies haven’t measured their sales funnels, and 79% of marketing leads never convert to sales. A well-defined sales funnel is crucial for converting leads into paying customers. (source)

    Focus on Lead Conversion In The Sales Funnel:

    1. Convert those leads! Surprisingly, stats of sales funnel shows that only 69% of marketers prioritize converting leads into customers. An optimized sales pipeline with effective follow-up is essential for maximizing lead conversion in the sales funnel. (source)

    Follow-Up is Key In Temporal Concerns Of The Sales Funnel:

    1. Don’t let leads go cold! Delving into the realm of sales funnel statistics, Nurtured leads make 47% larger purchases than those left unattended. Respond to inquiries promptly, provide valuable content, and stay top-of-mind to maximize sales potential.(source)

    Most Website Visitors Aren’t Ready to Buy (Yet):

    1. Patience is key in promoting the sales funnel! A significant 96% of website visitors aren’t ready to buy on their first visit. Develop a strategy to capture their information and nurture them with relevant content until they’re ready to convert.(source)

    Persistence In Sales Funnel Pays Off in Sales:

    1. Don’t give up easily! Delving into the realm of sales funnel statistics, A surprising 44% of salespeople abandon leads after just one rejection. The average sale requires 5 attempts, so persistence is crucial for success in propagating the sales funnel.(source)

    Be the First to Respond:

    1. Speed is king In The Realm Of Sales Funnel! In the race for leads, the first vendor to respond often wins the sale. Consider automation tools to ensure prompt responses and capitalize on early interest.(source)

    Digital Marketing Stats:

    The Rise of Online Research In The Temporal Concerns Of Sales Funnel:

    1. Go digital or get left behind! Delving into the secular interest of sales funnel statistics, a 2015 study showed that a staggering 89% of B2B researchers and 81% of B2C shoppers use the internet during their buying journey. A strong digital marketing presence is essential in today’s online world. (source)

    Know Your Audience:

    1. Relevance is key In development of sales funnel! A whopping 73% of consumers get frustrated with irrelevant content. Tailor your marketing messages and content to the specific needs and interests of your target audience to build trust and loyalty.(source)

    Grab Attention Quickly:

    1. Make those seconds count! Delving into the realm of sales funnel statistics, the average internet user spends only 37 seconds reading an article. Get your key message across quickly and prominently to capture attention before visitors move on.(source)

    Consistency Builds Trust In The Realm Of Sales Funnel:

    1. Repetition is key! Delving into the temporal concerns of sales funnel statistics, consumers need to hear your message multiple times before they believe it. Maintain consistent branding across all marketing channels to build trust and brand recognition.(source)

    Don’t Overdo Ads While Developing Sales Funnel:

    1. Ad blockers on the rise! Delving into the realm of sales funnel statistics, a growing number of users (142 million in 2017) employ ad blockers. While paid advertising can be valuable, don’t rely solely on it. Develop a comprehensive marketing strategy that incorporates various channels.(source)

    The Power of Video Marketing In Sales Funnel Advancement:

    1. Video is hot! Sales Funnel statistics show that a staggering 70% of B2B buyers watch videos during their purchase journey. Incorporate video content (live chats, product demos, how-to guides) into your marketing strategy to engage your audience.(source)

    SEO: A Missed Opportunity for Many Businesses:

    1. Unlock the power of SEO To Aid Sales Funnel! Despite the benefits of good search ranking, sales funnel statistics show that only 25% of businesses in a 2017 study had a basic understanding of SEO. Invest in SEO optimization to improve your website’s visibility and attract organic traffic.(source)

    Blogging for SEO and Lead Generation:

    1. Content is king! Regularly publish high-quality, informative blog posts to improve SEO and attract visitors. In the sales funnel Focus on long-form content (around 2,000 words) to establish yourself as an authority in your industry. (source)

    The Decline of Cold Calling:

    1. Pick up the phone, but strategically! Delving into the realm of sales funnel statistics,Only 2% of cold calls result in appointments. While cold calling isn’t completely dead, it needs to be a strategic part of a larger marketing effort. (source)

    Positive Language Persuades:

    1. Words matter! In the secular Interest of Sales Funnel,Top salespeople sprinkle positive words like “absolutely,” “definitely,” and “certainly” throughout their conversations. This upbeat approach fosters a more positive and persuasive interaction. Additionally, they boast a wider vocabulary, using over 4,000 words in a 10-hour window, showcasing their knowledge and expertise. (source)

    Teamwork Makes the Dream Work In Realm Of Sales Funnel:

    1. Focus on collaboration! Delving into the realm of sales funnel statistics, high-performing sales reps use “we” ten times more often than “I” and “you.” This inclusive language builds rapport and demonstrates that you’re on the same team, working towards a mutually beneficial outcome. (source)

    Brevity is Key in Voicemails:

    1. Get straight to the point! Delving into the realm of sales funnel statistics, studies show the most effective voicemails are under 15 seconds long. Avoid lengthy details about your offer. Instead, pique their interest with a concise message and a clear call to action, prompting them to return your call. (source)

    Key Sales Funnel Insights:

    • Speed is crucial in propagating the sales funnel! Fast-loading sales funnels and pages keep visitors engaged and improve conversion rates.
    • Video builds trust in the realm of the sales funnel! Incorporate video content to connect with your audience, establish trust, and drive sales.
    • Testimonials are powerful in the sales funnel! Showcase customer testimonials on landing pages and throughout your funnel to build trust and social proof.
    • Clear Calls to Action! Each page in your funnel should have a single, focused call to action to guide visitors towards the desired outcome.
    • Always Be Testing! A/B testing and conversion tracking are essential for optimizing your sales funnel for maximum effectiveness.
    • Nurturing Leads Pays Off in the sales funnel! Following up and nurturing leads with valuable content builds stronger relationships and increases sales potential.
    • Email Remains King in the realm of sales funnel! Don’t underestimate the power of email marketing. It’s a cornerstone of any successful sales funnel strategy.
    • Educate and Offer Value! Focus on providing informative content and relevant offers that address your audience’s needs.
    • Get Online! In today’s digital world, a strong online presence and a well-defined sales funnel are crucial for capturing leads and driving sales.

    Take Action and Improve Your Sales Funnel!

    While this may seem like a lot to consider, implementing these insights can significantly improve your marketing and sales efforts.  Ready to optimize your sales funnel? Let me know in the comments below!  I’m also eager to hear your thoughts on these statistics and any questions you may have.

    Stay Tuned for More!

    This page will be continuously updated with the latest and most valuable sales funnel statistics, drawing on new research and data.

    Thanks for reading!

  • 110+ Performance Management Statistics In 2025

    110+ Performance Management Statistics In 2025

    Performance Management statistics

    Here are performance management statistics to help you

    Stagnation equals decline.  Without transparent processes for assigning roles, identifying strengths, providing feedback, and recognizing achievements, an organization sets itself up for failure.

    A robust performance management system is crucial to success. This system should focus on four key areas: planning, coaching, reviewing, and rewarding.

    Building a winning system starts with setting goals and fostering appreciation. Many companies achieve this through innovative solutions, like idea-sharing platforms for software projects. These platforms empower employees to contribute and drive improvement.

    Up next, we’ll explore some data-driven insights on performance management.

    Changes made:

    • More substantial opening: Replaced “Lack of improvement” with a more impactful statement.
    • Active voice: Shifted to active voice for a more engaging tone.
    • Conciseness: Removed unnecessary phrases and redundancies.
    • More apparent structure: Highlighted the four critical areas of performance management.
    • Specific example: Replaced the generic example with a particular scenario related to software development.
    • Increased anticipation: Built anticipation for the upcoming statistics section.

    The Gap Between Belief and Action In Performance Management: Although 98% of businesses recognize the importance of performance management, only 64% have a practical system in place. This highlights the need to bridge the gap between belief and action.

    A Call for Integration In Performance Management: 70% of organizations believe performance management should be better integrated with other talent initiatives. This suggests a holistic approach that considers employee development alongside performance evaluation.

    Performance Management Statistics

    Addressing Burnout In Performance Management:  With 84% of managers acknowledging burnout as a concern, performance management can be a powerful tool for early identification and prevention.

    Time for Change In Performance Management: The fact that 81% of HR leaders are actively modifying performance management systems reflects a widespread shift toward more effective methods.

    Continuous Improvement Wins In Performance Management:  Companies with constant performance feedback outperform competitors by a significant 24%. This emphasizes the importance of ongoing feedback and development.

    Traditional Reviews Fall Short In Performance Management: Only 14% of employees find traditional reviews motivating.  It’s time to move beyond outdated methods.

    Gen Z Craves Feedback In Performance Management:  Nearly all Gen Z employees (97%) are open to feedback, preferring frequent and constructive input (63%). Cater to this preference for better engagement.

    Continuous Feedback Boosts Satisfaction In Performance Management: Companies with continuous feedback systems report 50% higher satisfaction than those using annual reviews.  The shift can be positive for both employers and employees.

    The Power of Recognition In Performance Management:  37% of employees say they’d put in more effort with increased praise.  Recognition is a powerful motivator, so integrate it into your performance management strategy.

    Overall, the message is clear:  Traditional performance management systems are falling short. By implementing continuous feedback, focusing on employee development, and integrating performance with talent strategy, organizations can unlock significant benefits for themselves and their employees.

    Crucial Performance Management Statistics

    1. Burnout Alert In Performance Management: 84% of managers agree that burnout is a serious issue, suggesting performance management can be crucial in identifying and preventing it  [source].
    Performance Management Statistics
    1. Fragmented Approach In Performance Management: Seventy percent of organizations recognize a disconnect between performance management and other talent initiatives. A more holistic approach that integrates development alongside evaluation is needed [source].
    2. Knowledge Gap In Performance Management: Only half of the workforce understands their job requirements clearly.  Performance management should focus on setting clear expectations and goals  [source].
    3. Review Delays In Performance Management:  Managerial inefficiency is evident, with 50% of employee evaluations overdue by a month or more.  Streamlined processes and clear deadlines are essential  [source].
    4. Time for Reform In Performance Management: The dismal net promoter score of -60 for performance management underscores the need for a complete overhaul of current systems  [source].
    5. Continuous Improvement Stalls In Performance Management:  Companies lacking continuous feedback systems struggle to implement year-round productivity enhancements (35%).  Regular check-ins are key  [source].
    6. Motivation Meltdown In Performance Management: Traditional performance reviews fail to inspire, with only 14% of employees finding them motivating.  A shift towards a more engaging and developmental approach is crucial  [source].

    These performance management statistics show that By addressing these critical issues In Performance Management, organizations can transform performance management from a burden into a powerful tool for employee engagement, development, and overall success.

    1. The Performance Management Paradox: Nearly all businesses (98%) acknowledge the importance of performance management, yet only two-thirds (64%) claim to have a practical system in place  [source]. This highlights a significant gap between belief and action.
    2. A Call for Integration In Performance Management:  A significant majority (70%) of companies recognize the need for a stronger connection between performance management and other talent initiatives, like development and recruitment  [source]. This suggests a siloed approach is hindering effectiveness.
    3. Beyond Reviews: The Drawbacks of Traditional Systems: Traditional performance appraisals often suffer from several limitations, including inefficiency, decreased motivation, discouragement of teamwork, inflexibility, and high cost  [source].  These factors highlight the need for a more modern approach.

    Continuous Performance Management: A Recipe for Success

    1. Companies that embrace continuous performance management see significant advantages. They report increased productivity (66%), a more motivated workforce (65%), and a more remarkable ability to achieve top organizational goals (64%)  [source]. 
    2. This aligns with the finding that 90% of business leaders believe engaged employees perform better  [source].

    Engaging Employees Through Feedback In Performance Management

    1. There are several ways to create a more engaged workforce.  Performance appraisals through management dashboards, peer review, and 360-degree feedback can all empower employees to improve and contribute to company goals  [source]. 
    2.  The data is precise: Companies adopting continuous feedback outperform competitors by 24%  [source].

    What Employees Want In Performance Management

    Performance Management Statistics
    1. Employees crave a sense of purpose and value.  82% want to be seen as individuals, not just workers  [source].  
    2. Nearly all Gen Z employees (97%) welcome feedback, and 63% prefer it to be frequent and constructive throughout the year  [source]. 
    3.  Additionally, 65% of employees desire more apparent roles and responsibilities  [source].
    4.  Interestingly, 63% report feeling like they thrive in their current roles  [source].

    The Power of Weekly Feedback In Performance Management

    1. Managers who provide weekly feedback see a dramatic difference. Their team members are 5.2 times more likely to feel they receive meaningful feedback compared to those receiving annual reviews  [source].

    Employee Engagement In Performance Management: A Win-Win

    1. Employee engagement fosters a positive work environment. It builds trust, purpose, and autonomy within the workforce, leading to a stronger sense of unity  [source]. 
    2. Engaged employees are enthusiastic about their jobs and willing to go the extra mile (36%) to contribute to the company’s success  [source].
    3.   While negative feedback can be discouraging (only 10% of U.S. workers felt engaged after receiving it) [source]
    4.  Many unengaged employees (49%) are still somewhat satisfied [source]. Addressing their needs could lead to a more motivated and productive workforce.

    In conclusion, these performance management statistics show that continuous performance management with a focus on frequent, constructive feedback is a powerful tool for boosting employee engagement and achieving organizational goals.  By prioritizing employee well-being and development, companies can unlock a competitive advantage.

    The Impact of Feedback on Employee Engagement In Performance Management

    Here’s a look at how feedback can influence employee engagement:

    1. Demoralized by Negativity: Harsh criticism can backfire. Up to 30% of workers seek new jobs after receiving negative feedback (source).
    2. Disengaged and Disruptive: Disgruntled employees can negatively impact company culture. A survey found that 15% of disengaged workers spread negativity among colleagues (source).
    3. Fueling Success: Conversely, constructive feedback is a powerful motivator. 75% of employees credit feedback from their employers with helping them succeed (source).

    These performance management statistics highlight the importance of providing feedback that is helpful and encouraging, even when addressing areas for improvement.

    The Employee-Customer Connection In Performance Management: A Win-Win Strategy

    Here’s how a focus on employees can benefit both your customers and your business:

    Performance Management Statistics '
    1. Happy Employees, Happy Customers: Customer experience is a top priority for executives (45% see it as critical) (source). 
    2. Studies show a clear link: organizations that improve employee experience also see a boost in customer loyalty (53.7%) (source). Engaged employees deliver better customer service.
    3. Addressing Burnout: Recognizing burnout is key. Many HR departments (84%) see it as a serious issue (source). This highlights the need for performance management systems that promote well-being and prevent burnout.
    4. A Time for Change: HR leaders are taking action (81% are making changes) (source) This suggests a widespread shift towards more effective performance management practices.
    5. The Power of Recognition: Employees crave appreciation. 37% say they’d work harder with more praise (source). Effective performance management should integrate recognition and positive reinforcement.
    6. Continuous Feedback is Key: Regular feedback is more valuable than annual reviews. Organizations using ongoing peer reviews see better results (29%) (source). Continuous performance management provides opportunities for continuing development and improvement.
    7. Investing in Employees Pays Off: A positive employee experience benefits everyone. 77% of businesses report positive results from focusing on employee well-being (source).

    These performance management statistics show that By creating a work environment that fosters engagement and well-being, companies can unlock a competitive advantage through a more satisfied and productive workforce.

    The Hidden Costs of Disengagement and the Power of a Positive Work Environment In Performance Management

    Here’s a look at how a lack of employee engagement can hurt your company, and the benefits of creating a more positive work environment:

    1. Fear of Reviews: 22% of employees would call in sick rather than face a performance review (source). This highlights the need for an encouraging and development-focused review process.
    2. Unclear Expectations: Nearly half the workforce (50%) doesn’t fully understand their job expectations (source). Clear communication and goal setting are crucial for employee engagement.
    3. Engagement = Success: Managers overwhelmingly recognize the importance of engagement (71% see it as critical) (source). A happy and motivated workforce is essential for organizational success.
    4. Invest in Training: Workplace training and development programs are a proven way to boost engagement and efficiency (source). Helping employees grow in their roles keeps them motivated and productive.
    5. Focus on time consumption: U.S. managers dedicate a significant amount of time, between one and two weeks, to complete a performance review for each employee. (source)
    6. The New Hire Challenge: Over 20% of new hires question their job choice due to their initial experiences (source). Onboarding and performance management software can help ensure a smooth transition and set clear expectations.
    7. The Disengagement Drain: Disengaged employees are a significant financial burden. Studies show a small percentage (less than 20%) of disengaged employees can cause significant productivity losses (source).

    The Engagement Advantage In Performance Management: The benefits of a happy workforce are undeniable. Engaged employees have:

    These performance management statistics show By prioritizing employee well-being, clear communication, and ongoing development; companies can create a work environment that fosters engagement and unlocks a significant competitive advantage.

    Performance Management Statistics
    1. 81% lower absenteeism (source)
    2. 18% higher productivity (source)
    3. 10% higher customer loyalty (source)
    4. Reduced theft (28%) (source)
    5.  and accidents (64%) (source)
    6. Higher customer satisfaction (89%) (source)
    7.  and loyalty (50%) (source)
    8. Greater retention – they’re 3 times more likely to stay (source)
    9. Focus on the impact: Unengaged employees often feel bored, leading to a high turnover rate. A staggering 33% of employees report leaving a job due to boredom (source).

    These performance management statistics show that By prioritizing employee well-being, clear communication, and ongoing development, companies can create a work environment that fosters engagement and unlocks a significant competitive advantage.

    1. Focus on the need for change: The landscape of performance management is evolving. While 63% of companies cling to annual reviews, a shift towards more frequent feedback is underway (source).

    The Disconnect Between Effort and Outcome In Performance Management:

    1. While managers spend considerable time (10%) setting up traditional review policies (source)
    2.  Both HR leaders (95%) and employees (59%) report dissatisfaction with the system (source).
    3. Traditional reviews offer minimal value, with nearly 60% of employees feeling they have “no impact” on performance (source).

    The Case for Continuous Feedback In Performance Management:

    Performance Management Statistics
    1. A shift towards continuous performance management programs leads to significant improvements (source)
    2. HR teams report 50% higher satisfaction (source).
    3. Employees receiving weekly reviews experience an 85% increase in engagement (source).
    4. Organizations attract and retain top talent 39% and 44% more effectively, respectively (source).
    5. Companies with engaged employees see a 27% increase in earnings and 38% higher productivity (source).

    This performance management statistics data suggests that continuous performance management, with its focus on frequent feedback and development, delivers a much higher return on investment than traditional annual reviews.

    The Blind Spot of Traditional Reviews In Performance Management:

    1. Despite the focus on performance, HR leaders often lack visibility into skill gaps. Nearly half (47%) are unaware of these critical shortcomings (source). 
    2. However, 60% recognize the importance of building employee skills, highlighting a disconnect between awareness and action (source).

    Why Annual Reviews Are on the Decline:

    Performance Management Statistics
    1. Traditional annual reviews are losing favor. Their usage has dropped significantly, from 82% in 2016 to 54% in 2020, and is expected to continue decreasing (source). This suggests a growing recognition of their limitations.

    Further drawbacks include:

    The Power of Frequent Check-Ins In Performance Management:

    Continuous feedback through regular check-ins offers a clear alternative:

    By moving away from annual reviews and embracing frequent check-ins, organizations can address skill gaps, improve engagement, and create a more responsive performance management system.

    1. Delays: Research shows managers hold up reviews for up to 50% of employees, taking up to 30 days past deadlines (source).
    2. Inefficiency and Inaccuracy: The time-consuming nature and complexity of traditional reviews often lead to inaccurate and unmotivating feedback (source).
    3. Lack of Preparedness: Nearly half (49%) of HR leaders feel unprepared for the evolving needs of performance management (source).
    4. Engagement Soars: Employees with weekly check-ins with their managers report significantly higher engagement (85%) (source).
    5. Disengagement Plummets: Only 2% of employees feel disengaged with this approach (source), highlighting its effectiveness in promoting positive connections.

    Beyond Ratings: A Focus on Development In Performance Management

    1. While some concerns exist about the impact of removing ratings (studies suggest a potential 4-10% decrease in performance), a focus on development can be just as practical, if not more so. (source)

    The Accountability Gap in DEI In Performance Management:

    1. While inclusivity is a recognized factor in employee performance (critical since 2021), many companies struggle to hold themselves accountable in this area.  A significant portion of HR leaders (36%) report challenges in maintaining accountability regarding DEI. (source)
    2. A 2020 study revealed a significant shift, with nearly half (46%) of organizations revamping their performance management systems in the past year (source).

    A Global Engagement Gap In Performance Management:

    Performance Management Statistics
    1. While there’s a positive uptick (23% globally in 2022), employee engagement remains low, with only 21% of international employees feeling invested in their work compared to 33% in the U.S. (source).
    2. This lack of engagement is a significant driver of turnover, with over half the global workforce actively searching for new jobs (source).
    3. Interestingly, geography matters: Southeast Asia boasts the highest engagement rate (33%), while Europe lags behind (13%) (source).

    Engagement Trump Location In Performance Management:

    1. Regarding employee stress, engagement is far more significant (nearly 4 times more impactful) than work location (source). This highlights the importance of fostering a positive work environment.

    Why They Quiet Quit:

    1. A recent Gallup poll sheds light on the reasons behind “quiet quitting” (doing the bare minimum at work). Disengagement and a lack of positive workplace culture are cited as the primary culprits (source).

    These performance management statistics paint a clear picture: fostering employee engagement is crucial for retaining talent and reducing stress, regardless of location. By creating a more positive work environment and addressing factors that contribute to disengagement, organizations can unlock the full potential of their global workforce.

    The Engagement Advantage In Performance Management:

    1. Engaged employees are not only more invested in their work, but they’re also significantly more reliable. Teams with high engagement report a staggering 81% decrease in absenteeism and a 43% reduction in turnover compared to their disengaged counterparts (source).

    The Remote Work Efficiency Boost In Performance Management:

    1. The COVID-19 pandemic experiment with remote work yielded a surprising benefit. A significant portion of the UK workforce (73%) reported feeling more efficient working from home (source).

    These performance management statistics highlight the positive impact of both employee engagement and flexible work arrangements. By fostering a more engaged workforce and embracing remote work opportunities where appropriate, companies can benefit from a more reliable and productive workforce.

    The Move Away from Annual Reviews In Performance Management: A Growing Trend

    1. According to Deloitte, some of the most proactive companies already began reviewing and updating their performance management systems prior to 2014. (source)
    2. This trend gained momentum. Approximately 33% of U.S. companies favored abandoning traditional performance appraisal and review processes as of 2016. (source)
    3. Leading companies like Microsoft, Netflix, and many others also moved away from these traditional processes before 2015. (source)
    4. The shift continues, with some, including 6% of Fortune 500 companies, eliminating employee rankings altogether. (source)

    This version uses stronger verbs and emphasizes the growing popularity of alternative approaches. It also avoids directly quoting the source within the text, opting for a smoother integration.

    1. Annual Reviews Remain Common, But Not Ideal: Despite the rise of continuous feedback models, a significant majority (71%) of companies, according to SHRM, still rely on annual performance reviews (source).
    2. Time-Consuming and Inefficient:  These traditional reviews can be a significant drain on managerial resources.  On average, managers dedicate a substantial amount of time (210 hours annually) to preparing reviews for their teams (source).
    3. Focus on Strengths for Greater Impact:  A shift in focus can yield significant benefits.  Teams that receive feedback on their strengths outperform those receiving feedback focused on weaknesses by 8.9% in profitability and 12.5% in productivity (source).

    The Power of Continuous Feedback In Performance Management: Attracting, Retaining, and Engaging Top Talent

    Here’s a look at how continuous performance feedback can benefit your organization:

    Performance Management Statistics
    1. Talent Acquisition and Retention: Companies with continuous feedback are 39% more effective at attracting and 44% better at retaining top talent (source). This translates to a significant competitive advantage in today’s job market.
    2. Meaningful Feedback, Engaged Employees:  Employees crave frequent and meaningful feedback.  Team members are five times more likely to find feedback valuable when delivered weekly (source). 
    3.  This frequent, focused approach leads to four times higher engagement compared to those who receive no feedback (source). 
    4.  A staggering 94% of employees prefer daily or real-time feedback and development opportunities (source). 
    5.  Even quarterly check-ins with managers are seen as valuable by 81% of employees (source).
    6. Reduced Turnover, Increased Recognition:  Regular feedback isn’t just about development; it’s about acknowledging accomplishment.  Companies with regular feedback see 14.9% lower turnover (source),
    7.  and 84% of engaged employees feel recognized for their efforts, compared to only 25% of disengaged workers (source).
    8. Boosting Productivity and Retention: Companies can unlock significant potential by focusing on strengths. Teams receiving feedback on strengths outperform those focused on weaknesses by 8.9% in profitability and 12.5% in productivity (source).
    9.   Furthermore, offering professional development opportunities can increase engagement by 15% and retention by 34% (source).

    In conclusion, these performance management statistics show that continuous performance feedback creates a win-win situation. Employees feel valued and engaged, leading to higher productivity and lower turnover. Companies benefit from a more motivated workforce, a competitive edge in talent acquisition, and a culture of continuous improvement.

    The Power of Peer Reviews In Performance Management: Faster Feedback, Stronger Teams

    Here’s a look at how incorporating peer reviews into your performance management system can benefit your organization:

    1. Closing the Feedback Gap:  A significant portion of companies (nearly one-third) already leverage peer reviews (source).
    2.  This helps address the employee desire for immediate feedback, with 80% of office workers preferring it over waiting for a manager (source).
    • Employee Preference and Engagement:  Peer reviews resonate with employees.  They often feel more comfortable receiving feedback from colleagues, leading to potentially higher engagement and receptiveness.
    • Building a Stronger Team Culture:  Peer reviews can foster collaboration and teamwork.  By providing constructive feedback to peers, employees can help each other grow and develop professionally.
    • Improved Performance and Consistency:  Peer reviews offer valuable insights into an employee’s day-to-day performance and contributions.  This can lead to more well-rounded performance evaluations and, ultimately, improved individual and team performance.

    These performance management statistics show that By incorporating peer reviews alongside traditional management feedback, organizations can create a more comprehensive performance management system that provides employees with the timely, constructive feedback they crave while fostering a culture of collaboration and continuous improvement.

    The Customer In Performance Management: The Driving Force Behind Success

    Here’s a look at how prioritizing customer focus can benefit your business:

    1. Customers Rule the Bottom Line:  Business leaders overwhelmingly recognize the importance of the customer. A staggering 90% of CEOs believe customers have the most significant impact on their profitability (source).
    2. Customer Feedback Shapes Strategy:  Customer insights are crucial for strategic decision-making.  Nine out of ten CEOs agree that customer feedback significantly impacts overall company strategy and goals (source).
    3. The Power of Listening:  Consumers reward companies that actively seek their input.  Nearly 80% of modern consumers favor brands that value their feedback (source).
    4. Unlocking the Voice of the Customer:  Gathering customer feedback is essential, but response rates matter. While the average survey sees a response rate of only 25%, a well-crafted survey can boost that number to over 85% (source).

    These performance Management Statistics show that By prioritizing customer focus, creating effective feedback mechanisms, and actively listening to your customers, you can gain valuable insights that will guide your business strategies, improve profitability, and attract loyal customers.

    The Engaged Employee In Performance Management: A Recipe for Success

    Here’s a look at some key challenges and opportunities facing today’s workforce:

    1. The Cost of Disengagement: Disengaged employees are a significant financial burden.  They cost the U.S. economy a staggering over $300 million annually (source).
    2. Focus, or Lack Thereof:  Nearly 40% of employees feel underappreciated by their managers, potentially leading to a lack of focus and decreased productivity (source).
    3. Productivity on the Decline:  U.S. workplace productivity has seen a downward trend, with a 2.4% decline reported in Q2 of 2022 (source).
    4. Rethinking Rewards:  Performance-based pay isn’t a one-size-fits-all solution.  A Harvard Business School study reveals that most HR professionals favor consistent salaries over commissions, although bonuses and gifts remain welcome (source). 
    5.  Currently, only 11% of the U.S. workforce receives annual bonuses, and this number varies by industry, with IT taking the lead (source). 
    6.  Profit sharing is more prevalent in larger companies (100+ employees).  Interestingly, consistent bonuses or incentives can boost employee engagement eight times (source).
    7. The Remote Work Factor:  A new challenge has emerged –  developing a fair compensation structure for a growing remote and hybrid workforce (source).  While traditional performance-based pay presents its own challenges,  accommodating a remote model adds another layer of complexity.

    These performance management statistics highlight the importance of fostering employee engagement, creating a positive work environment, and developing flexible reward systems that cater to the evolving needs of today’s workforce.

    The Rise of Remote Work In Performance Management: Benefits, Challenges, and the Future of Flexibility

    How we work is undergoing a significant transformation, with remote and hybrid models becoming increasingly popular. Here’s a breakdown of the key trends and statistics:

    The Surge in Remote Work In Performance Management:

    1. Popularity Soaring: Nearly 13% of full-time employees work from home currently, and 28% follow a hybrid model. Projections suggest over 32 million U.S. workers will be fully remote by 2025 (source).
    2. Productivity Boost:  Studies show a significant productivity increase for remote workers, with 77% reporting higher output when working offsite (source).

    Communication and Collaboration In Performance Management:

    1. Email Reigns Supreme: The vast majority (88%) of remote workers rely on email as their primary daily communication tool (source).

    Engagement and Well-being In Performance Management:

    1. Happier and Healthier:  Hybrid employees boast the highest engagement levels (81%), followed by remote (78%) and on-site workers (72%) (source).
    2. Reduced Sick Leave:  Remote workers take 52% less sick leave compared to in-office counterparts (source).
    3. Burnout is Real:  Despite the benefits, nearly 70% of remote workers experience burnout from using digital communication tools daily (source).

    Performance Management :

    1. Performance Unaffected:  The majority (79%) of remote workers report no significant impact on their performance after transitioning to a remote workspace (source).
    2. Managers Adapt:  Companies are actively addressing concerns about managing remote teams.  83% of organizations report a successful shift to remote work, with 64% explicitly focusing on training managers to oversee remote employees (source).

    Security Concerns In Performance Management:

    1. Perception vs. Reality: While 73% of executives believe remote workers pose a greater security risk, the statistics suggest otherwise (source). 
    2. 70% of organizations are actively expanding their IT infrastructure to enhance security for a remote workforce (source).

    The Future of Work In Performance Management:

    1. Technology Drives Change:  With advancements in technology, more and more jobs are becoming suitable for remote work.
    2. Flexibility Wins:  55% of employees prefer working remotely at least three days a week, highlighting a solid shift towards flexible work arrangements (source).
    3. Leadership on Board: Only 13% of executives desire a complete return to pre-pandemic office work, indicating a broader acceptance of remote and hybrid models (source).

    Challenges Remain In Performance Management:

    Despite the numerous advantages, remote work isn’t without its drawbacks.

    1. Feeling Disconnected: Over half (53%) of remote workers struggle with feeling connected to colleagues due to a lack of in-person interaction (source).
    2. Not for Everyone: Certain jobs will inherently require an on-site presence.

    The remote work landscape is rapidly evolving. While traditional in-office models persist, the statistics overwhelmingly point towards a future dominated by remote and hybrid work arrangements. As technology continues to advance and organizations adapt their management strategies, remote work is poised to become the new standard for many industries.

    Conclusion (Performance Management Statistics)

    In closing, the power of effective feedback cannot be overstated. When implemented correctly, it fosters growth and success for both employees and the organization as a whole.  For employers seeking additional support, there’s a wealth of resources available, with over 100 performance management software solutions to explore.

    Performance Management: A Cornerstone for Success

    • Goal Setting and Teamwork:  Performance management goes beyond simply evaluating employees. It empowers individuals by establishing clear goals and fostering a collaborative environment that encourages teamwork, communication, and knowledge sharing.
    • Boosting Performance and Achieving Objectives:  By implementing effective performance management practices, organizations can unlock significant potential.  This translates to enhanced overall performance and a more remarkable ability to achieve strategic objectives and fulfill the organization’s mission.
    • The Importance of Feedback:  The report emphasizes the importance of frequent, high-quality feedback as a cornerstone of improved employee performance.  By providing constructive and timely feedback, organizations can guide their employees toward continuous growth and development, ultimately leading to better business results.

    Visual Support:  The accompanying graphs and charts further illustrate the key concepts explored in the report, providing a clear and comprehensive understanding of the value proposition of effective performance management.

    Overall, this report underscores the critical role of performance management in creating a dynamic and successful organization. By fostering a culture of goal setting, teamwork, and continuous feedback, organizations can empower their employees and achieve exceptional results.