
Here are 110+ digital marketing vs traditional marketing statistics you should know in 2025 and beyond;
In today’s fast-paced, technology-driven world, how businesses approach marketing has significantly transformed.
The rise of digital marketing has cast a long shadow over traditional marketing.
While some companies cling to old methods, many marketers find themselves at a crossroads: embrace the digital revolution or hold onto the familiar?
Let’s explore key statistics comparing digital marketing vs. traditional marketing statistics to shed light on this. We’ll also analyze top advertising examples from both sides to help you decide which approach is best for your brand.
Digital marketing takes the online route, utilizing tactics like search engine optimization (SEO), social media engagement, and email marketing. It’s generally more budget-friendly and allows for precise audience targeting, offering greater measurability.
On the other hand, traditional marketing operates offline, employing methods like TV commercials, print ads, and direct mail. While effective for broad reach and brand recognition, it can be costlier and offer less data on its impact.
Digital Marketing vs Traditional Marketing statistics: Key Differences
- Cost: Forget fat wallets! Digital marketing lets you stretch your budget further with lower costs per impression and a higher return on investment (ROI).
- Targeting: Laser focus, not shotgun blasts! Digital marketing lets you target your ideal customers with pinpoint accuracy based on demographics, interests, and even online behavior.
- Measurability: No more guessing games! Digital marketing provides real-time results, so you can see exactly how your campaigns perform and make adjustments.
- Speed: Lightning fast! Launch digital marketing campaigns in a flash, unlike traditional marketing’s slow and steady approach.
- Interactivity: It’s a two-way street! Digital marketing fosters conversations and engagement with your customers, building stronger relationships.
- Scalability: Go global with a click! Digital marketing breaks down geographical barriers, letting you reach customers worldwide.
- Personalization: Speak their language! Digital marketing allows you to tailor your message and content to each customer.
- Environment: Save the trees! Digital marketing is eco-friendly, reducing the need for physical materials and waste.
General Digital Marketing Statistics (Digital Marketing VS Traditional Marketing Statistics)
- U.S. online shopping is booming: E-commerce revenue is expected to surge from $768 billion in 2021 to $1.3 trillion by 2025. (Source)
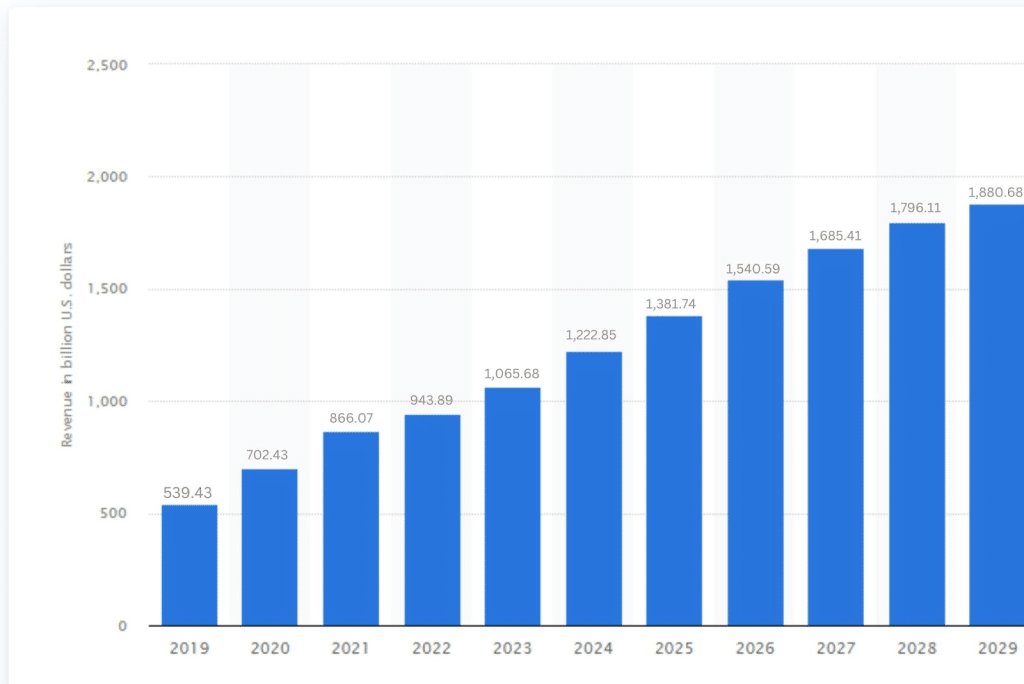
- The U.S. market is predicted to skyrocket by a staggering $657.8 billion by 2029, reaching a record high of $1.9 trillion. That’s a whopping 53.79% increase over just five years. (Source)
- The global digital marketing market is expected to reach about $786.2 billion by 2026. (Source)
- The U.S. alone is a digital marketing powerhouse, with a market value reaching a mighty $460 billion in 2022. (Source)
- The market is expected to grow by 9% annually between 2020 and 2026. (Source)
- 78% of brand marketers consider it crucial to their overall strategy. (Source)
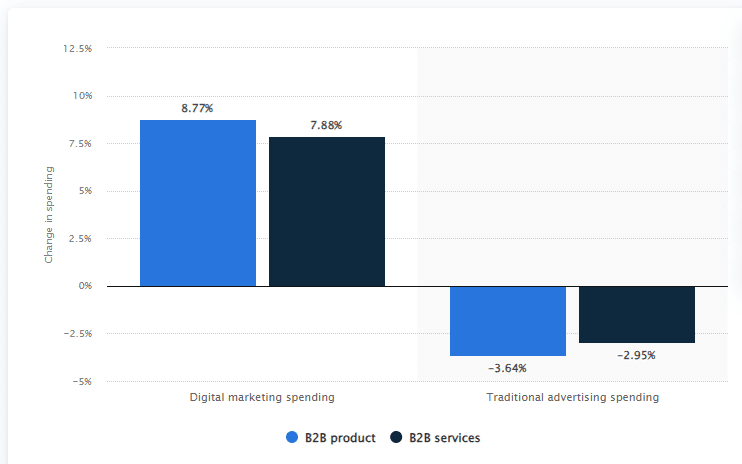
- A recent survey predicts a hefty 8.77% increase in digital marketing spending by B2B product marketers in the U.S., while traditional advertising budgets are expected to shrink by 3.64%. (Source)
- Content is king! Savvy marketers understand this. Over 70% of business marketers are actively investing in content marketing. (Source)
- Short-form video is the hot new trend. 89% of global marketers believe in the power of short-form video content and plan to keep investing in it. (Source)
- By the end of 2022, the U.S. retail e-commerce market was projected to be worth up to $986.10 billion. (Source)
- Recent research suggests over 72% of the marketing budget is now allocated to digital ad channels. (Source)
- A compelling 60% of adult listeners reported acting after hearing a podcast ad. (Source)
- In B2B marketing, the website takes center stage as the most impactful channel. (Source)
- 74% use podcasts to discover new products and services. (Source)
The Digital Canvas: Unveiling Display Advertising Stats (Digital Marketing VS Traditional Marketing Statistics)
- Programmatic buying is on the rise for digital outdoor ads. Spending jumped from $180 million in 2020 to $530 million in 2022, showcasing its growing popularity. (Source)
- The U.S. is the undisputed champion of banner ads, spending a whopping $61 billion in 2022. That translates to an average of $30.99 per internet user on banner ads. (Source)
- Across the pond, Europe’s digital display ad market is thriving. As of 2021, the UK leads the pack with a market value of €14.8 billion, followed closely by Germany at €5.6 billion. (Source)
- Digital billboards are lighting up the landscape. The U.S. market for digital outdoor advertising is projected to surge from $2.72 billion in 2020 to a cool $3.84 billion by 2023. (Source)
- The global trend is even more impressive. Be ready for a digital outdoor ad explosion – spending is expected to skyrocket from $6.7 billion in 2019 to $15.9 billion by 2027. (Source)
- Global spending on banner ads is on fire, In 2022, it reached a staggering $158.2 billion, fueled by a sizzling growth rate of 12.8%. (Source)
- Over half (57%) of U.S. consumers admit to paying attention to digital outdoor ads, particularly billboards and street-level displays. (Source)
- Digital ads leave a lasting impression. Studies show that seeing display ads, consumers are 155% more likely to search for the brand’s specific terms online. (Source)
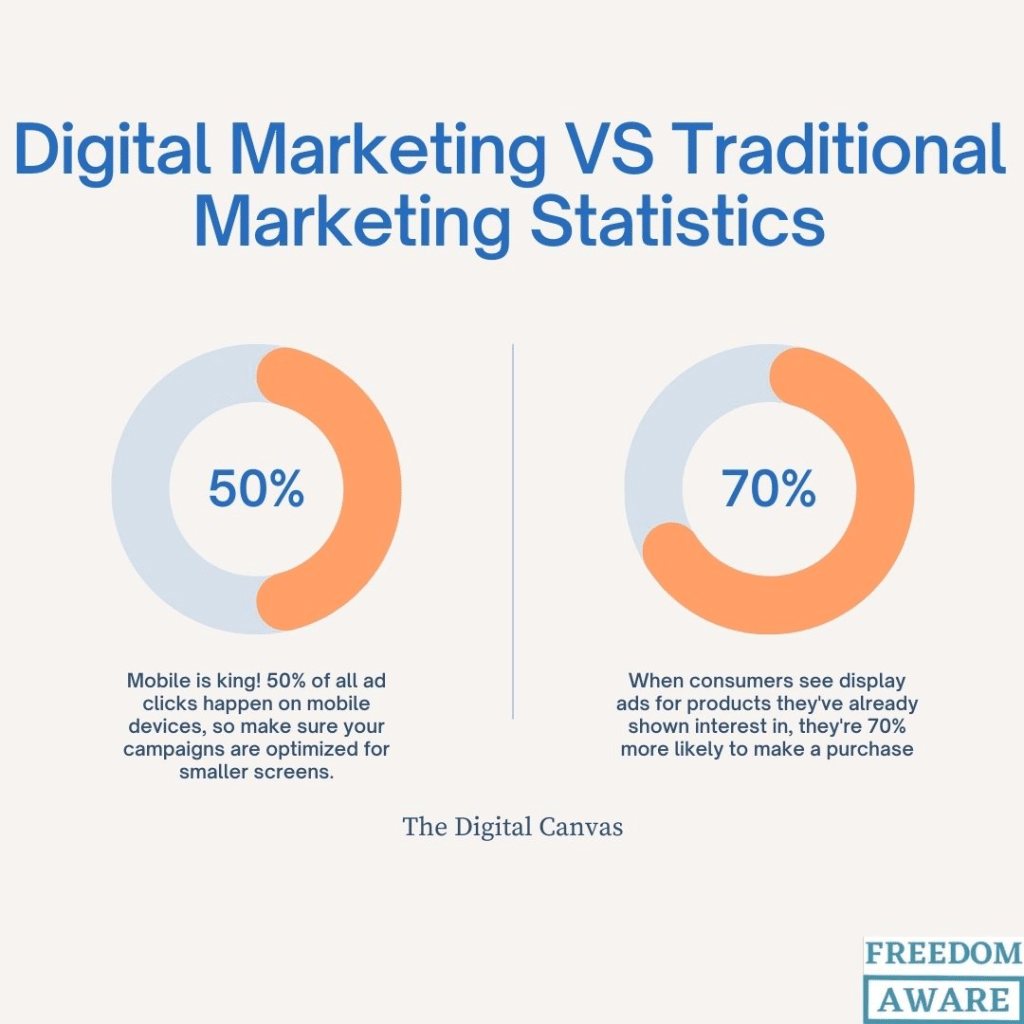
- Mobile is king! 50% of all ad clicks happen on mobile devices, so make sure your campaigns are optimized for smaller screens. (Source)
- When consumers see display ads for products they’ve already shown interest in, they’re 70% more likely to make a purchase. (Source)
- Digital billboards are stealing the show in the UK! In 2021, digital displays comprised 64% of the country’s total outdoor ad revenue. (Source)
The Power of Email Marketing: Still Going Strong (Digital Marketing VS Traditional Marketing Statistics)
Email marketing is a powerful digital marketing channel that allows you to directly connect with customers, promoting your latest products and offers. By integrating it with marketing automation tools, you can deliver personalized messages at the right time, maximizing the impact of your campaigns.
- The effectiveness speaks for itself. 79% of marketers rank email marketing as one of their top 3 marketing strategies. (Source)
- Email remains a favorite among consumers, with roughly 50% preferring to be contacted by businesses through email. (Source)
- Half of media planners already leverage email marketing, and a significant 22% plan to jump on board soon. (Source)
- MailChimp, the leading B2B platform, boasts an impressive annual revenue of $800 million. (Source)
- Trailing closely behind is ActiveCampaign, raking in $165 million annually. (Source)
- Get ready for a high return on investment (ROI). Email marketing delivers $36 for every $1 spent. (Source)
- About 90% of brands consider email marketing to be critical to their success as a brand. (Source)
- With a massive audience of over 4.14 billion email users worldwide, email advertising has a bright future for reaching new customers. (Source)
- As of 2021, over 65% leverage automation in their email marketing campaigns, ensuring efficient and targeted outreach. (Source)
- According to a February 2024 global survey, over half (58%) of marketing executives now use automation tools to streamline their email marketing efforts. (Source)
- The global average click-through rate for marketing emails in 2020 was 2.6%. However, Australia stands out with a higher CTR of 3.1%. (Source)
- Reading time for brand emails has dipped to 10 seconds in 2024, compared to 13.4 seconds in 2018. Time to grab attention fast! (Source)
- The market is expected to balloon from $7.5 billion in 2020 to $17.9 billion by 2027, thanks to a solid 13.3% CAGR. (Source)
- A recent 2023 survey found that 88% of email users check their inboxes several times a day. (source)
- In the US, 62% of B2B and B2C marketers boosted their email marketing budgets in the past year, leaving other channels in the dust. (source)
Social Media Marketing Statistics (Digital Marketing VS Traditional Marketing Statistics)
- Social media users are exploding worldwide, with a current user base of 4.9 billion. By 2027, that number is expected to reach a staggering 5.85 billion. (Source)
- A staggering 91.9% of marketers in large US organizations leverage social media platforms for marketing purposes. (Source)
- Globally, social media marketing spending reached an estimated value of $230.30 billion. (Source)
- The average US adult spends 2 hours and 25 minutes daily on social media platforms. (Source)
- The annual ad spend is expected to surge at a healthy CAGR of 11.99%, pushing the market volume to a whopping $362 million by 2026. (Source)
- Social media marketing spending in the US hit a record high of over $80.67 billion in 2022. (Source)
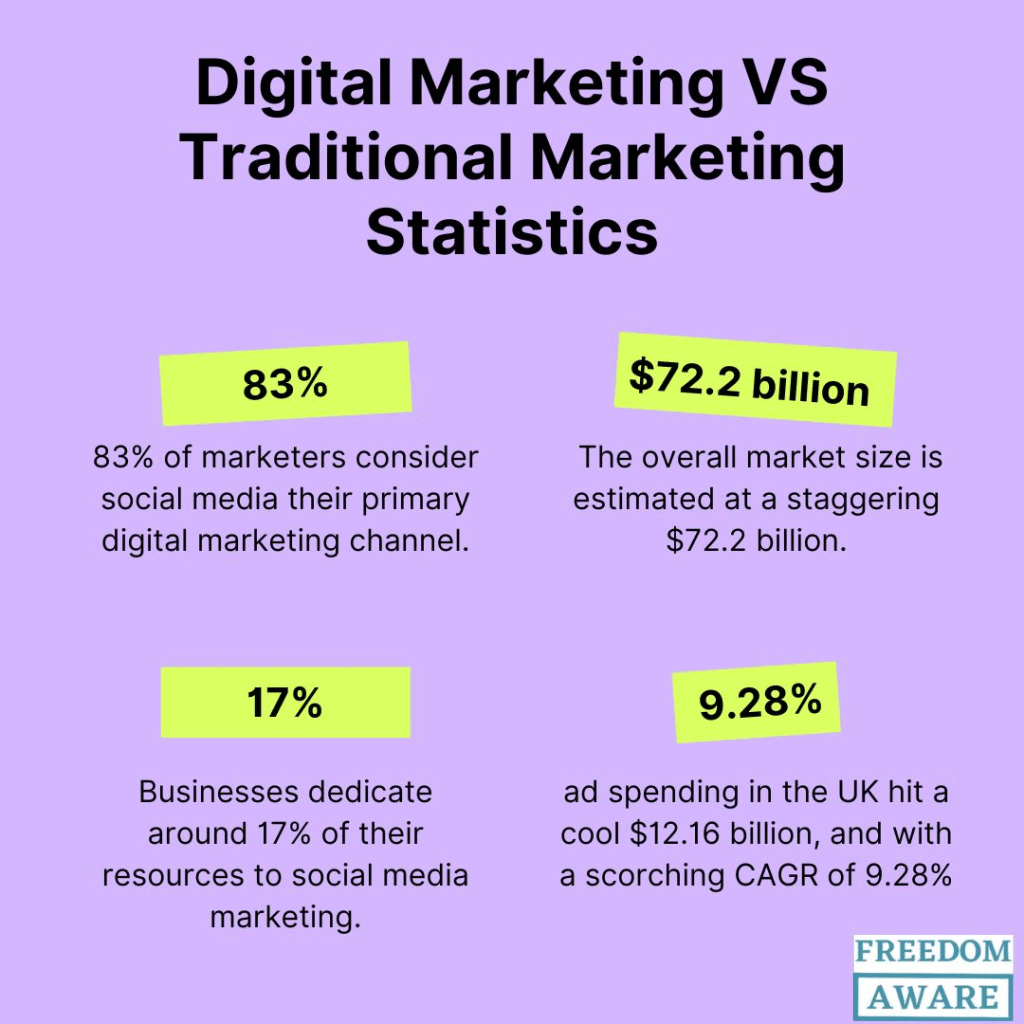
- Across 29 countries, 83% of marketers consider social media their primary digital marketing channel. It’s a global force you can’t ignore. (Source)
- The overall market size is estimated at a staggering $72.2 billion. (Source)
- Businesses dedicate around 17% of their resources to social media marketing. (Source)
- In 2022, ad spending in the UK hit a cool $12.16 billion, and with a scorching CAGR of 9.28%, that number is expected to climb to a massive $17.34 billion by 2026. (Source)
Mobile Marketing Performance Statistics (Digital Marketing VS Traditional Marketing Statistics)
Mobile advertising budgets are on the rise as consumer habits shift towards smartphones. People are spending more and more time on their phones, making them a prime target for advertisers.
- Social media reigns supreme in mobile advertising, with a projected market spend of $141 billion in 2022. (Source)
- In 2022, worldwide spending hit a staggering $327.1 billion, reflecting a 17.2% jump from the previous year. (Source)
- Fueled by surging demand, the mobile ad market is on an unstoppable trajectory, with projections reaching nearly $399.6 billion by 2024 (source).
- Mobile marketing budgets are on a steady climb. In just six months, spending jumped from 13.5% in February 2020 to 23% in June. This upward trend is expected to continue, with marketers anticipating a whopping 35.7% of their budgets dedicated to mobile marketing within the next five years (Source).
- Nearly seven out of ten marketers are on board with mobile. A study reveals that 69% of surveyed marketers use mobile channels in their digital marketing strategies (Source).
- Mobile advertising is on a global spending spree, surging from an estimated $234 billion in 2019 to a projected $495 billion by 2024. (Source)
- The US leads the pack in mobile ad spend. A projected $120 billion in 2020 puts them far ahead of China, the second-largest market, by nearly $50 million. (Source)
- Smartphones are driving Facebook’s ad revenue. Over 92% came from mobile in 2018, a significant jump from 88% in 2017. (Source)
Search Engine Marketing Statistics (Digital Marketing vs Traditional Marketing Statistics)
Search Engine Marketing (SEM) drives Results, combining paid search advertising with organic SEO strategies to supercharge your brand’s search engine visibility. Search engine marketing is a powerful digital advertising strategy for putting you directly in front of your target audience.
- Google is the undisputed king when it comes to online searches, holding a massive 91.61% market share globally (Source).
- Over 6 in 10 internet users are swayed by Google paid search ads, highlighting their effectiveness in capturing user interest (Source)
- In 2019, 75% of people found paid search ads helpful in locating the information they needed on a website or search engine. (Source)
- Google dominates the search landscape, holding a staggering 85% share of global desktop searches and a near-monopoly on mobile with a 98% market share. (Source)
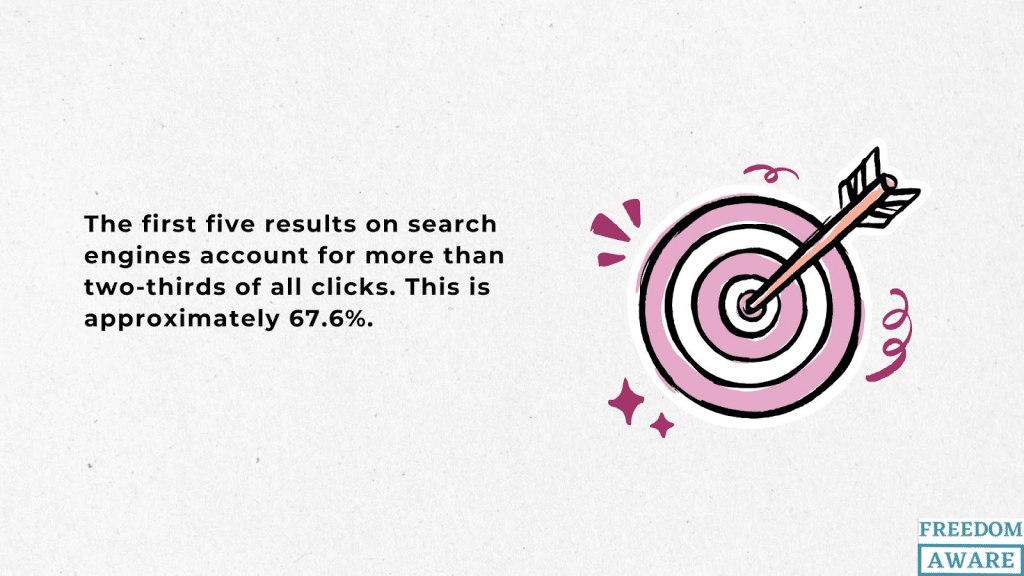
- The first five results on search engines account for more than two-thirds of all clicks. This is approximately 67.6%. (Source)
Native Advertising Statistics (Digital Marketing VS Traditional Marketing Statistics)
Native ads are the chameleons of online advertising. They seamlessly adapt to the platform they’re on, delivering paid content that feels like a natural part of the user experience.
- Surveys reveal that people find native ads 62% easier to understand compared to display ads, and 31% easier than social media ads. (Source)
- native ad recommendations are 27% more trusted than social media ads. (Source).
- 50% of marketers recognize native advertising as a force to be reckoned with in the online advertising landscape. (Source)
- Native advertising packs a punch! It can boost brand affinity by 18% and purchase intent by 9%. (Source)
- Get ready for a native advertising boom! By 2025, the global market is expected to reach $400 billion, reflecting a massive 372% growth since 2020. (Source)
- 68% of consumers trust native ads seen in an editorial context, compared to 55% for social media ads. (Source)
- Native advertising boasts an average CTR of 0.30%, more than double the click-through rate of display ads (0.12%). (Source)
- Consumers are 53% more likely to set their sights on native ads compared to traditional banner ads. (Source)
General Traditional Marketing Statistics (Digital Marketing VS Traditional Marketing Statistics)
Traditional Marketing is the opposite of digital marketing it operates offline, employing methods like TV commercials, print ads, and direct mail.
- In 2022, business-to-business (B2B) traditional advertising spending in the United States was projected to amount to 17.7 billion U.S. dollars, marking a 5.8 percent increase from the previous year. (Source)
- B2B traditional ad spending is expected to keep growing and is projected to reach 19.2 billion dollars by 2024. (Source)
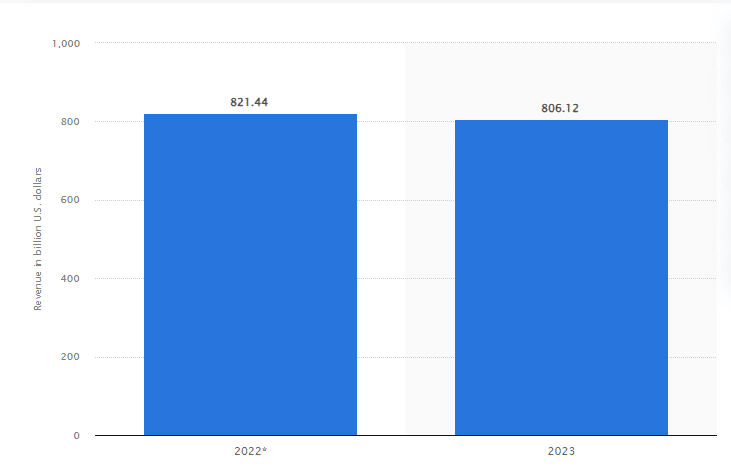
- Traditional advertising dipped slightly in 2023. Global spending landed at just over $806 billion U.S. dollars, reflecting a 1.9% decrease compared to the previous year’s total of over $821 billion. (Source)
- 50% of consumers prefer the convenience of buying online and picking up their purchases in-store, (Source)
Radio Advertising Statistics (Digital Marketing VS Traditional Marketing Statistics)
- The global radio market continues to expand, experiencing a healthy 6.8% compound annual growth rate, reaching over $19.58 billion in 2022. (Source)
- Over 90% of U.S. radio ad revenue from 2006 to 2022 stemmed from OTA (over-the-air) broadcasts. (Source)
- Retailers pumped an estimated $316 million into radio ads in 2019, securing the number two spot among radio advertisers. (Source)
- The market is expected to shrink at a CAGR of -0.46% from 2024 to 2029, reaching a projected volume of US$27.95 billion by 2029. (Source)
- The average ad spending per radio listener in the Traditional Radio Advertising market is estimated to be US$9.25 in 2024. (Source)
- By 2029, the number of listeners is anticipated to reach 3.21 billion globally. (Source)
- The US leads the way in traditional radio ad spending, highlighting the enduring relevance of this medium in the modern marketing world. (Source)
- Nearly half (46%) of radio listeners report considering a new product, service, or even a whole new company after hearing an ad on the radio. (Source)
- The global radio market is forecast to grow steadily at a CAGR of 4.6%, reaching $23.43 billion by 2026. (Source)
The Power of the Screen (Digital Marketing VS Traditional Marketing Statistics): Television Advertising Statistics
Once the king of the living room, television advertising reigned supreme. Reaching millions with captivating audio-visual storytelling, it surpassed the impact of print and radio. However, the rise of the internet and social media has shifted the entertainment landscape. Television viewership has fragmented, reducing the guaranteed reach advertisers once enjoyed.
Even though TV advertising lost its No.1 top advertising medium spot to the Internet, it is still the second-largest advertising medium. It beats print media.
- The global TV advertising revenue was estimated at $151 billion in 2021. However, this figure rose to $159 million in 2022. (Source)
- The US TV ad market is projected to reach $81.0 billion by 2025, up from an estimated $72.3 billion in 2021. (Source)
- The pandemic hit a pause on TV ad spending. Global revenue dipped to $141 billion in 2020 due to COVID-19 disruptions. (Source)
- The US TV penetration rate has dipped 10 percentage points since 2014, reaching 71% in 2021. (Source)
- The United Kingdom has the highest TV ad spend in Central and Eastern Europe (CEE). (Source)
- North America accounted for a massive $64.5 billion television advertising in 2021. (Source)
- In 2021, the TV ad revenue in the UK was worth £5.38 billion. (Source)
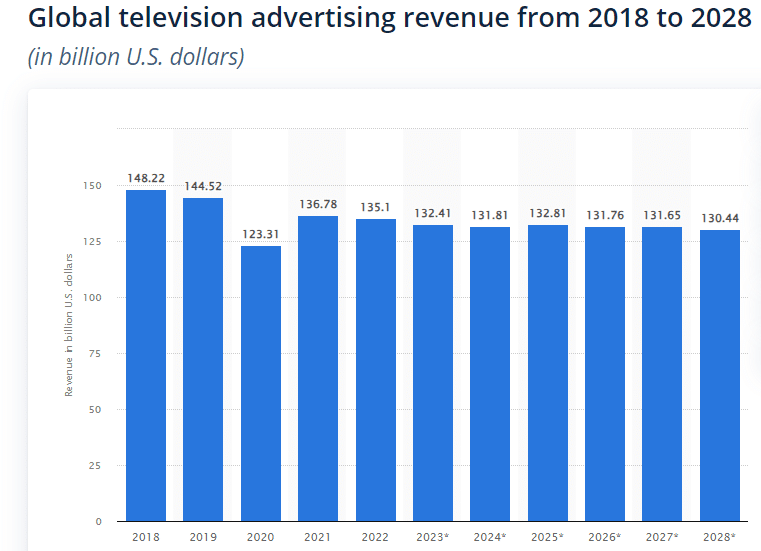
- Global revenue lands at roughly $132.4 billion U.S. dollars, down from $135.1 billion in 2022. The trend is expected to continue with slight fluctuations in the coming years. (Source)
Out-of-Home Advertising Reach (Digital Marketing VS Traditional Marketing Statistics)
Out-of-home advertising, or OOH for short, goes where people do. Think eye-catching posters, stadium signage, dynamic digital billboards, and even airplane ads, all designed to grab attention outside the home.
- JCDecaux, the world’s largest outdoor advertising company, raked in over $3.2 billion in revenue in 2021. (Source)
- In 2021 Clear Channel Outdoor Company is the second largest outdoor advertising firm globally with a revenue of $2.2 billion. (Source)
- McDonald’s dominated the U.S. out-of-home advertising landscape, shelling out $59.9 million on ads. Apple trailed closely behind, spending $57 million. (Source)
- A survey found that a whopping 92% of marketers in the U.S. increased their spending on outdoor ads in 2022. (Source)
- The U.S. billboard scene saw a surge in 2021, with the number jumping from 343,106 in 2020 to over 351,000 by year’s end. (Source)
- A U.S. survey revealed an 84% anticipation of more interactive outdoor advertisements among over 611 marketers. Additionally, 60% of those surveyed believe declining digital ad effectiveness is due to consumer fatigue with digital content. (Source)
- 92% of U.S. marketers surveyed ramped up their outdoor advertising in 2022. (Source)
- Billboards reign supreme in outdoor advertising, with 80% of U.S. consumers noticing them. Following closely behind are printed signs displayed in physical locations. (Source)
- The global billboard and outdoor market is expected to reach a staggering $66.8 billion by 2022 (Source)
- The market is projected to grow at a healthy Compound Annual Growth Rate (CAGR) of 8.3% between 2022 and 2026 (Source)
- By 2026, the market is expected to be valued at an even more impressive $87.76 billion, with a CAGR of 7.1% (Source)
- The global outdoor advertising spending reached over $34 billion in 2021. The value is expected to increase to $42 billion by 2024. (Source)
Telemarketing Statistics (Digital Marketing VS Traditional Marketing Statistics)
Telemarketing is all about reaching out to potential buyers with phone calls to promote products or services. Think of it as the original “cold call,” connecting with folks who might not be expecting your pitch.
Phone calls are still the preferred means of communication for marketers, especially due to increased remote jobs and limitations on face-to-face interactions.
- There’s a 75% chance of the prospect picking up on the first attempt. (Source)
- The best time of the day to call prospective customers is between 4 pm and 5 pm. (Source)
- Over 93% of a cold call’s success hinges on the caller’s vocal tone. (Source)
- 76% of top performers say they “always” perform research before reaching out to prospects. (Source)
- 63% of sellers say cold calling is the worst part of their job. (Source)
- 75% of CEOs said they would take based on call cold. (Source)
Print Advertising Statistics (Digital Marketing VS Traditional Marketing Statistics)
The print advertising industry is all about tangible impact. It includes classic channels like consumer magazines, newspapers, posters, and banners – all delivered in physical, printed form. The digital versions are excluded.
- Newspapers take the crown in the world of print advertising, boasting a massive market volume of $35.59 billion in 2022. (Source)
- By 2029, the number of readers in the Print Advertising market is estimated to reach 3.1bn users. (Source)
- Ad spending in the global Print Advertising market is expected to hit $34.28 billion in 2024. (Source)
- The global ad spend on magazine advertising reached a cool $14.79 billion in 2022. (Source)
- The global ad spend for print advertising was about $50.38 billion in 2022. (Source)
- The total number of print newspaper readers, worldwide, is expected to reach over 1.2 billion by 2026. (Source)
Direct Mail Advertising Statistics (Digital Marketing VS Traditional Marketing Statistics)
Think of direct mailing as old-school email marketing. It’s all about reaching your target audience with physical sales materials like brochures, coupons, or even free samples – delivered straight to their doorstep.
- Direct mail boasts a knockout open rate of 80-90%, leaving email marketing in the dust with just 20-30%. (Source)
- The market is expected to experience an annual growth rate (CAGR 2024-2029) of 1.14%, leading to a projected market volume of US$61.59bn by 2029. (Source)
- While digital ads battle for attention, direct mail cuts through the noise. This personalized and tangible marketing strategy is a global success story, proving that sometimes, old-school tactics still reign supreme. (Source)
- 74% of marketers claim that direct mail delivers the best ROI response rate and conversion rate of all other channels. (Source)
- The global direct mail market soared to a staggering $72.67 billion in 2022, proving that direct mail still packs a punch. (Source)
- Direct mail continues to be a big deal in the U.S., with spending reaching a hefty $43.3 billion in 2022. (Source)
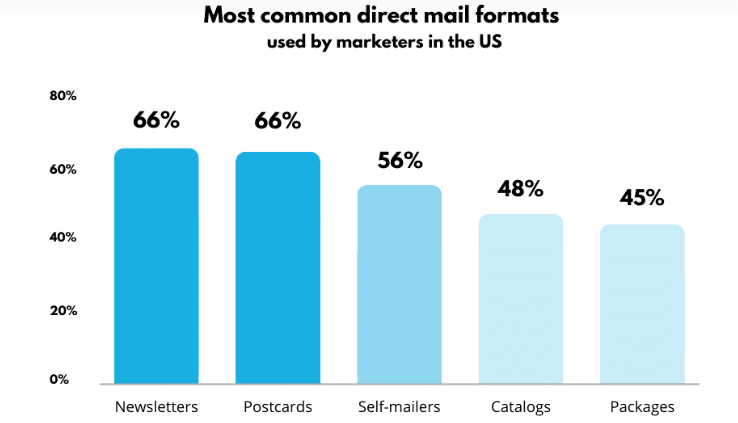
Marketers in the US have a toolbox of direct mail formats to choose from. Newsletters and postcards keep it concise, while self-mailers offer more space for your message. For a bigger impact, catalogs and packages can showcase your products in all their glory.
FAQs About Digital Marketing vs Traditional Marketing (Digital Marketing VS Traditional Marketing Statistics)
- What is the difference between digital marketing and traditional marketing? Digital marketing refers to the promotion of products, brands, or services using digital channels, while traditional marketing refers to the promotion of products, brands, or services using offline channels.
- Which is more effective, digital marketing or traditional marketing? The most effective strategy often lies in combining both approaches, using digital marketing to reach a wider audience and traditional marketing to create an emotional connection with customers.
- What are the advantages of digital marketing? Digital marketing provides increased reach, improved targeting, cost-effectiveness, measurable results, and flexibility.
- What are the disadvantages of digital marketing? Digital marketing is vulnerable to information overload, constant evolution, security concerns, and dependence on technology.
- What are the advantages of traditional marketing? Traditional marketing provides a tangible, physical experience for customers, emotional connection, brand awareness, and local reach, and no technology is required.
- What are the disadvantages of traditional marketing? Traditional marketing can be expensive, limited in reach, difficult to measure, time-consuming, and have a negative environmental impact.
Conclusion: Digital Marketing VS Traditional Marketing Statistics
The age-old debate continues to rage: is digital marketing more effective than traditional marketing? The answer, however, is a complex one. It depends on your company’s unique needs and marketing objectives.
The digital vs traditional marketing puzzle has been a topic of discussion for as long as digital marketing has been around. While traditional marketing may be considered “old-fashioned” by some, it still holds a special place in the hearts of many consumers.
Take direct mail marketing, for instance. Statistics show that it leads to higher response rates and ROI. Contrary to popular belief, traditional marketing is still alive and kicking, and it takes savvy marketers to unlock its full potential.
Rather than pitting digital against traditional, why not harness the power of both? Each has its strengths and weaknesses; combining them allows you to create a truly unstoppable marketing strategy.
For example, traditional marketing excels at reaching local audiences and establishing credibility, while digital marketing can increase your reach and exposure to a wider target audience. Multichannel marketing statistics confirm that using multiple marketing channels is the key to achieving positive results.
So, why choose between digital and traditional marketing when you can use both to supercharge your marketing strategy, generate more leads, and boost sales?
Leave a Reply