


Here are 100+ Top Film Industry Statistics You should know in 2025 and beyond:
The Evolving Landscape of Film (Film Industry Statistics)
The film industry, a multi-billion dollar global market, has undergone a significant transformation driven by:
- Digital Technology: From production techniques to distribution channels, digital advancements have reshaped the industry.
- Streaming Services: The rise of streaming platforms has disrupted traditional film distribution models and viewing habits.
- Shifting Consumer Preferences: Evolving audience demands for content and accessibility influence film production and consumption.
Impact and Influence (Film Industry Statistics)
The film industry plays a major role in:
- Economic Growth: It contributes significantly to the economies of various regions by generating revenue and creating jobs.
- Global Entertainment: Film provides entertainment and cultural experiences for audiences worldwide.
- Technological Innovation: The industry constantly adapts and embraces new technologies, fostering further advancements.
AI in Filmmaking (Film Industry Statistics)
Artificial intelligence (AI) is emerging as a tool within the film industry, with both potential benefits and concerns:
- Enhanced Content Creation: AI can assist with tasks like special effects, animation, and content personalization, potentially leading to more engaging films.
- Creativity and Diversity: Some argue that AI could stifle creative expression and limit film diversity.
This article delves deeper into key statistics and trends that are shaping the future of filmmaking, exploring the interplay of technology, audience preferences, and the evolving global film landscape.
Global Film Industry Growth (Film Industry Statistics)
- The global film and entertainment industry is projected to reach a staggering $169.62 billion by 2030, with a steady growth rate (CAGR) of 7.21% between 2023 and 2030.
- The global film and video market is estimated to reach $344.84 billion by 2027, highlighting continued industry expansion.
Audience Preferences (Film Industry Statistics)
- A significant portion (50%) of Gen Z moviegoers prioritize audio-visual quality when deciding on a film to watch in theaters.
International Co-Productions (Film Industry Statistics)
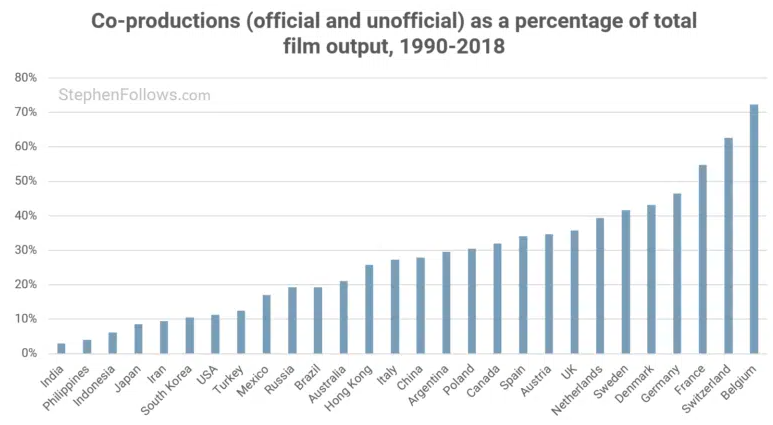
- Belgium leads the world in co-productions, with a remarkable 72% of their films being created in partnership with other countries.
Regional Film Markets (Film Industry Statistics)
- China, the world’s second-largest film market, produced a staggering 1,082 movies in 2018 alone.
- The Asian cinema market is expected to see impressive growth, with revenue reaching $32.52 billion by 2024 and user numbers climbing to 1.1 billion by 2029.
- North America remains the largest region in the film and video market, though box office revenue in the United States and Canada reached roughly $8.91 billion overall.
- In contrast, Mexico held the top spot for box office revenue in Latin America in 2022.
- Interestingly, Ghana’s box office revenue is projected to remain stable at $1.1 million from 2018 to 2023.
- A noteworthy statistic reveals that in 2021, over 100 titles released across Liberia, Ghana, and Nigeria were produced by Nollywood, a prominent African film industry.
Box Office Recovery and Regional Trends (Film Industry Statistics)
- Cinema attendance in the EU and UK saw a significant rebound in 2022, with ticket sales increasing by 63% from 2021.
- The box office revenue from Europe, the Middle East, and Africa collectively reached $10.9 billion in 2022, exceeding half of the global total of $21.3 billion.
- France’s box office revenue experienced a substantial jump in 2022, rising to 1.1 billion euros, a 62.7% increase compared to the previous year.
AI in Filmmaking: Public Perception (Film Industry Statistics)
- A survey revealed that 38% of respondents were open to the idea of using AI to generate voices for animated characters.
- However, the use of AI in filmmaking seems to be met with some reservations, with only 22% of men and 14% of women believing it will have a positive impact on the industry.
Global Film Industry Growth (Film Industry Statistics)
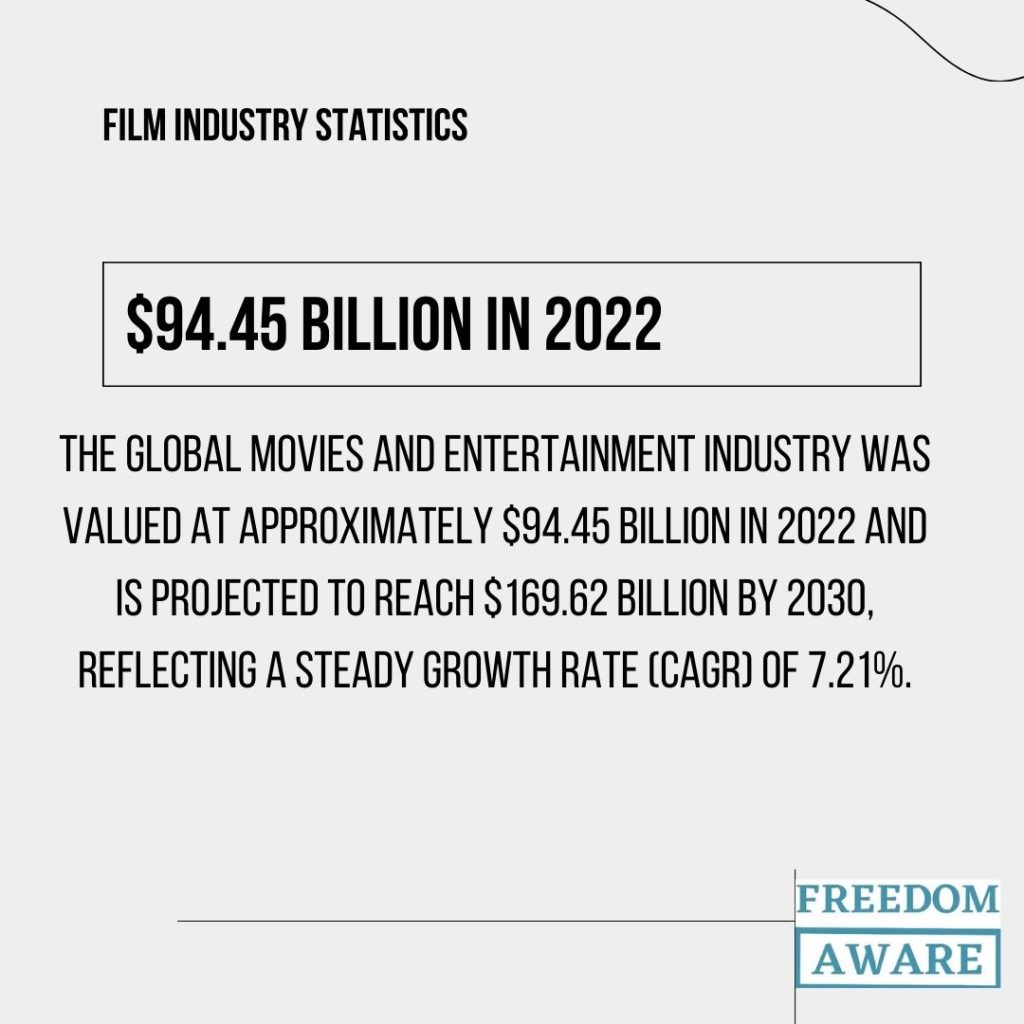
- The global movies and entertainment industry was valued at approximately $94.45 billion in 2022 and is projected to reach $169.62 billion by 2030, reflecting a steady growth rate (CAGR) of 7.21%. (source)
- China, North America (including the United States and Canada), and Japan dominated the global box office revenue in 2021. (source)
- The United States led the pack, generating around $24 billion. (source)
- followed by China at $12 billion and Japan at $3.6 billion. (source)
Industry Employment and Revenue (Film Industry Statistics)
- As of 2022, the global film industry employed an estimated 389,000 people across 57,000 businesses, with a projected revenue of $76.7 billion. (source)
Emerging Markets (Film Industry Statistics)
- The film markets in Indonesia and India are expected to experience significant growth, with projections of 293% and 231% increase, respectively. (source)
Impact of COVID-19 (Film Industry Statistics)
- The theatrical market revenue across 60 economies dropped significantly in 2020 (down 71% from 2019) to U.S. $11.9 billion. This decline is likely attributed to cinema closures and reduced movie attendance due to the COVID-19 pandemic. (source)
Film and Video Market Growth (Film Industry Statistics)
- The film and video market is projected for continuous growth, with an expected CAGR of 5.0% reaching $344.84 billion by 2027. (source)
- Market size has steadily increased from $285.62 billion in 2024 to an estimated $390.76 billion in 2028, reflecting a CAGR of 6.5%. (source)
Production Budget Trends (Film Industry Statistics)
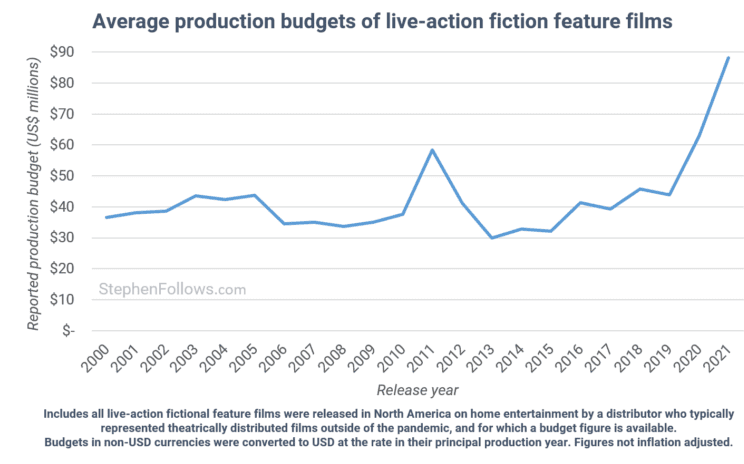
- The average budget for producing live-action feature films has grown significantly, rising from around $38 million in 2000 to $87 million in 2021. (source)
Movie Profanity Statistics (Film Industry Statistics)
- A study suggests that films from certain countries, including Ireland, the UK, Australia, Canada, and the USA, tend to have a higher frequency of swearing. (source)
- Specific data from the study reveals that nearly 71% of 553 Thai movies analyzed contained at least one swear word, while the average Irish film included approximately 26.6 swear words. (source)
International Film Co-Productions (Film Industry Statistics)
- Belgium leads the world in co-productions, with an impressive 72% of their films being created in collaboration with other countries. (source)
International Co-Production Levels (Film Industry Statistics)
- While Belgium holds the top spot for co-productions, some countries maintain lower levels of collaborative filmmaking. India has 3%, the Philippines has 4%, and Indonesia has 6% of their films produced as co-productions. (source)
Top Foreign Films in Spain (Film Industry Statistics)
- Analyzing audience preferences in Spain, “Titanic,” “Avatar,” and “E.T. the Extra-Terrestrial” emerge as the three most-viewed foreign films of all time. (source)
Gen Z Moviegoing Preferences (Film Industry Statistics)
A survey conducted in the United States revealed key factors influencing Gen Z’s decision to attend movie theaters:
- Availability of desired films: 61% of Gen Z respondents considered this a very important factor. (source)
- Audio-visual quality of the film: 50% of Gen Z moviegoers prioritized high audio-visual quality. (source)
- Movie ticket quality: Nearly half (48%) of Gen Z respondents considered the quality of movie tickets to be an important factor. (source)
Global Box Office Trends (Film Industry Statistics)
- Despite a rebound in 2021, global box office revenue remained significantly impacted by the COVID-19 pandemic. In 2021, it reached $21.3 billion, with Asia Pacific leading the way at $10.9 billion. (source)
- followed by EMEA (Europe, the Middle East, and Africa) at $5 billion. (source)
- Pre-pandemic figures illustrate a sharper contrast: global box office revenue reached $44.5 billion in 2019, dropping to $16.5 billion in 2020. (source)
Regional Box Office Performance (Film Industry Statistics)
- India’s box office demonstrated remarkable resilience in 2022, selling over 981 million tickets, exceeding the combined sales of China, the United States, Mexico, and Japan. (source)
- The Nigerian box office market also showed promise, with revenue projected to grow from $12 million in 2017 to $17 million in 2023. (source)
Genre and Film-Specific Performance (US & Canada) (Film Industry Statistics)
- Romantic comedies consistently captured a niche in the US and Canadian market, contributing at least 4% of box office revenue. (source)
- “Barbie” dominated the US and Canadian box office in 2023, generating a domestic revenue of approximately $636.23 million. (source)
3D Film Market Trends (US & Canada) (Film Industry Statistics)
- 3D film popularity declined in the US and Canada, with box office revenue dropping from $2.2 billion in 2010 to $1.3 billion by 2017. (source)
Asian Cinema Landscape (Film Industry Statistics)
- Boasting film powerhouses like India, China, Japan, and South Korea, Asia is a world leader in film production. (source)
- China stands out as the world’s second-largest film market, producing a staggering 1,082 movies in 2018, compared to 526 in 2010. (source)
Market Growth and User Base (Film Industry Statistics)
- The Asian cinema market is projected for significant growth, with revenue expected to reach $32.52 billion by 2024 and climb further to $43.14 billion by 2029, reflecting a CAGR of 5.81%. (source)
- This growth is likely fueled by a rising user base, anticipated to reach 1.1 billion by 2029. (source)
Box Office Recovery and China’s Dominance (Film Industry Statistics)
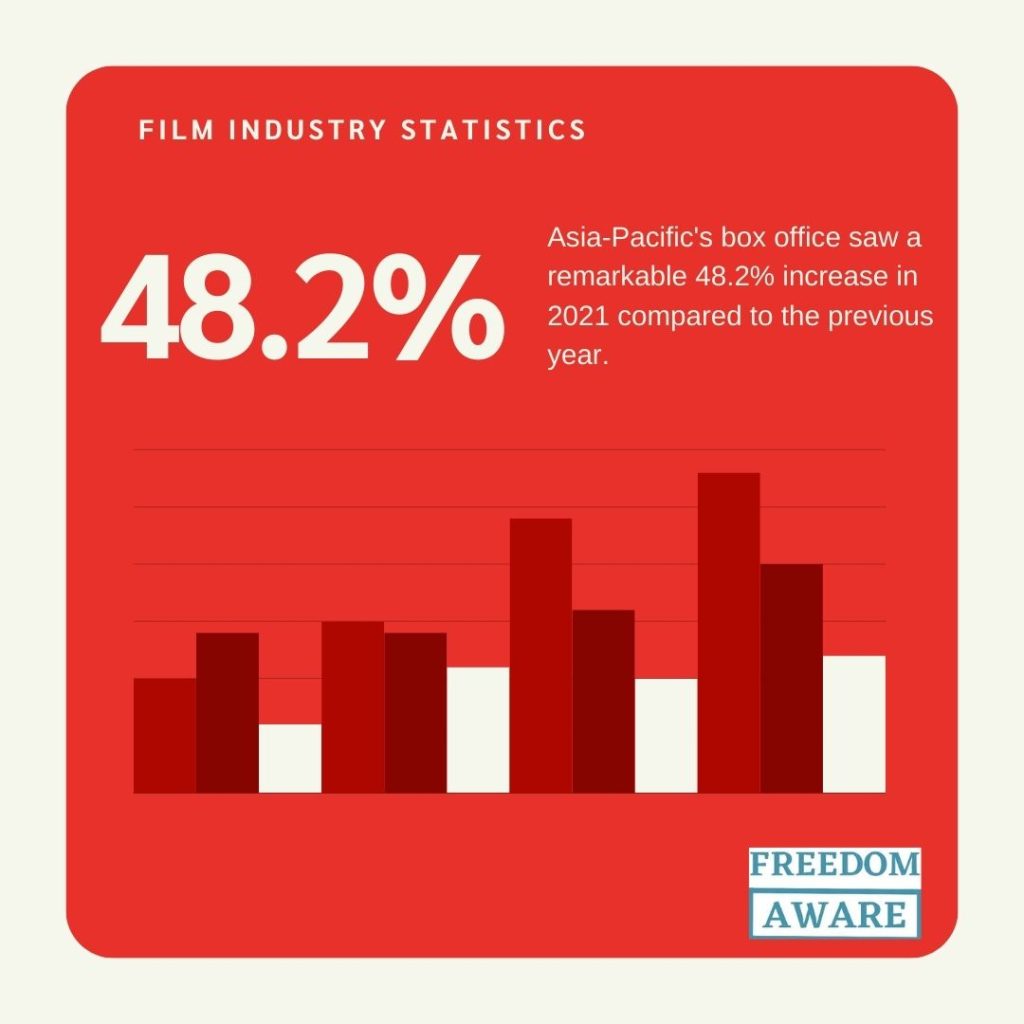
- Asia-Pacific’s box office saw a remarkable 48.2% increase in 2021 compared to the previous year. (source)
- China played a major role, contributing $6.76 billion of the total $8.76 billion in movie theater revenue. (source)
- China’s box office dominance is further solidified by “The Battle at Lake Changjin,” the country’s highest-grossing film of all time, reaching 5.78 billion yuan. (source)
- “Wolf Warriors 2” follows closely as the second-highest earner at 5.69 billion yuan. (source)
- Despite the pandemic, China’s theatrical market shows resilience. In 2023, it sold approximately 1.3 billion tickets, which is nearly 76% of the pre-pandemic sales in 2019. (source)
India’s Box Office Performance (Film Industry Statistics)
- India’s box office displayed impressive strength in 2022, selling nearly 981 million movie tickets, surpassing the combined sales of China, the United States, Mexico, and Japan. (source)
European Film Industry Recovery (Film Industry Statistics)
- European cinema attendance shows signs of a rebound. In 2022, ticket sales reached an estimated 657 million in the EU and UK. (source)
- A significant 63% increase from 2021 and representing 69% of pre-pandemic levels (2014-2019 average). (source)
- This recovery is further reflected in a rise in film production. An estimated 1,960 feature films were produced in the EU and UK in 2022. (source)
- The second-highest number on record and exceeding 2021 figures by 194 films. (source)
- Notably, both feature documentaries and fiction films saw growth, with 771 and 1,189 films produced respectively in 2022. (source)
Box Office Performance (Film Industry Statistics)
- European films are regaining audience interest. Their market share climbed from 26.8% in 2021 to 28.4% in 2022 within the EU and UK. (source)
- Gross box office revenue in the EU and UK also experienced a significant increase, rising by 70% from €3.0 billion in 2021 to €5.1 billion in 2022. (source)
Regional Variations (Film Industry Statistics)
While Europe as a whole shows recovery trends, individual countries experienced varying degrees of success
- Norway saw a remarkable 55% increase in cinema attendance in 2021, reaching 75% of pre-pandemic levels. (source)
- Turkey’s theatrical market, though growing year-on-year, only reached 53% of its pre-pandemic admission levels in 2022. (source)
- France’s box office revenue saw a substantial jump in 2022, reaching €1.1 billion, a 62.7% increase compared to the previous year. (source)
- Germany and Spain also witnessed significant growth in box office revenue, with increases of 93.5% and 50.2% respectively in 2022. (source)
Global Context (Film Industry Statistics)
- The box office revenue from Europe, the Middle East, and Africa (EMEA) collectively amounted to $10.9 billion in 2021, exceeding half of the global total of $21.3 billion. (source)
- However, a more recent figure suggests the EMEA region’s box office revenue reached $7.1 billion in 2022. (source)
North American Film Industry: Market Leader with Signs of Recovery (Film Industry Statistics)
- North America remains the dominant region in the film and video market, with theaters consistently ranking high due to the historical prevalence of US studios in producing major motion pictures. (source)
Box Office Performance (Film Industry Statistics)
- Despite ranking second globally in terms of movie production influence, North America’s box office revenue in 2023 reached $8.91 billion, reflecting a positive trend compared to $7.37 billion in 2022. (source)
- This growth is further supported by an increase in film releases, with 449 movies hitting theaters in the US and Canada in 2022 compared to 406 in the previous year. (source)
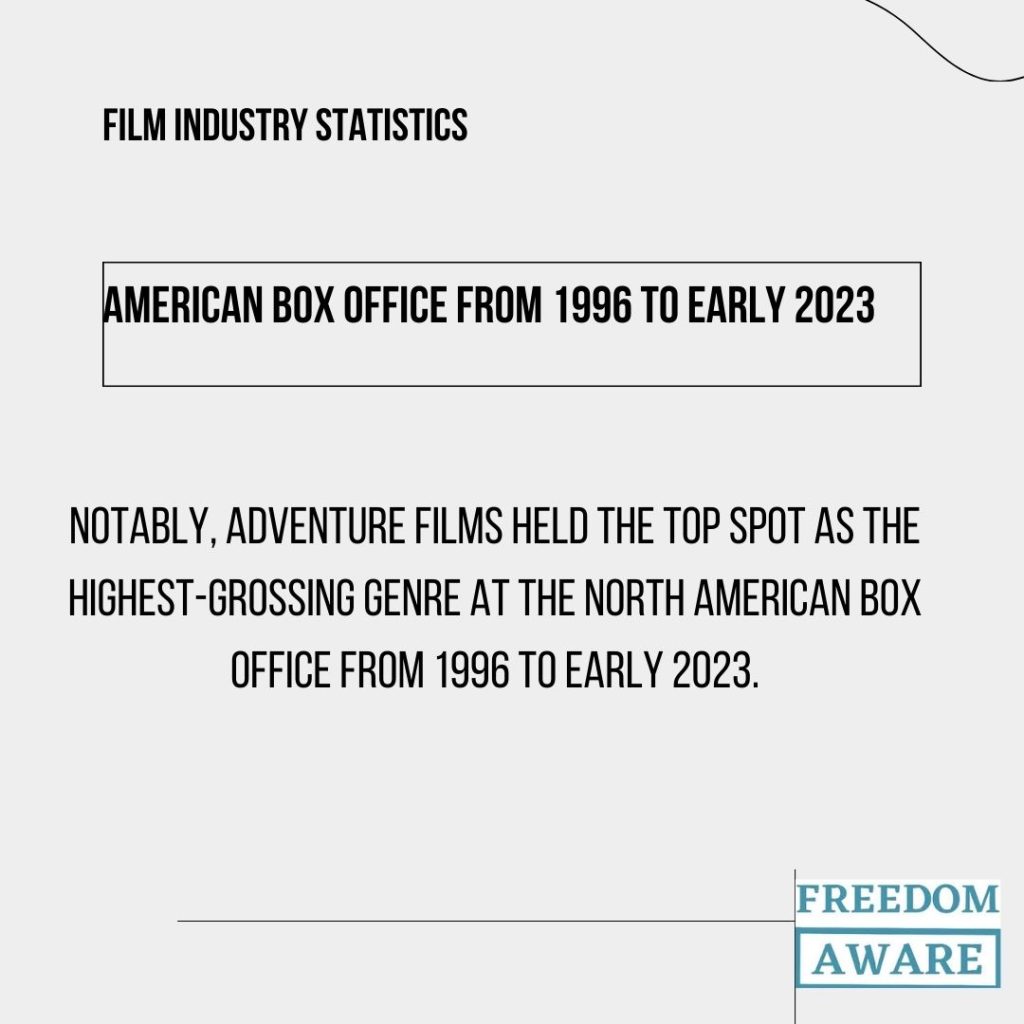
- Notably, adventure films held the top spot as the highest-grossing genre at the North American box office from 1996 to early 2023. (source)
Movie Theater Attendance and Chain Dominance (Film Industry Statistics)
- AMC is the largest theater chain in the US and Canada as of March 2023, with 7,710 screens. (source)
- AMC witnessed a significant increase in attendance, rising from 75 million in 2020 to over 200 million in 2022. (source)
Global Context (Film Industry Statistics)
- While North America holds a significant market share, its box office revenue in 2023 accounted for approximately 29% of the global total. (source)
Growth Potential in South America’s Film Industry (Film Industry Statistics)
- Argentina’s filmed entertainment market shows significant promise, with a projected growth rate exceeding 390% from 2021 to 2026. (source)
Mexican Market Dominance (Film Industry Statistics)
- Mexico leads the Latin American film industry in terms of box office revenue, surpassing the combined figures of Brazil and Argentina in 2022. (source)
- Mexico boasts the highest number of active cinema screens in Latin America (over 7.4 thousand in 2022), exceeding neighboring countries. (source)
- This screen count further increased to 7,637 by the end of 2023. (source)
Box Office Performance and Popular Genres (Film Industry Statistics)
- The gross box office revenue in Latin American cinemas reached $166.4 million in 2022. (source)
- Mexico led the region with $114.8 million earned. (source)
- Followed by Brazil at $87.3 million and Argentina at $6.2 million. (source)
- Action and adventure films emerged as the top-grossing genre in Latin America. (source)
- “Fantastic Beasts: The Secrets of Dumbledore” and “The Batman” were among the most popular films in both Mexico and Brazil in 2022. (source)
Africa’s Thriving Film Industry (Film Industry Statistics)
- Africa boasts a prolific film production scene, averaging around 5,500 movies produced between November 2020 and May 2021. (source)
- East Africa and West Africa lead the way, contributing 1,500 and 3,400 films respectively. (source)
Box Office Dominance (Film Industry Statistics)
- Nigeria stands out as the West African box office leader, generating a staggering 96.5% and 97% of the regional revenue in 2022 and 2021 respectively. (source)
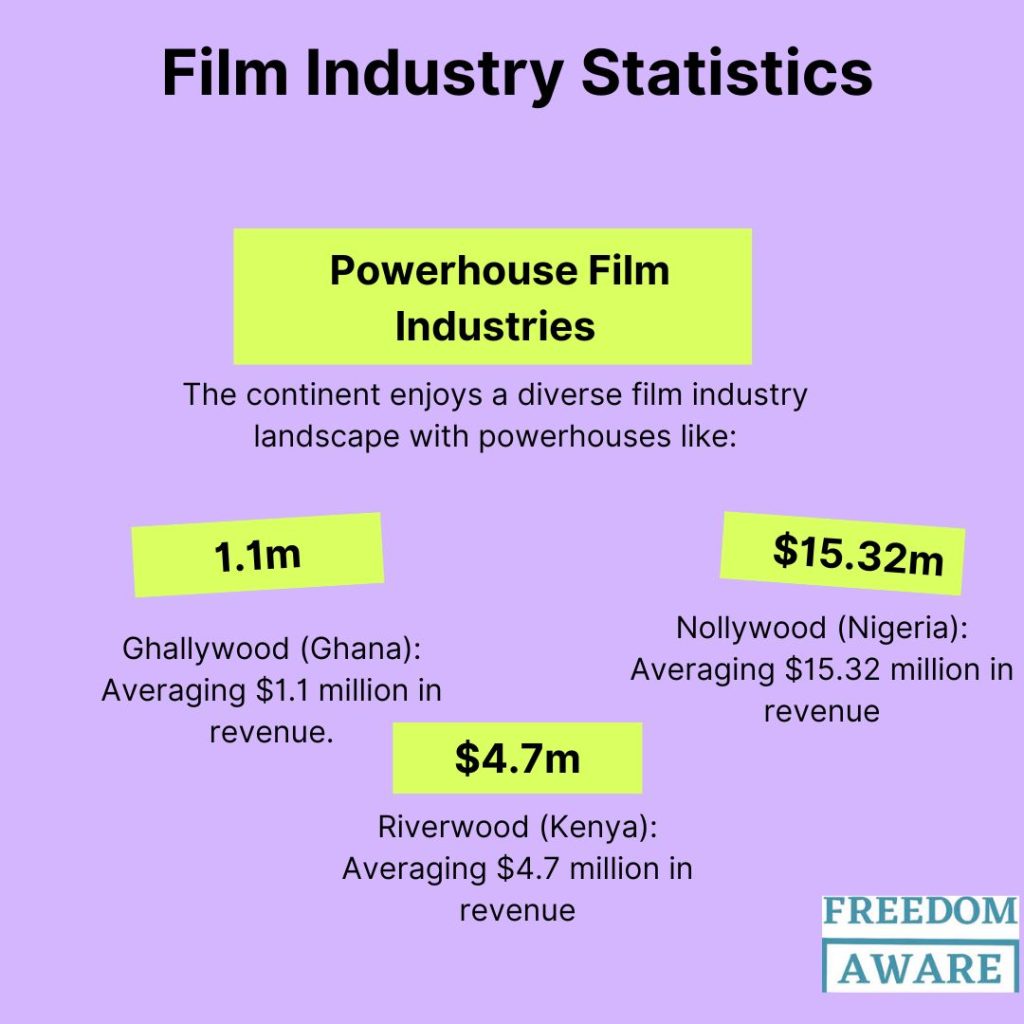
Powerhouse Film Industries (Film Industry Statistics)
The continent enjoys a diverse film industry landscape with powerhouses like:
- Nollywood (Nigeria): Averaging $15.32 million in revenue. (source)
- Riverwood (Kenya): Averaging $4.7 million in revenue. (source)
- Ghallywood (Ghana): Averaging $1.1 million in revenue. (source)
- Swahiliwood (Swahili): Averaging $0.7 million in revenue. (source)
Market Share and Content (Film Industry Statistics)
- Nollywood holds a significant market share in Ghana and Nigeria, contributing 30% of the total film industry revenue compared to Hollywood’s 69%. (source)
- In 2021, Nollywood’s dominance is further reflected by the number of films released: 103 Nollywood titles. (source)
- In 2021, several films were released;65 Hollywood and 6 Ghallywood films across Liberia, Ghana, and Nigeria, compared to Nollywood. (source)
- Nollywood movies also capture the largest share of revenue within these countries, accounting for 45%. (source)
Advertising Revenue Growth (Nigeria) (Film Industry Statistics)
- While data is limited to Nigeria, the advertising revenue generated by the cinema sector witnessed an increase between 2014 and 2018. (source)
- In 2018, advertising revenue reached $700,000, reflecting a 17% rise from the previous year’s $600,000. (source)
Public Perception of AI in Film (Film Industry Statistics)
- A July 2023 survey revealed mixed opinions on AI’s role in filmmaking. (source)
- While a significant portion of respondents supported its use for special effects (42%) and voice acting for animated characters (38%) (source)
- A sizeable number remained undecided (25% men, 37% women). (source)
- Only a minority viewed AI’s impact as somewhat positive (22% of men, 14% of women). (source)
AI Adoption by Streaming Giants (Film Industry Statistics)
- Major streaming platforms like Netflix and Amazon are actively leveraging AI and big data to personalize content recommendations for their subscribers. By analyzing viewing habits and preferences, these companies can curate content tailored to individual users, leading to more engaging and personalized viewing experiences. (source)
Early Examples of AI in Filmmaking (Film Industry Statistics)
- In 2016, 20th Century Fox partnered with IBM Watson to utilize AI technology in creating a “perfect” movie trailer for the sci-fi horror film “Morgan.” This example showcases the potential of AI for film marketing. (source)
Cinema Market Poised for Growth (Film Industry Statistics)
- The global cinema market is expected to reach $79.22 billion in revenue by 2024. (source)
- However, The global cinema market is projected to continue growing at a CAGR of 5.68% until 2029, reaching a market size of $104.40 billion. (source)
- The audience is also expected to expand, with an estimated 1.9 billion viewers by 2029. (source)
- This translates to a user penetration rate of 21.6% in 2024, rising to 24.1% by 2029. (source)
- On average, each viewer is expected to spend $47.34 at the cinema in 2024. (source)
- The United States stands out as the leading revenue generator, contributing an estimated $20.98 billion in 2024. (source)
- Hollywood Leads, But Others Spark Interest: While the United States remains the top contender in terms of audience engagement, other film industries like Bollywood generate significant interest as well, prompting discussion and conversation. (source)
- Surprises in Engagement Levels: Established players like Italy (thriving with only a 1% gap compared to Bollywood) and Japan (alongside South Korea) show surprisingly strong engagement compared to France and Nigeria, despite the latter’s successful Nollywood scene. (source)
- China’s Emerging Presence: China currently records a lower level of engagement (1.1%), suggesting a film industry not yet widely recognized as thriving on a global scale. (source)
- North America Leads the Way: North America demonstrates the most significant difference, with actual engagement (nearly 2,500,000) almost doubling the expected level (just under 1,250,000). (source)
- Europe and Latin America Underperform: Conversely, Europe and Latin America both show lower actual engagement figures compared to their expected levels. (source)
- Oceania Shows Consistency: Oceania is the only region where actual engagement aligns closely with expectations, with slightly higher actual numbers. (source)
Polly’s Data: Age and Engagement (Film Industry Statistics)
Examining engagement by age group reveals intriguing patterns:
- Senior Audience Leads: The over-65 age group demonstrates the highest engagement, exceeding expected levels (around 500,000) by a significant margin (actual engagement near 900,000). This might be due to factors like retirement, leading to more time for film consumption and online discussions. (source)
- Engagement Dips in Midlife: The 55-64 age group shows higher engagement than expected, while the 45-54 group aligns closely with expectations. (source)
- Younger Age Groups: A Disconnect: Interestingly, younger adults (35-44 and 25-34) have a lower actual engagement compared to their higher expected levels. This is particularly striking for the 25-34 age group. (source)
- Social Media Paradox: The under-25 group falls slightly short of expected engagement. Notably, this demographic boasts the highest number of social media users, suggesting a disconnect between social media activity and online film industry discussions. (source)
- Despite a positive year for UK and Irish cinema overall in 2023, British Film Institute (BFI) statistics reveal a decline in revenue and market share for UK-qualifying independent films compared to 2022. (source)
The global film industry thrives on constant evolution. Fueled by technological advancements, audience preferences, and the rise of streaming giants, this dynamic landscape offers a glimpse into the future of entertainment. By analyzing trends and consumer demands, as revealed by these film industry statistics, movie producers can navigate this ever-changing environment and secure their place within it.
FAQs (Film Industry Statistics)
- Dominant Film Producers:
- By volume: India boasts the title of the world’s largest film producer.
- By market share: The United States (Hollywood) remains the industry leader.
- Powerhouses in Europe: Italy, France, and Germany consistently rank among Europe’s top film-producing countries.
- African Cinema Leader: Nigeria’s Nollywood film industry stands out as the largest in Africa.
- Global Film Industry Size: The global film industry was valued at an estimated $90.93 billion in 2021 and is projected to continue growing.