Category: Marketing

  • The State of Franchising: 97 Surprising Franchise Statistics You Need to Know

    The State of Franchising: 97 Surprising Franchise Statistics You Need to Know

    Franchise Statistics

    Are you thinking about franchising? Dive into the latest franchise statistics;

    Whether you’re starting out or expanding, it’s crucial to understand the current trends. Franchising is a booming industry, worth nearly $900 billion globally in 2024. But there’s a lot more to learn. From the U.S. to international markets. 

    Let’s explore the latest franchise statistics and see what the future holds.

    Franchise Statistics (Editor’s Pick)

    • There are over 773,000 franchises in the United States alone, employing over 8.4 million people.
    • Franchise output is projected to increase by 4.1% from its 2023 value of $858.5 billion, reaching $893.9 billion in 2024.
    • New franchises have a success rate that is 6.3% higher than that of independent companies after one year.
    • In 2023, roughly 8.66 million workers were employed by U.S. franchise establishments.
    • The global franchise market is projected to grow by $1.63 trillion between 2022 and 2027, with an annual growth rate of 9.58%.
    • 70% of franchises have invested in digital marketing, and 60% have implemented online ordering and delivery systems.
    • 80% of franchisees aim to increase revenue, and 70% aim to expand their business.
    • 80% of franchisees struggle to find and retain top talent, and 70% offer competitive salaries and benefits to attract employees.
    • 70% of franchisees value ongoing support from their franchisor, and 60% expect regular communication and training.

    General Franchise Statistics

    1. The global franchise market is projected to expand by $1.63 trillion between 2022 and 2027, with an annual growth rate of 9.58%. (Source)
    2. The average franchise owner is 44 years old. (Source)
    Franchise Statistics
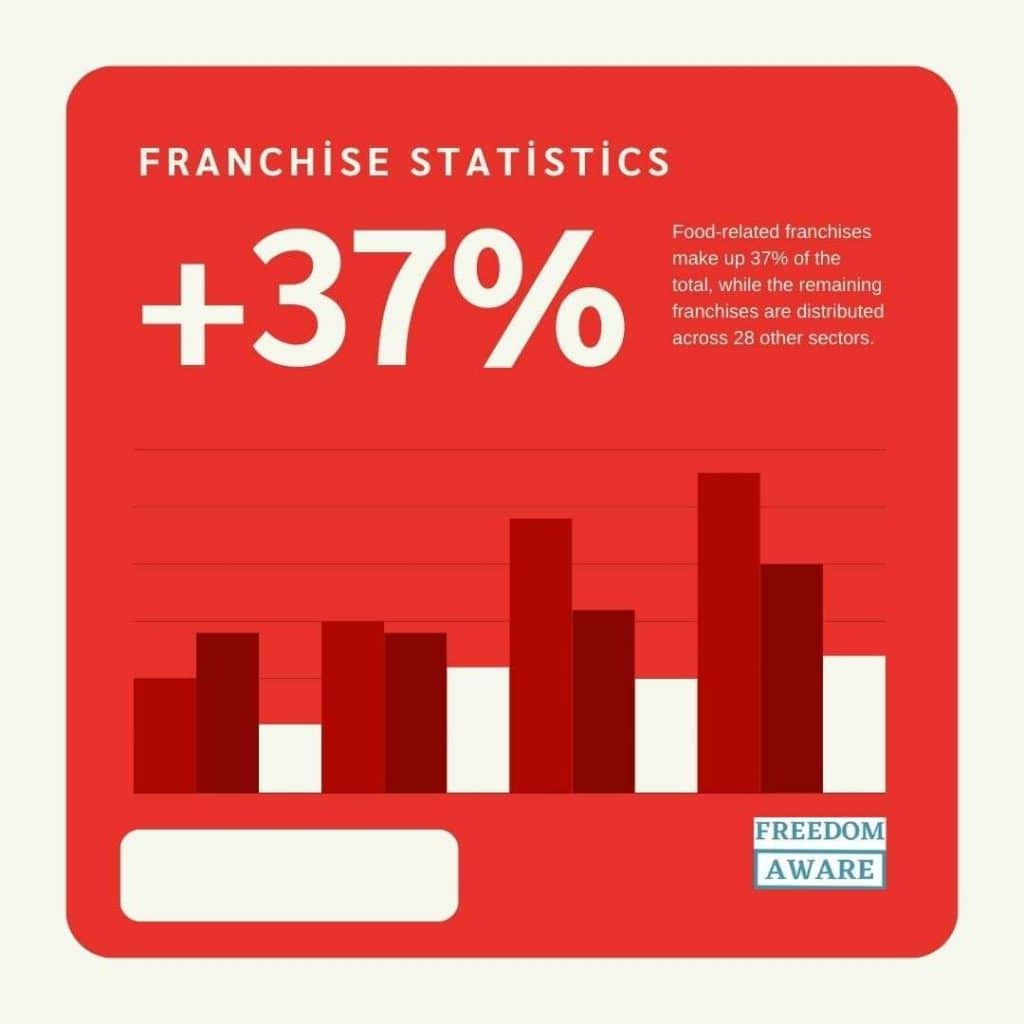
    1. Food-related franchises make up 37% of the total, while the remaining franchises are distributed across 28 other sectors. (Source)
    2. Most franchise owners are White (67.2%), followed by Hispanic or Latino (15.4%), Asian (6.4%), and Black or African American (6.2%). (Source)
    3. New franchises have a success rate that is 6.3% higher than that of independent companies after one year. (Source)
    4. In 2024, the business services sector is forecast to see a 1.8% increase in franchise locations, growing to 104,000 establishments. This growth will lead to an additional 32,000 jobs and a 3.8% increase in industry output, contributing $107.6 billion to the economy. (Source)
    5. As of 2023, approximately 806,270 franchise establishments were operating in the United States. (Source)
    6. A substantial 86% of franchise owners reported experiencing the negative effects of rising costs on their businesses, although this figure is slightly lower than the previous year’s. (Source)
    7. Franchise output is anticipated to increase by 4.1% from its 2023 value of $858.5 billion, reaching $893.9 billion in 2024. (Source)
    8. The GDP of franchises is forecast to continue its upward trajectory, growing by 4.3% to $545.8 billion in 2024. (Source)
    9. There are over 3,000 distinct franchise brands available. (Source)
    10. According to FRANdata, there were approximately 774,965 franchise establishments in 2021, with a growth rate of 2.8%, exceeding the historical average for most years. (Source)
    11. The total number of franchised establishments is projected to increase by 1.9% to 822,000 units. (Source)
    12. The franchise retail output sector is projected to increase by 3.1% in 2024, adding $4.1 billion to the industry. Additionally, franchise retail establishments are expected to grow by 3,500 units, creating over 40,000 new jobs. (Source)
    13. The lodging industry is forecast to experience modest growth in 2024, with a 0.9% increase in franchises to 36,000, a 4.5% rise in output to $97.2 billion, and a corresponding boost in employment to 723,000 jobs. (Source)
    14. McDonald’s generated $15.4 billion in revenue from its franchised restaurants worldwide in 2023. The majority of this revenue, $9.84 billion, came from rent, while $5.53 billion was derived from royalties. (Source)
    15. The real estate, healthcare, residential, business services, automotive, and retail sectors collectively account for more than half of the franchise industry. (Source)
    16. The commercial and residential services sector is anticipated to grow in 2024. The number of franchise businesses in this sector will increase by 2%, reaching a total of 81,000. Jobs will also rise by 2%, to 315,000. (Source)
    17. The sector’s output is expected to grow by 4.6%, valued at $59.8 billion, driven by a recovering housing market. (Source)
    18. Franchise locations experienced a 2.6% decline in 2020. (Source)

    Franchise Workforce Data (Franchise Statistics)

    1. U.S. business services franchise employment experienced steady growth from 2013 to 2019, reaching 650,000. However, it declined to 588,000 in 2020 due to the pandemic and slowly recovered in 2023, adding an additional 34,000 jobs. (Source)
    Franchise Statistics
    1. Franchise employment is projected to grow by 2.6%, adding over 221,000 jobs to a total of 8.9 million employees. This is a slight decrease from the 244,000 jobs added in 2023. Service-based industries, such as business and personal services, are expected to drive employment growth in 2024, with a projected growth rate of 5.1%. (Source)
    2. Franchise businesses employ over 8.2 million Americans, and in 2021, franchises contributed nearly USD 788 billion to the economy. (Source)
    3. The full-service restaurant sector was projected to see a 2.5% increase in franchise locations in 2022, reaching 32,819 establishments and supporting a workforce of approximately 1.1 million employees. (Source)
    4. The IFA estimated that franchise employment would increase by 8.8% in 2021 to 8.2 million, a net gain of 660,300 jobs from 2020. (Source)
    5. Employment in franchising is projected to increase by 2.6% in 2024 to a total of 8,886,555 employees in the U.S. (Source)
    6. Franchises create 2.3 times more jobs than non-franchise businesses of similar size. Furthermore, franchises generate 1.8 times more taxable revenue than independent businesses. (Source)
    7. Employees of franchise businesses earn up to 3.4% more and have better access to health insurance (65%) and paid leave (76%). (Source)
    8. The U.S. Census Bureau reports that franchise businesses recently made up over 11% of all businesses with paid employees across 295 industries. (Source)
    9. A significant 80% of respondents indicated struggling with staffing shortages, with unfilled job vacancies impacting their franchises. (Source)
    10. In 2023, U.S. franchise establishments employed roughly 8.66 million workers. (Source)
    11. According to ADP’s National Franchise Report, the U.S. gained an average of 46,400 franchise jobs per month in 2021. (Source)
    12. Franchise employment declined by 11.2% to 7.5 million in 2020, losing approximately 940,000 jobs due to limited capacity and revenue deterioration. (Source)
    13. In 2022, 85% of U.S. franchised businesses increased employee wages, and 60% planned to continue this trend in 2023. Additionally, 43% of franchises enhanced employee benefits in 2022, with 42% intending to do the same in 2023. (Source)
    14. Labor costs and quality remain a primary challenge for 34% of franchise businesses, down from 47% in 2023. (Source)

    U.S. Franchise Data (Franchise Statistics)

    1. There are over 712,274 franchise owners employed in the U.S. at present. (Source)
    2. The U.S. commercial and residential services franchise industry remained unaffected by the pandemic, exhibiting steady output growth since 2013, reaching $57 billion in 2023. (Source)
    Franchise Statistics
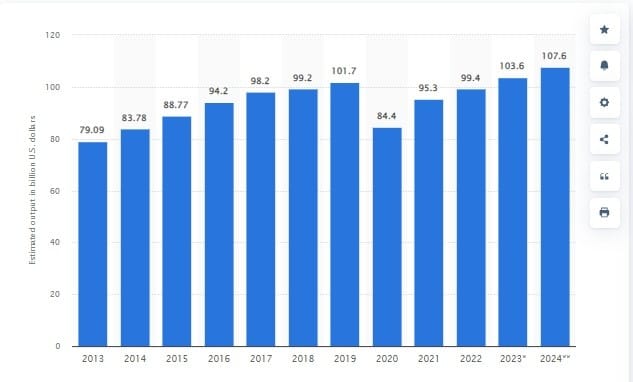
    1. The U.S. business services franchise industry recovered to pre-pandemic levels in 2023, generating $104 billion. The industry grew 30% from 2013 to 2019, peaking at $106 billion, but declined to $91.3 billion in 2020 due to the pandemic. (Source)
    2. The food industry was disproportionately impacted by inflation, with three of the top five industries most affected being food-related. (Source)
    3. McDonald’s outpaced all other U.S. franchises in global sales in 2022, reaching $118 billion, compared to 7-Eleven’s $93.5 billion. (Source)
    4. In 2019, over half (54%) of all franchised businesses in the U.S. were owned by multi-unit franchise operators. (Source)
    5. According to the International Franchise Association, the franchise industry experienced substantial growth in 2021, opening over 21,000 new locations and creating more than 660,000 additional employment opportunities across the United States. (Source)
    6. The Southeast region leads the nation in franchised businesses, accounting for 30% of the total U.S. franchised businesses, employing 2.6 million people, and generating a staggering $268.2 billion in revenue. (Source)
    7. The Southeast region is projected to see a 3.5% increase in franchise establishments, while the Southwest region is anticipated to experience a 3% growth. (Source)
    8. In 2023, there were approximately 195,507 fast-food franchise locations in the U.S., encompassing various types of quick-service eateries, including burger joints, pizza places, and sandwich shops. (Source)
    9. Over 50 million Americans consume fast food daily. That represents 37% of the population. (Source)
    10. The personal services franchise industry rebounded to pre-pandemic levels in 2023, generating $42 billion, and is projected to reach $46 billion in 2024. After steady growth from 2013 to 2019, the industry suffered a 33% decline in 2020 due to the pandemic, dropping to $26 billion. (Source)
    11. Franchise businesses contributed US $670 billion to the U.S. economy in 2020, representing 3% of the total nominal GDP. (Source)
    12. 83% of voters in a survey have a favorable view of locally owned franchise small businesses in the United States. Additionally, more than half of voters (57%) use franchise businesses regularly. (Source)
    13. 64% of voters believe locally-owned businesses are more likely to support the local community. (Source)
    14. Nearly all (90%) franchise business units increased their prices to offset rising costs and maintain profitability. (Source)
    15. The initial investment to open a Kentucky Fried Chicken (KFC) franchise in the U.S. was approximately $3.7 million, with $1.9 million allocated for building and site costs and $100,000 for permits, licenses, and security deposits. (Source)
    16. The initial investment to open a Burger King franchise was approximately $4,520,900, with $1.6 million allocated for improvements and construction, and $50,000 for the franchise fee. (Source)
    Franchise statistics
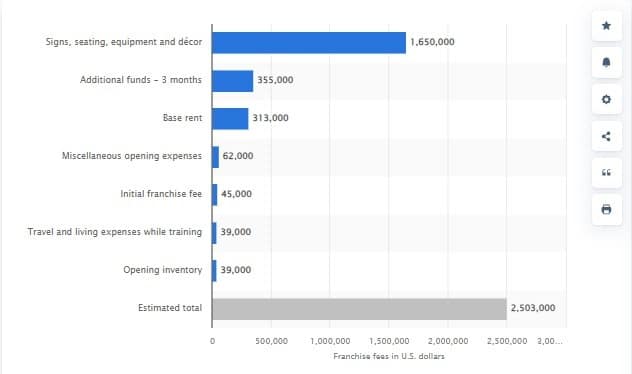
    1. The initial investment to open a McDonald’s franchise was estimated at $2,503,000, with $1,650,000 allocated for signs, seating, and decor. (Source)
    2. The franchise output was forecast to increase by 5% in 2022 to USD 76.4 billion. (Source)
    3. The initial investment to open a Taco Bell franchise in 2023 was estimated at $3.37 million, including $1.4 million for real property and $45,000 for the franchise fee. (Source)
    4. The initial investment to open a Dunkin’ Donuts franchise in 2023 was estimated at $1.81 million, not including real property. Building costs accounted for $600,000, and the franchise fee was $90,000. (Source)
    5. In 2023, the economic output of franchise establishments was valued at approximately USD 859 billion. In 2020, the sector experienced losses due to the COVID-19 pandemic, with an estimated economic output of approximately USD 677 billion, compared to USD 794 billion in 2019. (Source)
    6. One in twelve Americans in the private sector works in a franchise business or has a job because of franchising. (Source)
    7. One nickel of every dollar of economic output in the private sector is attributable to franchising. (Source)
    8. A survey found that 78% of voters believe franchise brands offer a consistent experience. (Source)
    9. A survey found that 75% of voters believe franchise brands empower local entrepreneurs. (Source)
    Franchise Statistics
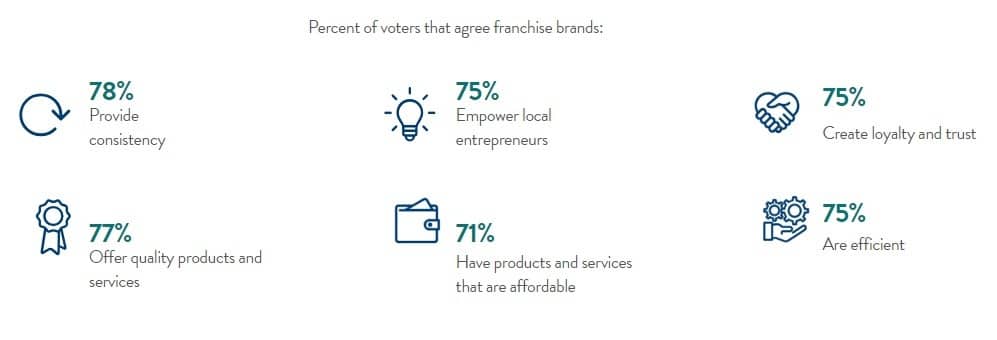
    1. The same survey states that 75% of voters agreed that franchises create trust and loyalty. (Source)
    2. Franchise market growth in the Southeast and Southwest will outpace other regions in the U.S. in 2024, as the top 10 states for franchise growth are Texas, Florida, Georgia, North Carolina, South Carolina, Tennessee, Maryland, Arizona, Colorado, and Virginia. In contrast, California and Washington are expected to see a decline in franchise growth, dropping by 4.2% and 2.3%, respectively. (Source)
    3. The proportion of U.S. businesses operating as franchises declined by 9.4% between 2014 and 2020, with some metropolitan areas experiencing declines as high as 63.5%. (Source)

    Franchise Data for Other Regions (Franchise Statistics)

    Canada

    1. Canada’s franchising GDP expanded from $100 billion in 2019 to $120 billion in 2024. As the 12th largest sector in the country and the second largest globally, Canada’s franchise industry contributes significantly to the nation’s economy. (Source)
    2. Canada’s franchise industry ranks second globally, following only the United States. (Source)
    3. In Canada, there are approximately 76,000 franchised outlets operated by between 1,200 and 1,300 franchise companies. (Source)
    4. Ontario dominates the Canadian franchising landscape, with 56% of franchise companies headquartered there, primarily in the Greater Toronto Area, and 65% of all franchise outlets operating within the province. (Source)
    Franchise Statistics
    1. Around 4,300 new franchise outlets open in Canada each year. (Source)
    2. Franchising employs over 1.5 million Canadians, representing one in every ten workers in the country. (Source)

    Australia

    1. Market share concentration in the Australian franchising industry is low, with the top four companies accounting for 32% of market revenue in 2024. (Source)
    2. Australia’s franchise sector plays a significant role in the country’s economy, with 95% of franchisors and almost all franchisees being small businesses with fewer than 20 employees. (Source)
    3. The non-food retail sector is the most sought-after for franchising in Australia, comprising over 25% of all franchise systems. (Source)
    4. Australia boasts 1,344 franchise systems with approximately 98,000 units, generating $184 billion in revenue and employing over 598,000 people. (Source)
    5. 60% of franchisors in Australia have been involved in franchising for over 10 years. (Source)
    6. 92% of franchise systems in Australia are locally owned and operated, with the majority being homegrown Australian businesses that have been franchising for an average of nine years. (Source)
    7. 28% of Australian franchise systems have expanded to international levels. (Source)
    8. Lockdowns, trading restrictions, and social distancing measures since March 2020 have presented numerous challenges for franchised businesses in Australia. (Source)
    9. The Franchise Council of Australia represents the country’s franchise industry, which comprises over 1,200 franchise networks, more than 94,000 individual outlets, and employs over 565,500 people, contributing a significant $174 billion to the national economy. (Source)
    10. In Australia, almost 300 franchise systems have a history of over 20 years, and 30% of franchisees have been involved for 5-10 years, with 40% having been in business for over 10 years. (Source)
    11. Women play a substantial role in Australia’s franchise industry, owning approximately 34% of franchises and holding numerous leadership positions, contributing significantly to the economy with an annual value of $6 million. (Source)
    12. In Australia, women-owned franchises drive growth, outperforming the overall sector with an impressive 7.8% average annual growth rate, significantly higher than the industry average. (Source)
    13. Australia’s franchise industry contracted to $185.1 billion in 2024, experiencing a 2.4% annual decline over 5 years. (Source)
    14. Franchised businesses in Australia are heavily concentrated in New South Wales, Victoria, and Queensland. (Source)

    Africa

    1. Franchising in South Africa generated an estimated R999 billion in turnover for 2023. This represents a 36% increase from 2019, accounting for 15% of South Africa’s GDP. (Source)
    Franchise Statistics
    1. South Africa has over 68,463 franchisees (a 43% increase from 2019) and 727 franchise systems. (Source)
    2. Based on volume, fast-food and Quick Service Restaurant operators are the top franchises in Nigeria, accounting for 45% of the franchises. (Source)
    3. The franchising finance market in Africa is valued at $93.9 billion, with available funding amounting to $37.6 billion, resulting in a financing gap of $7.51 billion. (Source)

    Others

    1. UK fast-food franchise industry revenue is projected to grow from £12.1 billion to £12.7 billion by 2024-25, with a 3.8% increase in the final year. (Source)
    2. France boasts over 1,965 franchise networks, 79,134 sales locations, 795,441 employees, and a total turnover of €68.8 billion. (Source)
    3. China boasts over 4,000 franchise brands and 500,000 franchise outlets. (Source)
    4. The typical initial investment for a franchise in Singapore ranges from S$30,000 to S$150,000. (Source)
    5. South Korea has the highest number of franchise brands, with over 4,800 concepts. India closely follows in second place, with nearly 3,922 franchise systems. Taiwan ranks third, boasting over 3,300 franchise brands. (Source)
    6. In 2021, South Korea’s franchise sector employed 834,290 individuals, with 186,776 working in convenience stores. (Source)
    7. South Korea’s franchise industry grew by 10.6% in 2021, with 259,662 stores driven partly by increased demand for foreign food. The combined revenue of franchise stores rose by 14.2% to 84.8 trillion won (or USD 66.5 billion). (Source)
    8. As a subsidiary of Yum! Brands, KFC expanded its global footprint to 29.9 thousand restaurants in 2023, an increase from the prior year’s 27.7 thousand. (Source)

    Conclusion (Franchise Statistics)

    The franchise industry is a dynamic and growing sector, offering entrepreneurs and investors a proven business model and support to succeed. By understanding the latest franchise statistics and trends, you can make informed decisions and stay ahead of the competition. Whether you’re considering investing in a franchise or looking to expand your existing business through franchising, these statistics provide valuable insights into the state of the industry.

    Franchise Statistics
  • 67 Latest Short-Form Video Statistics You Should Know 2025: Unlocking the Power of Bite-Sized Content

    67 Latest Short-Form Video Statistics You Should Know 2025: Unlocking the Power of Bite-Sized Content

    Short-Form Video Statistics

    Discover the latest short-form video statistics;

    In today’s digital landscape, short-form videos have become essential to any successful marketing strategy. With the rise of social media platforms like TikTok, Instagram Reels, and YouTube Shorts, it’s no surprise that short-form video statistics are on the rise.

    Videos are a proven sales driver. 87% of marketers report a direct increase in sales after using video, proving their power to engage and convert. 

    In this article, we’ll delve into the world of short-form video statistics and explore the benefits, and trends.

    Top Short-Form Video Statistics (Editor’s Pick)

    • 90% of internet traffic will come from short-form videos by 2024.
    • 82% of internet traffic will be video by 2024.
    • Short-form videos are 2.5 times more engaging than long-form videos.
    • The average user spends 88% more time on a website with a video.
    • 72% of people prefer to watch a short-form video to learn about a product or service.
    • 73% of consumers prefer to watch a short-form video to learn about a product or service.
    • Short-form videos are 3 times more likely to be shared than long-form videos.
    • The average short-form video is 3 minutes and 23 seconds long.
    • In 2024, there will be an estimated 1.6 billion people who use short-form videos to communicate.
    • Short-form video is expected to rise significantly in 2024.
    • 86% of businesses now use video as part of their marketing tool.
    • In 2023, Direct-to-Consumer (D2C) brands spent about 231% more on TikTok ads than the previous year.

    General Short-Form Video Statistics

    1. Spending on short-form video ads has grown by 20 times in just five years, from $4.6 billion in 2018 to more than $88 billion in 2023. It’s expected to reach $99.4 billion in 2024. (Source)
    2. Spending on short-form video ads will grow by an average of $11 billion each year, reaching $145.8 billion in 2028. This is a huge increase of 65% in five years. (Source)
    3. The average amount of money each person spends on short-form videos will also increase significantly, from $16.5 in 2023 to $23.6 by 2028. (Source)
    4. By 2028, short-form videos are expected to make up 60% of all money spent on digital video advertising. (Source)
    Short-Form Video Statistics
    1. The global market for online video platforms is expected to reach $57.2 billion by 2033. It’s growing at a steady rate of 18.7% each year from 2024 to 2033. In 2023, it was likely worth $10.3 billion. (Source)
    2. The first two minutes of a video are the most important for getting people to watch it. After two minutes, people are less likely to keep watching. However, if a longer video can keep people interested for more than 6 minutes, they are more likely to watch it all. (Source)
    3. Nearly 50% of the videos made in 2023 were shorter than three minutes. (Source)
    4. A majority of marketers (64%) lean towards short-form marketing videos that fall within the 20- to 60-second range. (Source)
    5. In a survey, 85% of people in the United States who use the internet watched videos online on any kind of device. (Source)
    6. Consumers find short-form videos 2.5 times more compelling than long-form content. Social media platforms like TikTok, Instagram, and YouTube have experienced explosive growth. TikTok users often convert to customers after discovering brands on the platform. (Source)
    7. Short videos, under 90 seconds, hold the attention of half their audience. (Source)
    8. Video marketing is a proven success for most, with 79% of marketers reporting positive results. However, individual experiences can vary. (Source)
    Short-Form Video Statistics
    1. The market for short video platforms was worth $1.52 billion in 2022 and is expected to grow by 10.2% each year until 2030. By 2030, it could be worth $3.24 billion. (Source)
    2. In December 2022, 75% of marketers’ biggest clients put video ads on TikTok. 70% put them on Instagram Reels. However, about 13% of marketers didn’t use online ads on short video platforms. (Source)
    3. In a survey in June 2022, 39% of marketers said short-form videos gave them the most return for their money. (Source)
    4. Short-form video platforms in India are expected to earn $10 billion by 2030. (Source)
    5. In 2024, 53% of marketers plan to spend more money on short-form content, and 38% will spend the same amount. (Source)
    6. Viewers retain 95% of a message while watching it in a video, compared to 10% when reading it in text. (Source)
    Short-Form Video Statistics
    1. In 2022, Americans watched more videos online than they did on TV. By 2027, people are expected to watch almost 3 hours and 30 minutes of streaming video each day. (Source)
    2. 87% of marketers say videos have helped their websites get more traffic. 95% say that videos have helped people understand their products better. 80% say that videos have helped them sell more products. (Source)
    3. In 2024 67% of people who use social media to market their products plan to spend more money on short-form videos than other types of content. (Source)
    4. Nearly half of all videos made in 2023, were under three minutes long. (Source)
    5. In 2024 short-form videos will make up 90% of all internet traffic. (Source)
    6. Every second of a video matters. People will watch at least half of a video on average if it’s five minutes or shorter. (Source)
    7. After five minutes, people are less likely to watch a video. Videos that are between 5 and 30 minutes long usually get about 38% of people to watch them. (Source)
    8. Longer videos that are more than 30 minutes long usually get fewer views. But they can attract good potential customers. (Source)
    9. Videos that are between 30 and 60 minutes long usually get about 26% of people to watch them. (Source)
    10. The average amount of time people spent watching online videos each day increased to 100 minutes in 2021. In 2019, it was 84 minutes. (Source)
    11. People watch an average of 16 hours of online video each week. This is 52% more than they did two years ago. (Source)
    12. Instagram users spend about 53 minutes at a time watching short-form videos. TikTok users spend about 45 minutes at a time. (Source)
    13. More than 75% of American adults spend up to two hours a day watching short-form videos. (Source)
    14. Marketers mostly use view count (44%), watch time (43%), and engagement (41%) to measure how well their videos do. (Source)
    15. Many marketers (39%) say that short-form videos give them the most return for their money. (Source)
    Short-Form Video Statistics
    1. 33% of people who use social media to market their products plan to spend more money on short-form videos. (Source)
    2. The number of people using mobile phones worldwide grew from 5.1 billion in 2018 to around 5.7 billion by 2023. (Source)
    3. 72% of people use videos to find out about products or services. (Source)
    4. About 41% of marketers say that people usually watch between 61% and 80% of short-form videos. (Source)
    5. 85% of businesses use videos for marketing. This is a little lower than in 2019, when 87% of businesses used videos. (Source)
    6. 86% of people want to see more brand videos. 36% want educational videos, and 14% want videos that show products. (Source)
    7. Videos were the most popular type of content on short-form video platforms, making up nearly 60% of all revenue. People like videos because they’re easy to watch, remember, and reach specific audiences. (Source)
    8. Almost two-thirds of the world’s people can now go online. By last year, there were over five billion internet users, about 66% of the global population. This is up from 51% in 2018. (Source)
    9. Most people like to watch educational videos that are 3 to 6 minutes long. Less than 10% of people want to watch videos that are longer than 20 minutes. (Source)
    10. Videos that show people interacting positively can get 40% more views. If the message of a video is clear within the first three seconds, it can get 13% more attention. (Source)

    Short Form Video Platform (Short-Form Video Statistics)

    1. TikTok made short-form videos popular. Videos on TikTok can be a few seconds long or up to 10 minutes. After TikTok, Instagram Reels became popular. Reels can be 15 to 90 seconds long. (Source)
    2. After Instagram Reels, Instagram Stories were popular. Stories disappear after 24 hours but can be saved as highlights. Facebook Stories and YouTube Shorts started in 2021 and are usually 60 seconds long. (Source)
    3. Instagram Reels have become a very important feature, taking over Instagram marketing and giving brands a new way to express themselves and connect creatively with their audience. (Source)
    Short-Form Video Statistics
    1. In the first three months of 2024, TikTok videos averaged 18,173 views. This made it the best platform for social and short-form videos. Instagram was second, with Reels getting 16,152 views on average. Facebook’s short-form videos, also called Reels, were third. (Source)
    2. 58% of marketers use short-form videos like TikTok, Instagram Reels, and YouTube Shorts. (Source)
    3. On Instagram, people spend about 20% of their time watching Reels. YouTube Shorts had 5 billion people using them every month in June 2022. (Source)
    4. YouTube is the best place for marketers to use videos, followed by LinkedIn. YouTube is 87% effective, and LinkedIn is 85% effective. (Source)
    5. YouTube Shorts started in late 2020 and has grown a lot. It has been watched more than 5 trillion times. (Source)
    6. In November 2021, most people said they liked watching short-form videos on YouTube. About 78% watched on YouTube, 60% on Facebook, and 54% on TikTok. (Source)
    7. In South Korea, most people like watching short-form videos on YouTube. About 77% use YouTube, 51.7% use Instagram, and 35% use TikTok. (Source)
    8. In the United States, TikTok is the most popular place to watch short-form videos. About 40% of people use TikTok, 23% use YouTube Shorts, and 3% use Instagram Reels. (Source)
    9. In 2022, Instagram Reels got more than 3.7 billion views in the United Kingdom. TikTok got 2 billion views, and YouTube Shorts got 116 million likes. (Source)
    10. In Vietnam, most people in Generation Z said they like watching short videos on TikTok. About 65% use TikTok, and 18% use Facebook. (Source)

    Short-Form Video Statistics By Country

    1. In the United States, spending on short-form video ads is expected to reach $38.8 billion by 2024. It’s expected to grow by 12.54% each year until 2028, reaching $62.2 billion. (Source)
    2. In the United Kingdom, spending on short-form video ads is expected to reach $4.6 billion in 2024. It’s expected to grow by 7.82% each year until 2028, reaching $6.2 billion. (Source)
    3. North America was the biggest market for short-form videos, accounting for almost 38% of the total revenue. (Source)
    4. In the United States, half of all people who use the internet watch videos online every day. In Mexico, more than half of internet users do the same. (Source)
    5. In Canada, spending on short-form video ads is expected to reach $1,545 million in 2024. It’s expected to grow by 10.67% each year until 2028, reaching $2,318 million. (Source)
    Short-Form Video Statistics
    1. The market for short-form videos in Asia Pacific was worth $317.3 million in 2020. It’s expected to grow by 12.1% each year from 2020 to 2030. (Source)
    2. In Southeast Asia, spending on short-form video ads is expected to reach $1,073 million in 2024. It’s expected to grow by 10.12% each year until 2028, reaching $1,578 million. (Source)
    3. In China, money made from short video ads was almost 134 billion yuan in 2020. It’s expected to keep growing quickly. Douyin and Kuaishou are two of the most popular short video platforms in China. (Source)
    4. In France, spending on short-form video ads is expected to reach $1,199 million in 2024. It’s expected to grow by 10.32% each year until 2028, reaching $1,776 million. (Source)
    5. In Australia, spending on short-form video ads is expected to reach $1,474 million in 2024. It’s expected to grow by 10.51% each year until 2028, reaching $2,198 million. (Source)
    6. In Africa, spending on short-form video ads is expected to reach $431.8 million in 2024. It’s expected to grow by 10.23% each year until 2028, reaching $637.5 million. (Source)

    Some Short-Form Video Trends  in 2024 (Short-Form Video Statistics)

    1. Brand Challenge Videos

    Short-form videos first became popular with viral content about dancing, songs, and sounds. 

    Now, brands can make their own sounds, filters, and challenges go viral. According to a HubSpot report on social media trends, 20% of marketers used branded challenges, and 42% said they did better than expected. Marketers also think they’re one of the most effective social media trends of 2024.

    They’re making these challenges popular by using interesting hashtags (#) on social media.

    These brands encourage people to join in and spread the word by offering challenges that are usually fun and easy to do.

    1. Behind the Scenes Videos

    Customers are curious and want to see how businesses work from the inside. This is a good way to build trust. Companies are using this idea to their advantage.

    For example, they could make a video that shows how a product was made or how the company works on a normal day.

    You’ll get extra points if the videos are natural and fun to watch.

    1. Soundless Videos

    Many videos are now designed to be watched and understood without sound.

    These short videos have subtitles so people can understand them without listening to the sound. Not everyone wants to listen to sound when they watch videos.

    1. More Educational Videos

    In 2024, brands will likely focus on educational content in their short-form videos. How-to videos, DIY videos, and videos that explain things.

    A Hubspot report on social media trends found that 32% of marketers surveyed say they currently use educational content, and 57% of those who do say it’s one of the most effective types of content.

    Educational videos are great added-value content because they help audiences in their day-to-day lives. Brands that focus on education in their marketing strategy can improve lead generation and build stronger brand loyalty.

    Similarly, explainer videos target users who are ready to make a decision. When done well, they can turn these people into customers.

    Conclusion (Short-Form Video Statistics)

    Short-form videos are powerful marketing tools that boost engagement, increase brand awareness, and drive sales. As the digital landscape continues to evolve, it’s clear that short-form videos will play an increasingly important role in the world of marketing.

    Short-Form Video Statistics

    FAQ (Short-Form Video Statistics)

    1. What is a short-form video content?

    Short-form video content refers to videos that are typically under 60 seconds long. These videos are designed for quick consumption and are often shared on social media platforms like TikTok, Instagram Reels, and YouTube Shorts. They are characterized by their brevity,  and engaging visuals, and often include elements like music, sound effects, and captions to enhance viewer experience.

    1. Why are short-form videos more popular? 

    People have shorter attention spans than ever before. Content that is easy to understand and interesting is more likely to keep people watching. Short-form videos are perfect for this because they deliver content in small pieces, making it easier for people to watch, enjoy, and share.

    1. Does short-form video reduce attention span?

    Yes, recent studies have shown that watching short-form videos can lead to a shorter attention span. It can make people want quick, short content and make it harder to focus on longer more detailed material.

  • 79 Compelling Anime Statistics You Should Know In 2025

    79 Compelling Anime Statistics You Should Know In 2025

    Uncovering the Fascinating World of Japanese Animation

    Anime Statistics

    Explore the fascinating world of anime with our comprehensive guide to anime statistics;

    The world of anime has experienced unprecedented growth in recent years, captivating audiences worldwide with its unique blend of vibrant visuals, engaging storylines, and memorable characters.

    What does the term ‘Anime’ mean?

    While ‘anime’ is a general term for animation in Japan, its use outside the country has narrowed it to denote Japanese-produced animated content primarily.

    Anime has come a long way since its humble beginnings in the early 20th century. It’s a global phenomenon, with a projected market size of $36.1 billion by 2025.

    As anime popularity soars, it’s essential to delve into the fascinating world of anime statistics to understand the trends, demographics, and market insights that shape this industry. 

    Anime Statistics (Editor’s Pick)

    • The anime industry projected a market size of $36.1 billion by 2025.
    • As of 2020, there were 3 million subscribers on anime streaming platform Crunchyroll.
    • 63% of anime fans are between 15 and 24 years old.
    • The percentage of male anime fans is 55%, with 45% being female.
    • 75% of anime fans in the United States have a college degree or higher.
    • The global anime market has a compound annual growth rate (CAGR) of 9.5% from 2020 to 2025.
    • 30% of anime industry revenue is generated from merchandise sales, including figurines, toys, and apparel.
    • The market share of the top three anime streaming platforms: Crunchyroll, Funimation, and HIDIVE, collectively account for 70%.
    • The number of anime (1,000+) conventions held worldwide in 2020, up from 250 in 2010.
    • The projected revenue of the anime industry in Japan by 2025 will be 2.5 trillion yen (approximately $23 billion).
    • 90% of anime viewers watch anime online, 60% using streaming services and 30% using video-on-demand platforms.

    General Anime Statistics

    1. Demon Slayer: Kimetsu no Yaiba – The Movie: Mugen Train is the highest-grossing anime ever. (Source

    Here is a list of the top 10 highest-grossing anime of all time ranked (Anime Statistics);

    Anime Statistics
    #Anime TitlesTotal Amount Earned Worldwide (USD)
    1.Demon Slayer: Kimetsu no Yaiba – The Movie: Mugen Train (2020)$507,119,058
    2.Spirited Away (2001)$383,883,823
    3.Your Name (2016)$347,641,192
    4.Suzume (2022)$316,848,245
    5.The Boy and the Heron (2023)$294,217,033
    6.The First Slam Dunk (2023)$279,892,281
    7.Howl’s Moving Castle (2004)$237,814,327
    8.Ponyo (2008)$205,162,666
    9.Jujutsu Kaisen 0 (2021)$196,308,703
    10.Weathering With You (2020)$192,822,685
    1. Approximately 60% of all anime originates from Japan. (Source)
    2. Crunchyroll is the leading anime streaming platform, with over 100 million users and 5 million subscribers. It boasts a library of over 40,000 anime episodes. (Source)
    3. Following Crunchyroll, Hulu, Netflix, and Hidive occupy the next spots as the preferred anime streaming services. (Source)
    4. Anime enthusiasts celebrate National Anime Day on April 15th. (Source)
    5. A significant majority of anime viewers, approximately 65%, find anime more emotionally impactful than other forms of media like live-action shows and films. This emotional connection stems from factors such as in-depth character development, intense emotions, strong character relationships, captivating animation styles, and exceptional voice acting. (Source)
    6. Over 136,700 anime series have been produced globally. (Source)
    7. Holding a Guinness World Record, “Sazae-san” stands as the world’s longest-running animated series, having aired over 7,000 episodes since its debut in 1969. (Source)
    8. The global anime market was projected to reach a value of USD 31.23 billion in 2023, with an anticipated compound annual growth rate of 9.8% from 2024 to 2030. (Source)
    9. Demand for anime is forecast to surge up to 2.21 times between 2024 and 2034. The market value for anime content is expected to skyrocket from USD 29.295.40 million in 2024 to USD 64,842.90 million in 2034. (Source)
    10. An estimated 750 to 800 million people worldwide tune in to watch anime. (Source)
    Anime Statistics
    1. Anime stands as the third most popular subgenre globally, accounting for 5.5% of the overall demand. (Source)
    2. According to Guinness World Records, Jujutsu Kaisen is the most in-demand anime series globally, with its popularity surpassing the average TV show by a staggering 7.12 times. (Source)
    3. Jujutsu Kaisen also boasts a larger Gen Z fanbase than Attack on Titan and One Piece, capturing the hearts of 71.3% of this young demographic. (Source)
    4. While The First Slam Dunk was deemed the most underrated anime movie, Blue Giant and Space Battleship Yamato 2199 Chapter 7: Soshite Kan wa Iku closely followed. (Source)
    5. In contrast, Dragon Ball and Hamtaro were considered the most overrated anime series. (Source)
    6. Pokémon, a multifaceted franchise encompassing toys, books, video games, manga, cards, and anime, has achieved unparalleled success, boasting a net worth exceeding $100 billion in 2022 and securing its title as the best-selling anime franchise of all time. (Source)
    7. The most expensive anime figure listed is a Gold Godzilla from the 1989 film “Godzilla vs Biollante,” priced at ¥150,000,000 (approximately $1,473,332). (Source)
    8. While Frieren: Beyond Journey’s End has garnered critical acclaim as the top-rated anime series, Hametsu No Mars found itself on the opposite end of the spectrum, labeled as the worst-rated. (Source)
    9. Fullmetal Alchemist has cemented its popularity as the most-watched anime series according to Anime News Network. (Source)
    10. Based on rankings from MyAnimeList and CBR, Attack on Titan is considered the most popular anime series of all time. (Source)

    Here is a list of the top 10 most popular anime of all time according to MyAnimeList, IMDb, and Anime Planet (Anime Statistics);

    Anime Statistics
    #Anime TitlesMyAnimeList Rating (x/10)IMDb Rating (x/10)Anime Planet Rating (X/5)
    1.Attack on Titans (2013)8.549.04.3
    2.Death Note (2007)8.628.94.3
    3.Fullmetal Alchemist: Brotherhood (2009)9.19.14.5
    4.One-Punch Man (2015)8.58.74.4
    5.One Piece (1999)8.718.94.3
    6.MyHero Academia (2016)7.888.34.2
    7.Demon Slayer (2019)8.498.64.4
    8.Naruto (2002)7.998.44.0
    9.Tokyo Ghoul (2014)7.797.74.1
    10.Hunter X Hunter (2011)9.049.04.2

    Anime Genre Analysis (Anime Statistics)

    1. The Action & Adventure genre dominated the anime market in 2023, but Sci-Fi and Fantasy are projected to experience the most rapid growth from 2024 to 2030. (Source)
    2. The anime landscape offers a diverse range of genres and subgenres, with over 40 distinct categories to explore. (Source)
    3. Anime is typically categorized into four main demographic genres: Shonen (young boys), Shojo (young girls), Seinen (young adult men), and Josei (young adult women). (Source)
    4. Shonen stands out as the most popular anime genre, followed by Shojo and Slice of Life. (Source)
    5. Action (battle) reigns supreme among regular anime watchers, emerging as the most-watched genre. (Source)
    6. Men tend to watch anime more frequently than women, with a particular preference for action/battle, sci-fi, fantasy, horror, and sports genres. Conversely, women show a greater interest in romance and medical-themed anime. (Source)

    Anime Statistics, Market Insights on Regions

    1. Online platforms dominated the US anime market in 2023, capturing 24% of total sales and emerging as the leading distribution channel. (Source)
    2. The North American region is poised for rapid growth in the anime market, with a projected CAGR of over 16% from 2024 to 2030. This expansion is fueled by the increasing popularity of anime across the region, particularly in the United States and Canada. (Source)
    3. Europe accounted for roughly 14% of the global anime market in 2023. (Source)
    4. In 2022, Japan’s animation industry generated approximately 1.47 trillion Japanese yen domestically. (Source)
    5. Based on a Japanese survey, approximately 60% of respondents identified as anime watchers. Among these viewers, over half are considered regular viewers, tuning in daily or weekly. (Source)
    Anime Statistics
    1. The anime market in the US was projected to reach a value of USD 2.24 billion in 2023, with strong growth anticipated over the next decade, reaching a CAGR of 15.03% between 2024 and 2033. (Source)
    2. The clothing market within the anime industry is projected to expand at a rapid pace, with a CAGR of nearly 17% anticipated between 2023 and 2030. This growth is fueled by the rising demand for anime-themed apparel, reflecting the growing passion for the genre among consumers. (Source)
    3. Figurines emerged as the top-selling product category in the anime market in 2022, accounting for over 36% of total revenue. Driven by the increasing popularity of anime in the country, this category is expected to experience significant growth by 2030. (Source)
    4. The European anime market experienced robust growth between 2017 and 2022, generating $2,436.5 billion in revenue in 2022 with a CAGR of 5.1%. (Source
    5. Merchandising dominated the European anime market in 2022, accounting for $630.0 billion or 25.9% of the total market value. (Source)
    6. The Middle Eastern and African anime markets witnessed a steady growth of 5% CAGR between 2017 and 2022, reaching a total revenue of $1.7 billion in 2022. Merchandising remained the leading segment, contributing $0.4 billion or 22.2% of the market value. (Source)
    7. The SouthEast Asia anime market is projected to continue its expansion with a CAGR of 8.84% from 2024 to 2032. (Source)
    8. The U.S. anime merchandising industry witnessed a significant valuation of USD 421.9 million in 2023 and is projected to experience substantial growth, reaching USD 1,196.2 million in revenue by 2030. (Source)
    9. A significant milestone was reached in 2022 as the industry’s overseas earnings surpassed 1.46 trillion yen for the first time. Combined with domestic income, the total market value reached around 2.93 trillion yen, setting a new industry record. (Source)
    10. Valued at USD 364.7 million in 2022, the U.S. anime merchandising industry is poised for rapid expansion with a projected compound annual growth rate of 16.1% between 2023 and 2030. (Source)
    Anime Statistics
    1. Online retailers dominated the U.S. anime merchandising market in 2022, capturing over 60% of total sales. This trend is expected to continue with further growth in e-commerce channels in the coming years. (Source)
    2. In Japan, a significant majority of the population, over 75.87%, regularly watches anime. (Source)
    3. Japan holds the title of the world’s most avid anime-watching country. (Source)
    4. Demon Slayer achieved immense popularity in Japan, attracting 3.4 million viewers within its first three days of release. (Source)
    5. English-dubbed anime accounts for the majority of demand in the United States, representing 84.3% of the market. (Source)
    6. Brazil boasts a large anime fanbase, with over 107.9 million viewers. (Source)
    7. Over 56.2 million Filipinos are dedicated anime fans. (Source)
    8. Approximately 66 million people in Mexico enjoy watching anime. (Source)
    9. Anime reigns supreme as the most popular subgenre in Malaysia, captivating 42.7% of anime fans. (Source)
    10. Anime has a wide appeal in the U.S., with around 72% of the population watching it. (Source)
    11. Daily anime viewing is prevalent among Japanese high school students, with 37.1% tuning in regularly. (Source)
    12. Before the COVID-19 pandemic, nearly half of dedicated anime fans actively engaged with the anime community by purchasing official and fan-made merchandise (49%), and attending anime conventions, and visiting anime-themed establishments (58%). (Source)
    13. Since the COVID-19 pandemic, the purchasing habits of frequent anime fans have shifted, with a 19% decline in merchandise purchases and a more significant 35% decrease in attendance at anime-themed events and businesses. (Source)
    Anime Statistics
    1. As of February 2024, the top-grossing Japanese anime films in the United States and Canada were Pokémon: The First Movie – Mewtwo Strikes Back, raking in $85.75 million, and Demon Slayer the Movie: Mugen Train, with a lifetime gross of $49.51 million. (Source)

    Anime Statistics, Audience Insights

    1. Demon Slayer achieved a historic feat in 2020, becoming the first non-Hollywood film to claim the top spot at the global box office, amassing a total revenue of $506.5 million worldwide. (Source)
    2. Over one-fifth (22%) of the anime-watching population has either retired from watching anime or has stopped following the genre, falling into the category of “non-current watchers.” (Source)
    3. Anime has achieved widespread popularity in Singapore, with 52% of adults having watched at least one anime series. The allure of anime is so strong that even those who haven’t yet watched it are intrigued, with 21% expressing interest in doing so in the future. (Source)
    4. Among Singaporean adults who have previously watched anime, frequent viewers are predominantly young adults. These dedicated fans often watch anime once or twice a week, with a significant portion (28%) tuning in daily. Even those who watch anime less frequently (once a month) make up a substantial portion of the fanbase. (Source)
    5. In Singapore, action anime reigns supreme among frequent viewers, with over half (53%) expressing a preference for this genre. (Source)
    6. In Singapore, adventure anime follows closely as the second most popular choice, with 43% of frequent viewers and 30% of casual viewers enjoying it. (Source)
    7. While comedy anime ranks third, it still attracts a significant portion of the fanbase, with 35% of frequent viewers and 28% of casual viewers appreciating this genre. (Source)
    8. A significant portion of anime fans (48%) adopt a selective approach, choosing to watch only those titles that pique their particular interest. (Source)
    9. While anime continues to enjoy a dedicated fanbase, its viewership and streaming minutes on Netflix currently lag behind American and Korean titles by approximately 60-70%. (Source)
    Anime Statistics
    1. Netflix reigns supreme among Gen Z anime fans, with 76% of them choosing it as their preferred platform, followed by Crunchyroll, Hulu, Prime Video, and Funimation. (Source)
    2. In 2021, over half of Netflix’s subscribers tuned into the anime content offered on the platform. (Source)
    3. A U.S. survey revealed that white adults exhibit the least interest in anime, with only 28% expressing a favorable opinion. In contrast, Hispanic individuals demonstrated a higher level of interest, with 40% reporting a positive view. (Source)
    4. Globally, anime fandom is relatively balanced, with 54% of fans being male and 46% female. (Source)
    5. Millennials dominate the anime fan base in the United States, comprising 42% of all enthusiasts. Generation Z follows closely behind at 25%, while Generation X represents 21%. (Source)
    6. Generation Z leads the way in anime fandom, with over 69% of its members identifying as anime watchers. Millennials follow closely at 57%, followed by Generation X at 40%. Baby Boomers represent a smaller portion of the anime-watching population, at 23%. (Source)
    7. In the United States, anime proved more appealing to male respondents, with 13% expressing a strong favorable opinion compared to 9% of women. (Source)
    8. Among high school students, male viewers were more likely to watch anime regularly, with 62% tuning in at least once a week compared to 48% of female students. (Source)
    9. Black Americans over the age of 18 are overrepresented in the anime fan base, constituting 17% compared to 13% of the general population. Similarly, Asian Americans make up 10% of anime fans, exceeding their 6% representation in the general population. (Source)
    10. The storylines and characters featured in anime have resonated deeply with Gen Z viewers, with nearly two-thirds feeling a stronger emotional connection to anime compared to traditional media. (Source)
    11. A significant portion of anime fans, including 44% of the overall fanbase and 58% of Gen Z fans, have admitted to having a crush on an anime character at some point. (Source)
    12. The anime fandom demonstrates a diverse range of gender identities, with 10% identifying as transgender, genderqueer, non-conforming, agender, genderfluid, or something other than cisgender. (Source)
    13. Attack on Titans and Dragon Ball Z emerged as the most popular anime among Gen Zers, garnering 34% of the votes each. (Source)
    14. Naruto secured the second spot with 33% of the votes, followed closely by Death Note and Demon Slayer at 31% and 30% respectively. (Source)

    Conclusion (Anime Statistics)

    The world of anime is a vibrant and dynamic industry, driven by a passionate fan base and fueled by technological advancements. As the industry continues to evolve, it’s essential to stay informed about the latest trends, demographics, and market insights. Whether you’re an anime enthusiast or an industry professional, understanding anime statistics is crucial for navigating this fascinating world.

  • 101 Latest Gift Industry Statistics  To Help You In 2025

    101 Latest Gift Industry Statistics To Help You In 2025

    Gift Industry Statistics

    Gift Industry Statistics (Unwrapping the statistics behind the business of giving)

    Want to gift with confidence? Stay up-to-date on the latest gift industry statistics and trends;

    The gift industry is a massive, growing market that is worth billions of dollars. Gifts are important in our personal and professional lives, from birthdays and holidays to corporate events and special occasions. 

    Have you ever thought about the data behind this industry? 

    In this article, we’ll dive into the interesting world of gift industry statistics, exploring trends, behaviors, and insights that shape this lucrative market.

    Gift Industry Statistics (Editor’s Pick)

    • The global gift industry is valued at a whopping $1.5 trillion.
    • The global online gift market is projected to expand at a 9.9% CAGR from 2021 to 2028.
    • The global market for gift cards reached $1.128 trillion in 2023 and is projected at a 16.3% CAGR from 2024 to 2032, reaching $4.399 trillion by 2032.
    • The U.S. gift market is projected to reach $183.9 billion by 2025.
    • Nearly two-thirds of Americans (62%) indulge in gift-giving during the holiday season.
    • The average holiday gift spending in the U.S. is a substantial $1,047.
    • Corporate gifting is a popular investment for 80% of businesses.
    • A significant 45% of consumers prefer experiential gifts.
    • Personalized gifts are a popular choice for 35% of consumers.
    • Food and beverage gifts are a popular choice for 30% of consumers.
    • Electronics are the go-to gift option for 25% of consumers.
    • Most consumers, 60%, prefer the convenience of online gift shopping.
    • The global market for personalized gifts is expected to snowball. Its global value is expected to increase from $28.19 billion in 2023 to $57.85 billion by 2031.

    Gift Industry Statistics

    1. The global gifts retailing market is expected to expand by $11.01 billion between 2023 and 2028, growing at a CAGR of 2.43%. Increasing demand for seasonal decorations and a growing gifting culture are driving forces. However, intense market competition due to pricing pressures poses a challenge. (Source)
    2. The industry generated $24.5 billion in revenue in 2023, marking a 3.2% increase from the previous year and a 0.8% annual growth rate from 2018 to 2023. (Source)
    3. As of 2023, there were 54,863 gift shops and card stores in the US, a slight decrease of 0.6% compared to the previous year. (Source)
    Gift Industry Statistics
    1. The global market for gifts reached $65 billion in 2021 and is projected to grow to $94 billion by 2031, with a growth rate of 3.74% per year. (Source)
    2. The market for gifts is expected to grow from $14 billion in 2024 to $17.13 billion by 2029, with a growth rate of 4.12% per year. (Source)
    3. According to a 2023 survey, nearly half of Americans (43%) consider cash to be the most desirable Christmas gift, bringing them the greatest happiness. (Source)
    4. In 2024, you can give up to $18,000 to anyone without paying federal gift tax, an increase from $17,000 in 2023. This means individuals can give up to $18,000 tax-free to each recipient in 2024, and married couples can give up to $36,000. The combined exemption allows individuals to transfer up to $13.61 million tax-free during their lifetime or at death. (Source)
    5. A US survey revealed that when it comes to gift-giving, 24% of households prioritize their children, allowing them to open their gifts first. Meanwhile, 20% of Americans don’t have a specific approach or tradition surrounding gift-giving. (Source)
    Gift Industry Statistics
    1. The market for corporate gifts is projected to grow from $252.6 billion in 2023 to $365.8 billion by 2032, at a growth rate of 4.2% per year, driven by increased corporate events and celebrations. (Source)
    2. Most recipients (67%) can recall the company that gave them a corporate gift. (Source)
    3. The global luxury gift market is predicted to grow at a CAGR of 3.7% from 2021 to 2028. (Source)
    4. Handmade clothing and accessories represent 36% of the total handmade gifts market. (Source)
    5. 68% of employees prefer to choose their gifts rather than relying on their employer to select one for them. (Source)
    6. The global gifting market is valued at $475 billion, with India expected to reach $84 billion by 2024, making it a significant player in the industry. (Source)
    7. US gift, novelty, and souvenir stores generated $21.15 billion in sales in 2022, slightly increasing from the previous year. (Source)
    8. By 2024, gift, novelty, and souvenir stores in the US are projected to rake in a whopping $16.6 billion in revenue. (Source)
    9. The US Gift Shops & Card Stores industry is labor-intensive, with the highest costs being Wages (15.4%), Purchases (45.3%), and Rent & Utilities (5.2%) as a percentage of revenue. (Source)
    10. Europe is expected to dominate the global gifts retailing market by 2028, accounting for 48% of the market share. (Source)
    11. India’s gifting market reached $72.56 billion in 2023 and is poised for strong growth, expanding at a CAGR of 3.35% from 2023 to 2028. (Source)
    12. Canada’s Gift Shops & Card Stores market has experienced steady growth, with revenue increasing by 1.2% annually over the past five years, reaching an estimated value of $3.5 billion in 2023. (Source)
    13. The industry is fragmented, with the top four players holding less than 40% of the market share. The industry’s concentration level is relatively low, averaging 29%. (Source)

    Personalized Gifts (Gift Industry Statistics)

    1. The demand for personalized gifts is increasing, driving the market’s growth from $23.5 billion in 2019 to an estimated $34.3 billion by 2026. (Source)
    Gift Industry Statistics
    1. The global market for personalized gifts is expanding rapidly. It was valued at $40.93 billion in 2022 and is expected to grow to $51.98 billion in 2024 and then to $138.17 billion by 2030, with an annual growth rate of 12.97% from 2024 to 2030. (Source)
    2. In the US, 50% of Gen Z and millennials are more likely to give personalized gifts in 2023 compared to the previous year, while only 25% of baby boomers feel the same way. (Source)
    3. The market for personalized gifts is growing rapidly, with its global value projected to increase from $28.19 billion in 2023 to $57.85 billion by 2031, at a growth rate of 9.40% per year. (Source)
    4. The market for non-photo personalized gifts is projected to grow to $9.12 billion by 2027, with a CAGR of 8.87% from 2023. North America is expected to account for 41% of global market growth during this period. (Source)
    5. The global personalized gifts market is projected to grow to $14.98 billion by 2028, with a CAGR of 8.35% from 2023. (Source)
    6. The UK market for personalized gifts is expected to grow to $1.13 billion by 2028, expanding at a CAGR of 10.87% from 2023 to 2028. (Source)

    Regifting (Gift Industry Statistics)

    1. 89% of respondents have received a present, with siblings and friends being the most common recipients (both at 39%). Partners and coworkers also receive regifted presents, at 38% and 34%, respectively. (Source)
    2. Drink products are the most frequently regifted items, with 39% of recipients having regifted alcohol, tea, or coffee sets. Beauty products like perfume and makeup come second (35%), followed closely by food (34%) and toiletries (27%) as popular regift choices. (Source)
    3. The primary motivations for regifting are convenience (38%) and environmental benefits (37%), followed by cost savings (30%). 72% of respondents plan to regift this year, with 53% more likely to do so due to the cost-of-living crisis. (Source)

    Gift Packaging and Accessories (Gift Industry Statistics)

    1. The gift packaging market is expected to grow steadily, increasing from $25.3 billion in 2023 to $37.4 billion by 2033, with a growth rate of 4.3% per year. (Source)
    2. The market for gift-wrapping products was worth $15.11 billion in 2018 and is expected to grow to $24.9 billion by 2025, indicating a significant increase in global demand. (Source)
    3. The market for gift boxes is projected to grow from $2.018 billion in 2023 to $3.753 billion by 2033, at a growth rate of 6.4% per year. This industry is fragmented and dominated by players in developed nations, with franchising and retail expansion being key trends. (Source)
    4. The market for gift paper is expected to grow significantly from $4.49 billion in 2023 to $6.65 billion by 2033, with a growth rate of 4.0% per year. This industry accounts for 2-3% of the global paper market and is projected to thrive. (Source)
    5. Most manufacturers (73%) report that companies prefer eco-friendly gift packaging due to its cost-effectiveness and environmental benefits. (Source)
    6. Paper and paperboard segments are expected to make up a major portion of the global gift packaging market, accounting for 43% of the industry. (Source)
    7. The US market for plastic gift-wrapping products was worth $500 million in 2018 and is projected to grow to $790 million by 2025. (Source)
    Gift Industry Statistics
    1. The global gift box market is expected to grow from $1.6 billion in 2022 to $2.6 billion by 2030, with a steady growth rate of 6.5% per year. (Source)
    2. The luxury gift box market is expected to grow significantly, with a projected CAGR of 5.5% from 2022 to 2030. The cosmetics and fragrances sector leads the market, making up over 30% of revenue, driven by the demand for premium packaging in the beauty industry. (Source)

    Holiday Gift Industry Statistics

    1. A recent US survey in October 2023 showed that over half of American consumers (51%) start their Christmas gift shopping before December, indicating an earlier holiday shopping season. (Source)
    2. In the 2023 US holiday season, 65% of female consumers prioritized price when purchasing, with convenience and fast delivery also being key considerations. (Source)
    3. American consumers spent an average of around $920 on Christmas gifts in 2022, slightly lower than the previous year’s average expenditure. (Source)
    4. A September 2023 survey found that 60% of US consumers planned to buy gifts for their significant other and children, a slight increase from the previous year for both groups. (Source)
    5. US consumers planned to spend an average of $170 per person on gift cards and $120 per person on clothing during the 2023 holiday season. (Source)
    6. As of September 2023, 63% of US shoppers prefer online-only retailers for holiday gifts, followed by mass merchants (53%). Only 25% opt for off-price stores, department stores, or warehouse clubs. (Source)
    7. German consumers were expected to spend €44 on Christmas gifts at department stores in 2023. (Source)
    Gift Industry Statistics
    1. In an October 2023 French survey, 30% of respondents said they’d be happiest receiving a gift card or voucher as a Christmas gift, making it the most popular choice. (Source)
    2. In an October 2023 Mexican survey, over 50% of respondents said they’d be happiest receiving clothes, textiles, or shoes as a Christmas gift, making it the clear top choice. (Source)
    3. In Brazil, tech gifts top Christmas wish lists, with 40% of survey respondents in October 2023 saying they’d love to receive a smartphone, tablet, or accessory. (Source)

    Gift Card Market (Gift Industry Statistics)

    1. The gift card market reached a massive $1.128 trillion in 2023 and is expected to grow rapidly at a rate of 16.3% per year from 2024 to 2032, reaching $4.399 trillion by 2032. (Source)
    2. The global digital gift card market is projected to grow from $310.1 billion in 2022 to $1.2 trillion by 2032 at a CAGR of 12.5%. (Source)
    3. The global hotel gift card market earned $53.3 billion in 2022 and is expected to grow rapidly at a rate of 14.3% per year, reaching $228.1 billion by 2033. (Source)
    4. Nearly half (47%) of US adults hold unused gift cards or vouchers worth an average of $187 each, totaling a staggering $23 billion nationwide. (Source)
    5. The US gift card market is experiencing consolidation, with major players acquiring smaller companies to strengthen their market position. Recent examples include Blackhawk Network’s acquisition of Tango Card and RDE’s purchase of CardCash.com in January 2024, expanding their presence in the industry. (Source)
    Gift Industry Statistics
    1. The US gift card market is projected to grow by 7.2% annually, reaching $214.3 billion in 2024 and $267.3 billion by 2028, with a CAGR of 5.7% from 2024 to 2028. (Source)
    2. Payment companies are partnering with gift card providers to capitalize on the increasing demand for digital payment tools. Recent partnerships include Affirm’s collaboration with Blackhawk Network and Venmo’s partnership with InComm to offer digital gift cards, further expanding the reach of gift card services. (Source)
    3. The Canadian gift card and incentive card market is projected to grow at a CAGR exceeding 8% from 2024 to 2029. (Source)
    4. Vouchers and gift cards are the top Christmas gift choices for UK consumers, and they are preferred by 39%. (Source)
    5. 61% of consumers overspend gift cards by an average of $31.75, exceeding the card’s value. (Source)
    6. 60% of customers prefer gift cards as rewards from brands or retailers rather than discounts, coupons, bonus dollars, or other offers. (Source)
    7. 69% of employees view receiving a gift card from their employer as a financial reward or cash bonus, indicating a positive perception of gift cards as a form of recognition. (Source)
    8. 86% of consumers use gift cards at familiar retailers, with 93% of Boomers doing so. (Source)
    9. 64% of consumers prefer to buy gift cards from stores offering diverse cards from multiple retailers or brands. (Source)
    10. The global wedding gift list service market is projected to grow from $220.37 billion in 2023 to $505.57 billion by 2030, with a compound annual growth rate (CAGR) of 12.6% from 2024 to 2030. (Source)
    11. Digital gift card purchases tend to be more planned, with 28% bought over a week in advance compared to 13% of physical gift cards. However, last-minute purchases are more common with physical gift cards, with 32% bought on the same day they’re given, versus 21% of digital gift cards. (Source)
    12. Most younger consumers, including 67% of millennials and 57% of Gen Z, have purchased a gift card in the past year, with a preference for physical or digital options. (Source)
    13. Gift cards are big business, and it seems consumers are leaning towards convenience. Mass merchandise stores like Target dominate (60%), followed by restaurants (52%). Direct purchases from retailers or brands are steady (39%), and online retailers are quickly becoming a popular option (49%). (Source)
    14. Millennials are the digital gift card champs! They’re way ahead of other generations, with 75% using them, compared to 72% of Gen X, 65% of Gen Z, and 61% of Boomers. (Source)
    Gift Industry Statistics
    1. Italy’s gift card market, including vouchers and coupons, is projected to be worth $84.37 million by 2025. (Source)
    2. Italy’s gift card market is projected to grow by $3.17 billion from 2021 to 2026, with an annual growth rate of 8.61%. This growth is driven by increased gift-giving and demand for seasonal decorations. However, the perception that gift cards are impersonal may limit market expansion. (Source)
    3. Physical gift cards are more popular with older generations. Here’s a breakdown: Gen Z uses them 78% of the time, Millennials 91%, Gen X 96%, and Boomers 97%. Overall, 94% of consumers have used a physical gift card at least once. (Source)
    4. Consumers purchased an average of 6.4 physical gift cards in the past year, with 60% used for gifts and 40% for personal use. Furthermore, 42% of consumers are regular buyers of physical gift cards, purchasing them at least every three months. (Source)
    5. SonyLiv and Zee5, Indian OTT platforms, offer gift cards with discounts of up to 50% and 25% to incentivize users. (Source)
    6. Australia’s gift card market is projected to grow at an annual rate of over 8% during the forecast period. (Source)
    7. Colombia’s gift card market reached $990.7 million in 2023 and is expected to grow significantly to $3.007 billion by 2032. The market is projected to experience a strong compound annual growth rate (CAGR) of 13% from 2024 to 2032. (Source)
    8. Germany’s gift card market is expected to grow significantly from $66.4 billion in 2023 to $171.9 billion by 2032, at a CAGR of 11.15%. (Source)
    9. The Middle East gift card market earned $27 billion in 2023 and is expected to grow at a rate of 7% per year in the future. (Source)
    10. According to Mordor Intelligence, e-gift card adoption increased by a massive 250% in the first quarter of 2020 compared to the same period in 2019. (Source)
    Gift Industry Statistics
    1. France’s gift card market is expected to surge from $35.8 billion in 2023 to $86.8 billion by 2032, growing at a CAGR of 10.33%. This growth is driven by the increasing trend of digitalization, with more people favoring digital gift cards over traditional paper ones. (Source)
    2. Singapore’s gift card market is expected to grow by 11.7% to $1.183 billion in 2022 and reach $1.7 billion by 2026, with a CAGR of 9.5% from 2022 to 2026. (Source)

    Regional Gift Industry Statistics

    1. The United States dominates the global gift packaging market, accounting for 14.3% of sales, followed by Canada at 1.5%. This significant market share drives a substantial portion of the industry’s revenue. (Source)
    2. In the UK, searches for “christening gifts” increased by 639%, followed by “buy a gift” at 123%. “Secret Santa gifts” also grew by 43%. However, searches for “personalized gifts” declined by 36%. (Source)
    3. In the UK, online searches for “Buy a Gift” increased by 123% in January 2022, followed by “Virgin Experience Days” at 83%, indicating a rising demand for experiential gifts. (Source)
    4. In the UK’s gift industry, notonthehighstreet.com led online visibility in January 2022 with a score of 83,188, followed by buyagift.co.uk with a score of 34,339, making them the top two online retail websites in the sector. (Source)
    5. Australia’s online corporate and promotional gift market has experienced a 7.5% annual decline over the past five years, with revenues expected to drop to $188.6 million by 2024. (Source)
    6. Over 30% of Australians intend to boost their online gift-shopping habits. (Source)
    7. In Spain, online marketplaces and pure players were the leading gift shopping channels in 2021, used by 15% of respondents. These are followed by traditional online retailers (7%), brand websites (5%), and social media/other channels (2%). (Source)
    8. Spain’s e-commerce gift market revenue saw significant fluctuations from Q1 2014 to Q4 2019. Its peak was in Q1 2018, reaching around €120 million in sales. (Source)
    9. The Asia Pacific region accounts for 23% of the total revenue in the global gift retail market, equivalent to $4.4 billion. This segment is expected to expand at a CAGR of 5.6% from 2024 to 2031, driving the market’s growth. (Source)
    10. The Asia Pacific region is the leading market for floral gifting, with a 22% market share and driving significant growth in the industry. (Source)
    11. The floral gifting market in the Asia Pacific region reached $11.11 billion in sales revenue in 2023. (Source)
    12. China’s gift industry boomed in 2023, reaching a staggering 1.3 trillion yuan, with projections to surpass 1.6 trillion yuan by 2027. Curated gift sets and boxes featuring specialty foods, fashion accessories, and cultural creations are gaining immense popularity among Chinese consumers during the festive seasons. (Source)
    13. China dominates the global gift and premium market, producing over 80% of its promotional products, solidifying its position as the world’s largest manufacturer of giveaway items. (Source)
    14. India’s market for gift paper is projected to grow to $442.9 million by 2033, building on its 6.1% global market share in 2022. (Source)
    15. India’s gift card market is expected to grow significantly from $11.88 billion in 2024 to $26.81 billion by 2029, with a growth rate of 17.67% per year. (Source)
    16. Japan’s year-end gifts market was worth 858 billion yen in 2023 but is forecast to decline slightly to 842 billion yen in 2024. (Source)
    17. The Japanese gifts market is expanding significantly, with its retail value expected to exceed 11 trillion yen by 2024, up from less than 10 trillion yen in 2015. (Source)
    18. India’s Diwali gifting market is growing rapidly, increasing from ₹1.5 lakh crore (US$20 billion) in 2022 to over ₹2 lakh crore (US$27 billion) in 2023. (Source)
    19. The Chinese gift industry saw a 6% increase in 2023, setting a new record, and is expected to maintain this growth momentum in 2024. (Source)
    20. South Africa’s gift card market is expected to grow from $1.2 billion in 2023 to $1.9 billion by 2028 at a CAGR of 10%, reaching $1.3 billion in 2024. (Source)
    Gift Industry Statistics

    Conclusion (Gift Industry Statistics)

    The gift industry is a complex and dynamic market, driven by changing consumer habits, technological advancements, and shifting values. By understanding the statistics behind this industry, businesses and individuals can better navigate the world of gift-giving, identifying opportunities for growth, innovation, and sustainability. Whether you’re a retailer, manufacturer, or simply a thoughtful friend or family member, the gift industry has something to offer everyone.

  • 57 New Insightful EdTech Statistics In 2025 You Need to Know: Unlocking the Power of Education Technology

    57 New Insightful EdTech Statistics In 2025 You Need to Know: Unlocking the Power of Education Technology

    EdTech Statistics

    Explore the latest EdTech statistics and trends shaping the future of education.

    The education technology (EdTech) industry has experienced unprecedented growth in recent years, transforming how we learn and teach. From online learning platforms to AI-powered adaptive learning tools, EdTech has revolutionized the education sector.

    But what do the numbers say? 

    This article will delve into the latest EdTech statistics to comprehensively understand the industry’s current state and prospects.

    Top EdTech Statistics (Editor’s Pick)

    • The EdTech market is projected to reach $340 billion by 2023.
    • Corporate EdTech is a $27.5 billion industry.
    • EdTech usage in K-12 schools has increased by 99% since 2020.
    • Over 70% of colleges expect to launch one or more online undergraduate programs in the next three years.
    • 71% of online adults aged 18-29 use social media to learn about educational opportunities.
    • Digital learning is the most popular corporate skill-building strategy.
    • EdTech private investment is expected to return to $7-8 billion pre-pandemic.
    • The global EdTech revenue hit $106 billion in 2021 and is predicted to grow 16.5% annually through 2030.
    • The adaptive learning market is predicted to reach $9.11 billion by 2028.
    • The projected demand for Generative AI in Edtech in North America, valued at USD 39.1 million in 2023, is anticipated to experience substantial growth from 2024 to 2033.

    General EdTech Statistics

    1. The global corporate e-learning market, valued at $22.15 billion in 2023, is expected to reach $46.08 billion by 2030, growing at a compound annual growth rate (CAGR) of 10.9% from 2024 to 2030. (Source)
    2. The use of EdTech in K-12 schools has risen by 99% since 2020. (Source)
    3. A major obstacle in the educational technology market is the limited availability of reliable internet and digital devices, which hinders widespread adoption. (Source)
    4. In 2019, the consumer goods sector held the largest share of the corporate e-learning market at approximately 20%. (Source)
    5. Corporate e-learning is divided into two types – on-premise and cloud-based deployment, with cloud-based deployment being the main service form and accounting for approximately 79% of the market share in 2019. It is expected to continue to grow in the forecast period. (Source)
    6. The education market for augmented reality (AR) was valued at $5.3 billion in 2023, while revenues from Virtual Reality (VR) head-mounted displays (HMDs) in education were expected to exceed $640 million. (Source)
    EdTech Statistics
    1. The leading 5 EdTech learning management platforms are Google Classroom, Canvas, Schoology, Savvas Realize, and Seesaw. (Source)
    2. Quizlet, Desmos, and Grammarly are the most popular EdTech study tools among students and teachers. (Source)
    3. According to a survey by the EdWeek Research Center, 42% of educators reported that students had greater access to school-issued personal devices during the pandemic than before. However, 18% of these educators noted that this increased access was temporary and would end up on schools reopening. (Source)
    4. 58% of educators in a survey claimed their perception of Edtech had improved due to increased technology use during coronavirus school building closures. (Source)
    5. 93% of teachers were engaged in some form of online instruction during the pandemic, with 50% teaching exclusively online. This percentage varied significantly based on the districts’ income levels. (Source)
    6. Among district leaders and teachers, 6% of the former and 21% of the latter reported a more negative view of Edtech following experiences during coronavirus closures. (Source)
    7. During school closures, 87% of teachers reported improving their ability to use educational technologies, while only 3% reported a decline in their ed-tech skills. (Source)
    8. The global e-learning market is expected to reach nearly 400 billion U.S. dollars by 2026. (Source)
    9. Challenge-based gamification has been shown to increase student outcomes by up to 35% potentially. (Source)
    10. The global EdTech market is projected to reach US$231.08 billion by 2027, with a compound annual growth rate (CAGR) of 13.61% from 2022 to 2027. The hardware segment showed gradual market share growth from US$27.14 billion in 2017 to 2021. (Source)
    EdTech Statistics
    1. Worldwide spending on EdTech is expected to increase dramatically in several key segments in 2025. Expenditure on augmented and virtual reality is forecasted to increase from 1.6 billion US dollars in 2018 to 12.6 billion in 2025. (Source)
    2. The global edtech market is expected to grow from $108.246 billion in 2024 to $411.566 billion by 2034, representing a compound annual growth rate (CAGR) of 14.3% over the next decade. (Source)
    3. Worldwide spending on EdTech is expected to grow substantially, particularly in augmented and virtual reality, from US$1.6 billion in 2018 to US$12.6 billion in 2025. (Source)

    K-12 EdTech Statistics

    1. The K-12 education technology market, valued at $1.6 billion in 2023, is expected to reach $8.8 billion by 2032, growing at a 21.3% CAGR from 2023 to 2032. (Source)
    2. The K-12 EdTech segment held the largest market share in 2023, exceeding 39%, driven by the increasing popularity of game-based learning in the K-12 sector. (Source)
    3. According to a 2022 report, K-12 EdTech engagement was focused 17.5% on organization, 22.5% on educators, and 66.0% on learners. (Source)
    4. During the 2022-23 school year, Google Classroom was the leading learning management system used by K-12 students and teachers in the United States. (Source)
    5. On average, US K-12 school districts access 1403 EdTech solutions each month. (Source)

    Higher Education Technology Statistics (EdTech Statistics)

    1. Student information management systems dominated the higher EdTech market in 2022, capturing over 25% of the market share. Meanwhile, campus management is poised for significant growth, projected to expand at a CAGR exceeding 25% during the forecast period. (Source)
    2. Since the pandemic, 98% of universities have transitioned their classes to an online format. (Source)
    3. Additionally, professional services led the higher EdTech market with a 59% share and are expected to maintain dominance through 2030. Meanwhile, managed services are projected to grow at a CAGR of 20%, representing the fastest-growing segment in the forecast period. (Source)
    4. On-premise deployment led the higher EdTech market with a 54% share in 2022, but cloud deployment is expected to grow at a CAGR of over 20% and gain ground by 2030. (Source)
    5. For learning mode, offline learning led the higher EdTech market with a 53% share in 2022, but online learning is expected to grow at a CAGR of over 19% and gain ground by 2030. (Source)
    6. The private segment of the higher EdTech market held around 60% market share in 2022 and is expected to remain dominant by 2030, while the public segment is expected to experience significant growth at a 21% compound annual growth rate (CAGR) between 2023 and 2030. (Source)
    EdTech Statistics
    1. The global higher EdTech market was anticipated to be worth USD 36.24 billion in 2022, with a compound annual growth rate (CAGR) of 18.6% expected between 2023 and 2030. (Source)

    Generative AI Educational Statistics (EdTech Statistics)

    1. Educational institutions utilizing Generative AI for content creation and course development saw a 25% reduction in time and costs in 2023. (Source)
    2. In 2023, 45% of educational institutions were exploring the use of Generative AI for administrative tasks such as scheduling and resource management. (Source)
    3. The application of Generative AI to make learning interactive through gamification in EdTech saw a 20% increase in 2023, enhancing student engagement. (Source)
    4. Analysts anticipate that by the end of 2024, over 60% of major EdTech companies will have incorporated Generative AI into their offerings, driving innovation and personalized learning. (Source)
    5. The demand for Generative AI in Edtech in North America was estimated at USD 39.1 million in 2023 and is expected to expand considerably from 2024 to 2033. (Source)
    6. Students accounted for more than 49% of the market share in the Generative AI in the EdTech market in 2023, highlighting the impact of these technologies on enhancing the student learning experience. (Source)
    7. In 2023, the use of Generative AI for language learning and translation in EdTech increased by 18%, making language learning more effective and engaging. (Source)
    8. The adoption of Generative AI for grading and assessment in EdTech solutions increased by 15% in 2023, streamlining educators’ workloads. (Source)
    9. The integration of Generative AI in virtual and augmented reality (VR/AR) for learning purposes increased by 22% in 2023, offering immersive educational experiences. (Source)
    10. Experts predict that using Generative AI for personalized career advice and skill-building in EdTech will grow by 28% by the end of 2024. (Source)
    11. In 2023, Adaptive Learning dominated the Generative AI in the EdTech market with a 39% share due to its ability to personalize learning experiences tailored to individual learners’ needs, pace, and preferences. (Source)
    EdTech Statistics
    1. The global generative AI in the EdTech market is expected to grow from $268M in 2023 to $8.3B by 2033, at a 41% CAGR from 2024 to 2033. (Source)
    2. The use of Generative AI for language translation and accessibility features in EdTech solutions grew by 18% in 2023, promoting inclusivity in education. (Source)
    3. The adoption of Generative AI for personalized learning and adaptive tutoring in EdTech increased by 32% in 2023, with 50% of organizations increasing their investments in these technologies. (Source)
    4. The market size for Generative AI is expected to grow from USD 13.5 billion in 2023 to approximately USD 255.8 billion by 2033, with an annual growth rate of 34.2%. (Source)

    EdTech Statistics by Country

    1. In 2022, there were 14 EdTech funding deals in Indonesia, up from 11 the previous year. This covered various sectors, including digital certification, vocational skills, linguistic courses, learning management systems (LMS), K-12 learning, student loans, and children’s productivity platforms. (Source)
    2. In 2023, 47% of the leading 50 Southeast Asian EdTech startups were based in Singapore, while Indonesia’s share decreased from 35% in 2020 to 20% in 2023. (Source
    3. As of 2022, EdTech funding in Indonesia totaled approximately US $18 million, marking an increase from the previous year. This indicated a rise of about $6.65 million from 2021 to 2022. (Source)
    4. According to the Research Institute of America, e-learning can increase staff retention rates by 25% to 60% in businesses. (Source)
    5. As of 2022, the penetration rate of online university education in Indonesia was approximately 0.3%. (Source)
    EdTech Statistics
    1. The U.S. EdTech market is projected to grow at a compound annual growth rate (CAGR) of 11.3% between 2024 and 2030. The abundance of startups and established EdTech companies in the country is driving this growth. (Source)
    2. Australia and New Zealand are anticipated to experience significant growth in the EdTech market, with a projected CAGR of 22.7% from 2024 to 2034. (Source)
    3. As of January 2023, ByJu, an Indian company, held the highest valuation among EdTech unicorns worldwide at US $22 billion. Among the top ten companies by valuation, five were from the United States, two were from India, and Austria and Canada each had one EdTech unicorn. (Source)
    4. In 2020, the Kindergarten to twelfth-grade education market was valued at US$1.16 billion, while the skill development market was valued at less than US $500 million. The market is anticipated to remain the largest segment, followed by test preparation and online certification. (Source)
    5. Skyeng led the revenue among EdTech platforms in Russia, generating 7.4 billion Russian rubles from July to September 2023. Skillbox Holding Limited followed with 3.5 billion Russian rubles in revenue, which includes brands like Skillbox, GeekBrains, and SkillFactory. (Source)
    6. Online university courses had the highest revenue among different levels of digital education in Russia, reaching 15 billion Russian rubles in 2021. In the same year, online secondary education services were valued at 10 billion Russian rubles. (Source)
    7. North America is expected to contribute 41% to the global EdTech market growth during the forecast period. (Source)

    Conclusion (EdTech Statistics)

    As data reveals trends in student engagement, digital tool adoption, and personalized learning, it is clear that EdTech is not merely an enhancement but a fundamental component of modern education. Educators and institutions that harness these insights can tailor their approaches to meet the diverse needs of learners, thereby unlocking new pathways for educational success. As we continue to navigate the evolving landscape of education technology, staying informed about these statistics will be essential for making data-driven decisions that promote effective learning environments and prepare students for a future where technology and education are deeply intertwined.

    EdTech Statistics
  • 71 Latest Exciting Millennials on Social Media Statistics You Need to Know In 2025

    71 Latest Exciting Millennials on Social Media Statistics You Need to Know In 2025

    Millennials on Social Media Statistics

    Discover the latest millennials on social media statistics;

    As the largest living generation, Millennials (born between 1981 and 1996) have become a cornerstone for businesses and marketers. With their estimated $2.5 trillion in spending power, they’re not just consumers but cultural influencers.

    Millennials are deeply connected to the internet, with 99% using it daily. Social media is their primary online hub, with 86% engaging on platforms. Most Millennials own an average of 8.4 social media accounts, spending 3.25 hours daily on these platforms. This generation consumes diverse content, from entertainment to news, making them a highly engaged and influential audience.

    In this article, we’ll explore the latest Millennials on social media statistics, delving into their favorite platforms, online habits, and the factors driving their engagement.

    Millennials On Social Media Statistics(Editor’s Pick)

    • Millennials, the most active social media users and online shoppers spent a staggering $1.4 trillion in consumer spending.
    • 90% of millennials are active on social media, with an average of 3.5 hours spent online daily.
    • 70% of millennials use social media to research products and services before purchasing.
    • A recent eMarketer study revealed that nearly half of American Millennials are active on Instagram.
    • Black Millennials place a higher value on social media in their lives compared to their white counterparts.
    • A survey of U.S. Millennials found that Instagram was the top shopping influence for 31% of women and 25% of men.
    • A significant 55% of Millennials have bought products or services after seeing them promoted on social media.
    • Female Millennials are most likely to follow food, fitness, and beauty bloggers on social media.

    General Millennials On Social Media Statistics

    1. Social media usage has surged among Millennials, with nearly three-quarters (72%) reporting an increase in the past year. (Source)
    Millennials on Social Media Statistics
    1. Social media is nearly ubiquitous among Millennials, with 95% actively using platforms. (Source)
    2. Always connected, 86% of Millennials use social media daily. (Source)
    3. Millennials, the most active social media users and online shoppers fueled a staggering $1.4 trillion in consumer spending in 2020. (Source)
    4. From the United States to Japan, Millennial consumers across the globe favor social platforms for media consumption. This content’s appeal lies in its bite-sized format, easy accessibility, and personalized nature. (Source)
    5. A vast majority of Millennials (99%) would recommend a company to their network if they had a positive social media connection. (Source)
    6. Social networks are the go-to platform for Millennials when researching products online. (Source)
    7. In the United States, the United Kingdom, Germany, Brazil, and Japan, Gen Z, Millennials, and Gen X all favor social media. (Source)
    8. A significant portion of Millennials (33%) share or post on social media daily, while 51% do so weekly. (Source)
    9. Nearly half of Millennials (44%) are open to promoting goods or services on social media in exchange for rewards. (Source)
    10. Globally, Millennials have an impressive average of 8.4 social media accounts. (Source)
    11. Over half of Millennials (60%) have used social media to engage with brands for customer support, either through public posts or private messages. (Source)
    12. Social media is a popular platform for discovering TV and video content among Gen Z (84%) and Millennials (73%). (Source)
    13. Nearly half of Millennials (46%) have turned to social media for customer service assistance. (Source)
    14. Male Millennials are most likely to follow sports stars, entrepreneurs, politicians, comedians, and gaming bloggers on social media. (Source)
    Millennials on Social Media Statistics
    1. Female millennials follow the most popular social media accounts of food, fitness, and beauty bloggers. (Source)
    2. Facebook remains the most popular social media platform among Millennials. (Source)
    3. For 34% of Millennials, social media is their primary news source, surpassing online news (25%) and mobile apps (23%). (Source)
    4. By 2027, Gen Z and Millennials will make up over half of all social network users in the United States, totaling 135.5 million. (Source)
    5. While Millennials and Gen Z dominate TikTok’s user base in the United States, they also exhibit the highest levels of loyalty to the platform. (Source)
    6. Traditional advertising has lost credibility among Millennials, with 84% expressing distrust. (Source)
    7. TikTok and YouTube are the preferred platforms for finding relevant content among Millennials, with 61% and 59% respectively. (Source)
    8. Emojis were a staple in 55% of Millennials’ texts and instant messages. (Source)
    9. When flirting or dating, 69% of Millennials reported increased emoji usage. (Source)
    10. A significant portion of Millennials (47%) who use social media believe it has a positive impact on their mental health. (Source)
    11. TikTok has negatively affected the mental health of 37.3% of U.S. Millennials. (Source)
    12. Sports videos on social media are most popular among Gen Z adults (58%), Millennials (59%), and Gen Xers (53%). (Source)
    13. Most Millennials (54%) have signed an online petition. (Source)
    14. Nearly one in five (19%) have taken part in social media campaigns to influence government policies or actions. (Source)
    15. Approximately one in four indicate that social media has motivated them to become more involved in social or political causes (28%) or to donate to online charities (24%). (Source)
    Millennials on Social Media Statistics
    1. A recent survey in the United Kingdom revealed that 94% of both Generation Z and Millennials were active on social media platforms in June 2023. (Source)
    2. Most Millennials (68%) desire a consistent, integrated experience across all platforms. (Source)
    3. Black Millennials place a higher value on social media in their lives compared to their white counterparts. (Source)
    4. African American and Latino Millennials are more likely than white Millennials to choose alternative websites to Facebook. (Source)
    5. Millennials spend an average of 2.25 hours per day on social media platforms. (Source)
    6. Young Generation Z and Millennials make up the majority (75%) of heavy social media users, spending five or more hours daily. (Source)
    7. Facebook Stories, Facebook Feed, and YouTube are the most time-consuming platforms for Millennials. (Source)
    8. Millennials are significantly more active on Facebook than older demographics, with 77% daily usage compared to 68% of 35-54-year-olds and 52% of those 55 and over. (Source)
    9. A significant portion of Millennial TikTok users (42%) enjoy being early adopters of new trends, while 45% actively follow the latest technology developments. (Source)
    10. Among young people, Twitter ranks sixth among social networks. Millennials are slightly more likely to use Twitter compared to Generation Z. (Source)
    11. Discord and Roblox are less popular among Millennials, with a notably lower usage rate compared to other platforms. (Source)

    Millennial Social Media Shopping Habits (Millennials On Social Media Statistics)

    1. A staggering 94% of Millennials who are moved by Instagram posts take action, with 75% ultimately making a purchase. (Source)
    2. When purchasing decisions, YouTube is the go-to platform for Gen Z, Millennials, and Gen X. (Source)
    3. Millennials overwhelmingly prioritize companies that align with their personal beliefs and values. (Source
    Millennials on Social Media Statistics
    1. Positive online reviews significantly influence (40%) Millennials’ purchasing decisions, and social media platforms are a key resource for product research. (Source)
    2. Free delivery is the most important factor driving Millennial purchases, followed closely by easy returns policies. (Source)
    3. The majority of Millennials (75%) believe a brand’s social media presence is influential in their purchasing decisions. (Source)
    4. Millennials constantly seek online validation, inspiration, and advice on purchases, including which brands to invest in. (Source)
    5. 55% of Millennials discover new products on Pinterest. (Source)
    6. 26% of Millennials use social media to stay informed about fashion trends. (Source)
    7. Nearly one-third of Millennials prefer to purchase brands they see advertised online. (Source)
    8. For Millennials, in-store discovery is the primary way to find new cosmetics (38%), followed by Instagram ads (34%) and Facebook or YouTube commercials (32%). (Source)
    9. In the United States, 70% of Generation Z and Millennials follow influencers on social media, and one-third of them say these influencers have influenced their buying decisions. (Source)
    10. A significant 82% of Millennials are likely to make an impulse purchase if they see an item they like for the first time. (Source)
    11. Social media has emerged as a key source for Millennial fashion trends, contributing to their estimated $1.4 trillion spending on fashion in 2020. (Source)
    12. Instagram is the primary shopping influence for female Millennials in the U.S., with male Millennials showing a similar preference. (Source)
    13. Younger Millennials are more likely to be influenced by visually-focused platforms like Instagram and TikTok. (Source)
    14. Older Millennials in their 30s and 40s primarily rely on Facebook for shopping inspiration. (Source)

    Millennials On Social Media Statistics By Country

    1. In 2020, WhatsApp, Facebook, and YouTube were more popular than Instagram among Dutch Millennials aged 20 to 39. (Source)
    2. Nearly 90% of Dutch Millennials surveyed used WhatsApp. (Source)
    3. Facebook was also widely used among Dutch Millennials, with 82% of respondents being frequent users. (Source)
    4. Combined, Facebook and WhatsApp had over ten million users in the Netherlands, with 9.1 million and 6.8 million daily active users, respectively. (Source)
    5. In a March 2023 survey, WhatsApp was the most popular social media platform among Spanish Millennials, used by 86% of respondents. (Source)
    6. Facebook, Instagram, and YouTube followed closely behind, with audience reach percentages of 75%, 74%, and 73%, respectively. (Source)
    7. Twitter and TikTok ranked fourth and fifth, both with an audience reach of 82%. (Source)
    8. Nearly half of American Millennials are active on Instagram, according to eMarketer. (Source)
    9. Facebook maintains its lead in social media engagement among Millennials, with between 85% and 89% of them using the platform, depending on their age. (Source)
    10. Snapchat holds the second position in social media engagement. (Source)
    11. 59% of Millennials in the US are active on Instagram. (Source)
    12. Among the target demographic, Snapchat held an 18% market share, while Facebook had a 29% share. (Source)
    13. Twitter accounted for 14% of mobile device usage among college students. (Source)

    Conclusion (Millennials On Social Media Statistics)

    The latest Millennials on social media statistics paint a vivid picture of a generation that is digitally savvy, socially conscious, and increasingly influential. With over 90% of Millennials active on social media, it’s clear that these platforms have become an integral part of their daily lives. As marketers, entrepreneurs, and businesses, understanding the nuances of Millennials on social media statistics is crucial for crafting effective strategies that resonate with this demographic.

    Stay ahead of the curve and make data-driven decisions by keeping a pulse on the latest Millennials on social media statistics your business depends on it.

    Millennials on Social Media Statistics
  • Latest GoHighLevel for Dentists (2025): Supercharge Your Dental Business?

    Latest GoHighLevel for Dentists (2025): Supercharge Your Dental Business?

    Gohighlevel For Dentists

    Gohighlevel For Dentists: Elevate Your Dental Practice with GoHighLevel

    GoHighLevel is a powerful tool designed to help dentists and dental clinics streamline operations and provide exceptional patient care.

    This guide will explore how GoHighLevel can benefit your dental practice and offer valuable insights for optimizing your business processes.

    Ready to take your lead generation to the next level? Explore GoHighLevel for Dentists and discover a wealth of resources to fuel your marketing success! 

    Gohighlevel For Dentists

    Gohighlevel 30-day free trial offer

    GoHighLevel: Your Dental Practice’s Essential Tool (Gohighlevel For Dentists)

    GoHighLevel is a comprehensive marketing automation and CRM platform designed to streamline your dental practice.

    Key Benefits:

    • Effective Marketing: Advertise your dental services and attract new patients.
    • Streamlined Operations: Manage appointments, automate bookings, and engage patients seamlessly.
    • Integration with Dental Practice Management Systems: Create a unified marketing, scheduling, and follow-up solution.

    Discover how GoHighLevel can transform your dental practice.

    Visit Gohighlevel Here…

    GoHighLevel: Your Dental Practice’s Essential Tool (Gohighlevel For Dentists)

    GoHighLevel is a comprehensive platform designed to streamline your dental practice and enhance patient care.

    Key Features and Benefits: (Gohighlevel For Dentists)

    1. CRM:
    • Centralized Patient Management: Track patient information, appointments, and treatment history.
    • HIPAA Compliance: Ensure patient privacy with optional HIPAA compliance.
    • Segmentation: Categorize patients for targeted communication.
    • Automated Follow-ups: Send reminders and follow-up messages.
    1. Automation:
    • Workflows: Create automated workflows for appointments, reminders, and post-treatment care.
    • Email and SMS Campaigns: Send automated marketing messages to educate and promote your services.
    • Voice Reminders: Utilize automated voice calls for appointment confirmations.
    1. Website and Funnel Builder:
    • Custom Websites: Create professional websites with pre-designed templates.
    • Landing Pages: Design targeted landing pages for specific services or offers.
    • Pop-ups: Engage visitors with targeted pop-up messages.
    • Website Integration: Seamlessly integrate GoHighLevel into your existing dental website.
    1. Reputation Management:
    • Review Management: Gather and showcase patient testimonials.
    • Feedback Collection: Collect feedback to improve your services.
    1. Communication Tools:
    • Two-Way Messaging: Communicate with patients through SMS or email.
    • Appointment Scheduling: Allow patients to book appointments directly.
    1. Analytics and Reporting:
    • Campaign Tracking: Monitor marketing campaign performance.
    • Patient Source Analysis: Identify effective patient acquisition channels.
    1. Integrations:
    • Dental Software Integration: Connect with your preferred dental practice management systems.
    • Third-Party Tools: Expand functionality with integrations through Zapier, Webhooks, and the GHL API.

    By leveraging GoHighLevel, you can streamline your dental practice, enhance patient experience, and drive growth.

    Visit Gohighlevel Here…

    GoHighLevel Snapshots: A Shortcut to Success for Dentists (Gohighlevel For Dentists)

    GoHighLevel Snapshots are pre-built templates that can be easily imported into your account, saving you time and effort. These snapshots include settings, campaigns, funnels, automation, and more, providing a ready-made framework for your dental practice.

    Key Benefits: (Gohighlevel For Dentists)

    • Save Time: Avoid building everything from scratch with pre-designed templates.
    • Access Expert Strategies: Benefit from industry-specific templates and workflows.
    • Streamline Your Operations: Implement proven strategies to optimize your dental practice.

    Discover how GoHighLevel Snapshots can accelerate your dental practice’s growth.

    Visit Gohighlevel Here…

    Streamline Your Dental Practice with GoHighLevel’s Funnel Templates (Gohighlevel For Dentists)

    GoHighLevel offers pre-designed funnel templates that can help you attract and convert patients seamlessly. These templates guide potential clients through a journey, from initial awareness to scheduling appointments or purchasing.

    Gohighlevel For Dentists

    With GoHighLevel’s dental-specific templates, you can:

    • Save Time: Avoid building funnels from scratch.
    • Customize Easily: Tailor templates to match your brand and goals.
    • Streamline Processes: Automate patient acquisition and conversion.

    Discover how GoHighLevel’s funnel templates can transform your dental practice.

    Visit Gohighlevel Here…

    Elevate Your Dental Practice with GoHighLevel’s Website Templates (Gohighlevel For Dentists)

    GoHighLevel offers a range of pre-designed website templates tailored to the dental industry.

    Gohighlevel For Dentists

    Key Templates: (Gohighlevel For Dentists)

    • One-Page Dental Website: This template features essential sections like “About Us,” “Services,” and “Contact,” along with appointment CTAs.
    • Generic Website Templates: Easily adapt generic templates to suit your dental practice needs.
    Gohighlevel For Dentists

    Customize and Launch Your Website Effortlessly: (Gohighlevel For Dentists)

    • Swap Placeholder Text: Replace generic text with your specific information.
    • Add Your Branding: Incorporate your logo and branding elements.
    • Build Your Pages: Create the pages you need using GoHighLevel’s intuitive editor.

    Ready to build your professional dental website? Check out our guide to get started!

    Visit Gohighlevel Here…

    Elevate Your Dental Practice with GoHighLevel’s Automation (Gohighlevel For Dentists)

    GoHighLevel’s pre-built automation can streamline your dental practice and save you valuable time. Here are some examples:

    • Lead Nurturing: Automatically follow up with leads to convert them into patients.
    • Appointment Reminders: Send automated reminders to reduce no-shows and improve attendance.
    • Social Media Engagement: Respond to leads on social media for timely communication.
    • Reporting and Analytics: Generate reports to track marketing campaign performance and make data-driven decisions.

    Discover how GoHighLevel’s automation can transform your dental practice.

    Visit Gohighlevel Here…

    Elevate Your Dental Practice with GoHighLevel Integrations (Gohighlevel For Dentists)

    GoHighLevel’s integration capabilities offer a range of benefits for dental practices.

    Key Benefits of Integrating with Dental Practice Management Systems (DPMS): (Gohighlevel For Dentists)

    • Seamless Data Sync: Synchronize contacts and patient information between GoHighLevel and your DPMS.
    • Enhanced CRM Functionality: Manage leads, appointments, and reminders within GoHighLevel.
    • Improved Efficiency: Streamline your operations and save time.
    • Data-Driven Decisions: Track marketing campaign performance and make informed choices.

    Popular DPMS Integrations: (Gohighlevel For Dentists)

    • Dentrix: Connect via Agency API key for seamless workflow integration.
    • Eaglesoft: Synchronize contacts, manage appointments, and send reminders.
    • Open Dental: Integrate for contact syncing, appointment scheduling, and communication.

    Not listed above? Use Zapier to connect GoHighLevel with your preferred DPMS system.

    Discover how GoHighLevel integrations can transform your dental practice.

    Visit Gohighlevel Here…

    GoHighLevel: The Dental Practice’s Essential Tool

    Are you tired of juggling multiple tools for your dental practice? GoHighLevel is the all-in-one solution you’ve been waiting for.

    Key Benefits: (Gohighlevel For Dentists)

    • Streamlined Operations: Manage leads, appointments, and marketing from a single platform.
    • Time-Saving Automation: Automate tasks and focus on patient care.
    • Cost-Effective: Replace multiple tools with a single, powerful platform.

    Ready to experience the power of GoHighLevel? Start your free trial today!

    Gohighlevel For Dentists

  • 99 Top Talent Management Statistics 2025: Unlocking Business Success with Data-Driven Insights

    99 Top Talent Management Statistics 2025: Unlocking Business Success with Data-Driven Insights

    Talent management statistics

    Below are some top Talent Management Statistics;

    In today’s fast-paced and competitive business landscape, organizations are constantly seeking ways to stay ahead of the curve. One crucial aspect that has gained significant attention in recent years is talent management. Effective talent management is no longer just a nicety, but a necessity for driving business success. In this article, we’ll delve into the world of talent management statistics, exploring the latest trends, challenges, and best practices that can help you unlock the full potential of your workforce.

    What Is Talent Management (Talent Management Statistics)

    Talent management is the process of identifying, developing, and retaining top performers within an organization. It involves creating a strategic approach to attract, engage, and retain the best talent, aligning their skills and abilities with the company’s goals and objectives.

    Key Talent Management Statistics (Editor’s Pick)

    • 80% of organizations believe that talent management is a critical component of their business strategy.
    • 75% of companies struggle to attract and retain top talent, resulting in significant financial losses.
    • 40% of employees are likely to leave their jobs within the first year if they don’t receive adequate training and development opportunities.
    • High-performing employees are 25% more likely to stay with their current employer if they have opportunities for growth and development.
    • Companies with effective talent management strategies experience 26% higher revenue growth compared to those without.
    • The global talent management market is estimated to have been worth $1922.96 million in 2022 and it is anticipated to grow to $2178.26 million by 2028.
    • The majority of advertisers, agencies, publishers, platforms, and ad tech companies (76%) identified inadequate training and development as a major factor contributing to the shortage of talent in the industry.

    General Talent Management Statistics

    1. The global talent management market’s value was $1922.96 million in 2022, and it is expected to increase to $2178.26 million by 2028, growing at a rate of 2.1% annually. (Source)
    2. Nearly 40% of respondents prefer purchasing from well-known HR and talent management software providers. (Source)
    3. Approximately 85% of surveyed business leaders utilize HR and talent management software, with the highest adoption rates in Spain, Norway, Finland, France, Italy, Colombia, and Brazil. (Source)
    4. About 54% of companies have implemented a Talent Management Program (TMP). 46% of employers lack a TMP. (Source)
    5. Among those with a TMP, 34% are focusing on development opportunities for their staff more than a year in advance, and an additional 25% are planning over two years in advance. (Source)
    6. 42% of candidates won’t apply for roles without their preferred working model. (Source)
    Talent management statistics
    1. Apart from formal TMPs, 94% of companies provide training to their staff, with only 6% not offering any training. Of those without training outside a TMP, 3% have a formal strategy elsewhere. (Source)
    2. The primary reason for having a TMP, cited by 83% of companies with one, is to retain existing staff, believing it crucial to prevent losing top talent. (Source)
    3. Companies with a TMP are 18% less likely to lose junior managers. (Source)
    4. Beyond retention, 79% of organizations with a TMP emphasize developing their people as a core organizational value. Their strategies include offering career progression opportunities, structured support for career growth, and linking performance to clear objectives and culture. (Source)
    5. In 2022, the BFSI sector had the largest market share in talent management applications. (Source)
    6. The global celebrity talent management market’s value was $15,905.84 million in 2022, and it is expected to reach $25,931.83 million by 2031, with a CAGR of 5.58% from 2022 to 2031. (Source)
    7. 69% of organizations prioritized cost and user experience when choosing a talent management application. (Source)
    8. In 2019  the global assessment services market was valued at over $6.5 billion. (Source)
    9. Nearly 85% of businesses utilize HR and talent management software, and 70% of leaders intend to increase their investment in this technology. (Source)
    10. In 2019, 45% of organizations reported that Paycor consistently met their primary talent management needs. Additionally, 30% of organizations indicated that Paycor met their primary workforce management needs. (Source)
    11. 24% of organizations stated that Ultimate UltiPro met their primary HR management system needs. 46% of enterprises reported that UltiPro also met their payroll needs. (Source)
    12. The third most common reason (72%) for implementing a TMP is to foster business growth by developing new leaders. (Source)
    13. The private and non-profit sectors are more likely to anticipate increases in recruitment and talent management budgets compared to the public sector. (Source)
    14. Only 63% of organizations gather data for staffing decisions, but only a minority use a comprehensive approach. Specifically, 21% collect data for predicting hiring needs, 16% for evaluating talent availability, and 28% for pinpointing retention problems internally. (Source)
    15. In 2022, around 30% of respondents reported complete alignment between their talent and business strategies, an increase of nearly 10% from 2021. (Source)
    16. According to a survey, companies that found their talent management highly effective were significantly more likely to outperform their competitors. (Source)
    17. German managers excel in accountability and accessibility, with 71% of employees feeling their manager is aware of their projects and 60% receiving prompt responses. However, only 32% of employees feel their manager helps set performance goals, and 38% receive support in setting work priorities. (Source)
    18. In 2019, 58% of organizations used employee referral management tools, while 88% adopted time and attendance workforce management applications. (Source)
    19. The HR technology market in India reached $1,040 million in 2023 and is projected to reach $2,170 million by 2032, growing at a CAGR of 8.3% from 2024 to 2032. (Source)
    20. Gartner predicts that by 2025, 60% of global businesses will invest in cloud-based human capital management suites due to the increasing demand for human resources and talent management solutions. (Source)
    21. Approximately 40% of companies anticipate increasing their recruitment and talent management budgets in the coming year, significantly more than in previous years, reflecting growing challenges and resource costs. (Source)
    22. Artificial intelligence (AI) is revolutionizing workplaces worldwide, with 30% of workers globally and 41% in the Asia Pacific region using AI in their daily tasks. (Source)
    23. The North American Talent Management Software Market is expected to grow at a CAGR of 10.6% from 2023 to 2030. (Source)
    Talent management statistics
    1. The market for human capital management solutions is projected to grow by $13.92 billion between 2023 and 2028, with an average annual growth rate of 9.52%. (Source)
    2. A recent study by KBV Research forecasts that the global talent management software market will reach $19.4 billion by 2030, expanding at an average annual rate of 11.4% during the predicted period. (Source)
    3. The performance management segment is expected to increase at an average annual rate of 12% from 2023 to 2030. (Source)
    4. On-premise solutions dominated the global talent management software market by deployment in 2022 and are anticipated to reach a market value of $10 billion by 2030. (Source)
    5. Opportunities for growth and development are crucial for 22% of employees. (Source)

    Talent Development (Talent Management Statistics)

    1. Nearly 40% of organizations prioritize internal talent development to fill roles, while 26% have automated certain positions in the past year. (Source)
    2. Almost 38% of organizations are actively investing in internal talent to meet their staffing needs. Upskilling current employees is the primary strategy to address recruitment challenges, and it is chosen by 60% of companies. (Source)
    3. 46% of organizations offer apprenticeships, with approximately a third providing entry-level opportunities for graduates or post-A-level students, and slightly over a quarter running internship programs. (Source)
    4. 47% of employees attribute their professional growth to the extra training and education they’ve received. (Source)

    Talent Management Software Data (Talent Management Statistics)

    1. Approximately 75% of HR and talent management software buyers review user feedback before making a purchase. (Source)
    2. The global market for talent management software was valued at $9.24 billion in 2022 and is projected to grow to approximately $31.17 billion by 2032, with a compound annual growth rate of 12.93% from 2023 to 2032. (Source)
    3. North America was the leading region in the talent management market revenue share in 2022. This region is a key market for talent management software, driven by the presence of large companies and strong adoption of new technologies. (Source)
    4. The United States and Canada primarily contributed to North America’s growth in the talent management software market. (Source)
    5. By 2032, the banking, financial, and insurance sectors are expected to surpass the IT and telecom industries in market share for talent management software, which was dominant in 2022. (Source)
    6. The global market for talent management software is projected to grow from $10.09 billion in 2024 to $25.36 billion by 2032, with a compound annual growth rate of 12.2% during 2024-2032. (Source)
    7. The increasing adoption of cloud-based platforms and mobile-based personnel management systems is a key driver of growth in the talent management software market. (Source)
    8. When considering HR and talent management software, buyers prioritize user experience, training, support services, data privacy, and reporting. (Source)
    9. Among 26 industries surveyed, property management, entertainment/media, distribution/inventory management, and investment services were the most invested in HR and talent management software. (Source)
    Talent management statistics
    1. The global talent management software market’s value was $9.24 billion in 2022, and it is expected to reach $31.17 billion by 2032, growing at a CAGR of 12.93% from 2023 to 2032. (Source)
    2. The primary goals of most respondents in purchasing HR and talent management software were to attract new customers and strengthen existing customer relationships. Additionally, 60% aimed to ensure employee and consumer safety. (Source)
    3. The Europe Talent Management Software Market is projected to grow at an 11% compound annual growth rate from 2023 to 2030. (Source)
    4. In 2022, Germany was the leading country in the Europe Talent Management Software Market, with a projected market value of $1.3 billion by 2030. (Source)
    5. Over half of respondents cited productivity improvement as the main reason for purchasing new software. Other top reasons include managing competitive pressure and outgrowing current technology. (Source)
    6. HR and talent management software buyers prefer content that helps them learn to use the software and understand its benefits. (Source)
    7. More than 35% of buyers replace their HR and talent management software due to poor integration with other systems. Additionally, 31% switch because of bugs and unreliability or finding a better alternative. (Source)

    Talent Sourcing (Talent Management Statistics)

    1. The talent acquisition segment was the largest in the talent management software market in 2023 and is anticipated to continue growing due to the demand for efficient onboarding, recruiting, and sourcing processes. (Source)
    2. In 2019, 85% of companies had adopted talent management applications for recruitment. Additionally, 88% of organizations implemented workforce management applications for time and attendance. (Source)
    3. In 2019, 92% of medium-sized organizations had already implemented talent management applications for recruitment. (Source)
    4. A survey on global talent management found that 44% of respondents used assessments during recruitment for professional positions. (Source)
    5. 63% of HR professionals in the Americas used pre-hire assessments as part of the hiring process. (Source)
    6. Organizations are increasingly offering better pay and benefits to address recruitment challenges (36%, up from 29% last year). (Source)
    7. Pay and benefits have become among the top factors in employer branding and attracting candidates. However, nearly 60% of organizations do not consider them among their primary attractors. (Source)
    8. Flexible working options are advertised for at least some jobs by 69% of organizations. It’s increasingly seen as an effective method for attracting candidates, with 54% of those facing recruitment challenges choosing to offer greater work flexibility. (Source)
    9. 66% of organizations have implemented hybrid/remote working policies, and 47% advertise jobs as ‘open to location.’ Such flexibility has helped 68% of these organizations attract and retain talent while also boosting productivity by 45% and engagement by 35%. (Source)
    10. Formal diversity policies are in place at 61% of organizations, although efforts to attract diverse candidates could be more proactive and comprehensive. One-third of organizations have achieved a more diverse workforce than the previous year. (Source)

    Employee satisfaction (Talent Management Statistics)

    1. Only 50% of employees clearly understand their work expectations. (Source)
    2. About half of workers feel exhausted, drained, or burned out due to their jobs, with stress, overwhelm, and anxiety being common experiences, emphasizing the need for organizations to prioritize mental health support. (Source)
    3. Approximately 70% of individuals find their sense of purpose through their work, highlighting the importance of aligning daily tasks with meaningful outcomes. (Source)
    4. Only 15% of frontline managers and employees report feeling connected to their purpose while on the job. (Source)
    5. Australia prioritizes employee well-being, with 62% willing to decline a promotion for their well-being, compared to 48% globally and 43% in APAC, reflecting a strong work-life balance culture. (Source)
    6. Only 12% of employees express strong approval for their company’s onboarding efforts. (Source)
    Talent management statistics

    Challenges (Talent Management Statistics)

    1. From 2021 to 2022, the percentage of organizations with established talent strategies declined from 55% to 38%. (Source)
    2. In 2023, career progression and opportunities were the most significant challenge faced by Global Business Services organizations worldwide, with nearly half of respondents citing this issue. (Source)
    3. 40% of organizations identified deficiencies in their HR processes related to talent management. (Source)
    4. Overall, 81% of organizations attempted to fill vacancies, and 77% faced challenges attracting candidates, a significant increase from 49% in 2021. (Source)
    5. Recruiting for senior and skilled roles posed the greatest difficulty at 58%, while 26% struggled with hiring low-skilled candidates. (Source)
    6. 60% reported it is now harder to retain talent than the previous year, prompting 37% to initiate retention improvement efforts, up from 29% in 2021. (Source)
    7. 80% of UK employers face challenges finding talent with the necessary skills, marking a 17-year high. (Source)
    8. Globally, 4 out of 5 employers find it difficult to secure needed talent in 2023, a slight increase from the previous year and substantially higher than the 2015 figure of 14%. (Source)
    9. Demographic shifts, including declining birth rates and increased early retirements, have exacerbated talent scarcity. (Source)
    10. In a survey, 67% of respondents identified talent scarcity as a significant obstacle to growth. (Source)
    11. 60% of APAC advertising, publishing, platform, and ad tech companies believed the advertising media industry was facing its worst talent crisis. This figure was slightly higher in the U.S. at 50% and lower in Europe, the Middle East, and Africa at 44%. (Source)
    12. In the same survey, approximately 75% of respondents acknowledged some level of talent scarcity, with 85% of ad agencies reporting this issue. (Source)
    13. One-third (33%) of people managers felt their role was not worth the stress and 40% experienced a decline in mental health after assuming a leadership position. (Source)
    14. Only 13% of HR leaders rated their talent management practices as excellent, while 70% assessed their organization’s ability to meet talent needs as mediocre. (Source)
    15. Talent management has been a key priority for only 38% of organizations in the past year, an increase from 30% in 2021 but lower than in previous years. (Source)
    16. A survey found that 76% of advertising, agency, publishing, platform, and ad tech companies attributed inadequate training and development and insufficient prioritization of talent management to talent shortages. (Source)
    17. A global survey revealed that 48% of advertising, agency, publishing, platform, and ad tech companies considered the industry to be experiencing its worst-ever talent crisis, while only 21% disagreed. (Source)
    Talent management statistics
    1. The decision-making process for HR and talent management software is time-consuming, with 65% of respondents taking three to nine months to complete a purchase and only 18% taking less than three months. (Source)
    2. An Australian study of 500 employers and 1,000 workers shows that 89% of employers and 71% of employees doubt their company’s ability to recruit skilled personnel this year. (Source)
    3. The primary issue hindering employers from attracting top talent is non-competitive salaries, identified by 30% of workers. (Source)
    4. Limited career advancement opportunities are a significant concern, with 30% of employers and 26% of workers worrying about this. (Source)
    5. Financial and accounting professionals are the most anxious about retention policies (74%), followed by business support (73%) and technology sector employees (67%). (Source)
    6. One in four executives (24%) believes meeting this year’s business demand will be challenging with the current talent model. (Source)
    7. Despite 58% seeing AI as delivering over 30% productivity gains, two-thirds are wary of implementing new technology without transforming work processes. (Source)
    8. Less than 30% of HR leaders in Australia view AI as a tool to enhance human intelligence, missing opportunities beyond automation. Only 16% of employees report job redesigns benefiting from new technologies. (Source)
    9. In Australia, 62% of businesses struggle to find talent, exceeding the global average of 50%. Additionally, 46% have difficulty retaining employees, higher than the global average of 40%. (Source)
    10. UK employers report talent shortages 3 percentage points higher than the global average of 77%. (Source)
    11. 70% of respondents acknowledge increased competition for skilled talent over the past year, with 60% indicating increased difficulty in talent retention compared to a year ago. (Source)
    12. 52% of employees believe their companies are lacking in providing clear and timely performance feedback. (Source)

    Conclusion (Talent Management Statistics)

    In conclusion, the landscape of talent management is rapidly evolving, and organizations that embrace data-driven insights will be well-positioned to attract, retain, and nurture top talent. The statistics presented in this article highlight the growing importance of talent management and its significant impact on business outcomes. By leveraging data and analytics, organizations can make informed decisions, improve employee engagement, and optimize their talent strategies. As we move towards 2024 and beyond, businesses must prioritize talent management and harness the power of data to unlock business success. By investing in data-driven talent strategies, organizations can create a workplace that fosters innovation, productivity, and long-term growth.

    Talent management statistics

    FAQ (Talent Mangement Statistics)

    Why is talent management important in statistics? (Talent Management Statistics)

    In essence, statistics provides the foundation for data-driven talent management, enabling organizations to make informed decisions, optimize performance, and ensure a sustainable talent pipeline.

    Who is responsible for talent management? (Talent Management Statistics)

    Talent management is typically a shared responsibility across various levels of an organization. While the HR department often takes the lead, it’s not solely responsible. Managers play a crucial role in identifying talent, providing feedback, coaching, and mentoring employees. They are often involved in performance reviews and succession planning.

  • Latest GoHighLevel Stripe Integration (2025): How To Set Up In 4 Easy Steps

    Latest GoHighLevel Stripe Integration (2025): How To Set Up In 4 Easy Steps

    Gohighlevel Stripe Integration
    Gohighlevel Stripe Integration: Streamline Your Business with GoHighLevel and Stripe Integration

    GoHighLevel’s popularity has soared due to its powerful tools and features.

    Integrating GoHighLevel with Stripe allows you to automate payment processing, manage subscriptions, and streamline your business operations.

    This guide will explore how to connect these two platforms and their benefits. Let’s get started!

    Ready to take your lead generation to the next level? Explore GoHighLevel Strip Integration and discover a wealth of resources to fuel your marketing success! 

    Gohighlevel Stripe Integration

    Gohighlevel 30-day free trial offer

    Streamline Your Payments with GoHighLevel and Stripe Integration (Gohighlevel Stripe Integration)

    Looking to integrate Stripe with GoHighLevel? It’s a simple process that can streamline your payment management.

    By connecting these platforms, you can create products, subscriptions, invoices, and coupons within GoHighLevel and automatically sync them with Stripe for seamless payment processing.

    Let’s dive into the integration steps.

    Visit Gohighlevel and Learn more…

    Connect Stripe with GoHighLevel: A Simple Guide (Gohighlevel Stripe Integration)

    Ready to streamline your payments? Integrating Stripe with GoHighLevel is a breeze.

    Not a GoHighLevel user yet? Start your free trial here and give it a try.

    Gohighlevel Stripe Integration

    Here’s how to connect Stripe: (Gohighlevel Stripe Integration)

    1. Log in to GoHighLevel: Access your dashboard.
    2. Navigate to Settings: Find the “Integrations” section.
    3. Connect Stripe: Click on “Stripe” and enter your API access token and other required details.

    That’s it! Your Stripe account is now connected to GoHighLevel.

    Benefits of Integration (Gohighlevel Stripe Integration):

    • Seamless Payment Processing: Accept payments directly within GoHighLevel.
    • Manage Subscriptions: Easily manage recurring payments.
    • Centralized Financial Tracking: Keep track of all customer transactions.
    Streamline Your Payments with GoHighLevel’s One-Time Charge Trigger (Gohighlevel Stripe Integration)

    GoHighLevel’s integration with Stripe offers a powerful feature: the one-time charge trigger.

    This tool automates the process of charging customers for one-time purchases, saving you time and effort.

    Here’s how to set it up (Gohighlevel Stripe Integration):

    1. Ensure Stripe Integration: Verify that Stripe is connected to your GoHighLevel account.
    2. Create a New Trigger: Go to “Automation” > “Triggers” and add a new trigger.
    3. Define the Trigger: Choose the event that will initiate the charge and set filters as needed.
    4. Set Up the Action: Select “Stripe One Time Charge” and input customer ID, description, and price.
    5. Save the Trigger: Your one-time charge trigger is now activated.

    By setting up this automation, you can streamline your payment process and provide a seamless experience for your customers.

    Visit Gohighlevel and Learn more…

    Elevate Your Business with GoHighLevel Integrations (Gohighlevel Stripe Integration)

    Ready to supercharge your GoHighLevel setup? Explore these additional integrations:

    • QuickBooks Integration: Streamline bookkeeping and track income and expenses effortlessly.
    • Ad Platform Integrations: Connect Facebook and TikTok to track ad performance directly in GoHighLevel.

    Discover more integrations and unlock the full potential of GoHighLevel.

    Visit Gohighlevel and Learn more…

    Benefits of GoHighLevel and Stripe Integration (Gohighlevel Stripe Integration)

    Integrating Stripe with GoHighLevel offers numerous advantages for your business:

    • Simplified Payment Processing: Manage subscriptions and payments with ease.
    • Time-Saving Automation: Automate one-time charges for a smoother customer experience.
    • Streamlined Finances: Monitor transactions and stay on top of your finances.
    • Enhanced Customer Experience: Provide a seamless payment process for increased satisfaction and loyalty.
    • Increased Sales and Revenue: Automate payments to avoid missed charges and boost your bottom line.

    By leveraging GoHighLevel and Stripe integration, you can streamline your operations, enhance customer experience, and drive growth for your business.

    Visit Gohighlevel and Learn more…

    Elevate Your Business with GoHighLevel and Stripe Integration (Gohighlevel Stripe Integration)

    Looking to streamline your operations and boost your bottom line? Integrating Stripe with GoHighLevel is the perfect solution.

    Key Benefits (Gohighlevel Stripe Integration):

    • Streamlined Workflows: Automate your sales and marketing processes.
    • Improved Finances: Manage payments and track transactions effortlessly.
    • Enhanced Customer Experience: Provide a seamless payment experience.
    • Increased Revenue: Streamline operations and boost sales.

    Don’t miss out on these powerful advantages. Integrate GoHighLevel with Stripe today and transform your business.

    Gohighlevel Stripe Integration

    Visit Gohighlevel and Learn more…

  • New GoHighLevel for Real Estate Agents (2025): (Ultimate CRM Solution) Latest Guide

    New GoHighLevel for Real Estate Agents (2025): (Ultimate CRM Solution) Latest Guide

    Gohighlevel For real Estate Agents

    Gohighlevel For Real Estate Agents: Elevate Your Real Estate Business with GoHighLevel

    GoHighLevel is a game-changer for real estate professionals, offering a comprehensive platform to streamline your operations and boost your sales.

    From automating sales funnels to integrating bookings and appointments, GoHighLevel has everything you need to succeed.

    Try Gohighlevel For Free Here…

    New to GoHighLevel? Don’t worry! With the right guidance, you can quickly master this powerful tool and start reaping the benefits.

    In this article, we’ll guide you through the setup process, explore key features, and share best practices for using GoHighLevel in your real estate business.

    Ready to take your lead generation to the next level? Explore GoHighLevel‘s magic links and discover a wealth of resources to fuel your marketing success! 

    Gohighlevel For real Estate Agents

    Gohighlevel 30-day free trial offer

    Try Gohighlevel For Free Here…

    GoHighLevel: Your Real Estate Business’s Secret Weapon (Gohighlevel For Real Estate Agents)

    GoHighLevel is packed with features that can revolutionize your real estate business.

    Key Features:

    1. Powerful CRM: Manage leads and clients effortlessly.
    2. Automated Marketing: Create and automate campaigns for maximum impact.
    3. Comprehensive Sales Funnel Management: Streamline your pipeline from start to finish.
    4. In-Depth Reporting and Analytics: Track performance and identify growth opportunities.

    Let’s explore these features in more detail:

    Gohighlevel For real Estate Agents

    1. CRM Integration (Gohighlevel For Real Estate Agents):

    • Centralized Lead Management: Keep track of leads at every stage of your sales funnel.
    • Seamless Integrations: Connect with popular real estate platforms for efficient lead import.

    2. Automated Marketing (Gohighlevel For Real Estate Agents):

    • Customized Campaigns: Create targeted landing pages and websites to attract potential clients.
    • Automated Follow-ups: Stay top-of-mind with automated email and SMS campaigns.

    3. Sales Funnel Management (Gohighlevel For Real Estate Agents):

    • Tailored Pipelines: Create custom pipelines that align with your sales process.
    • Performance Tracking: Use advanced reporting to identify areas for improvement.

    4. Reporting and Analytics (Gohighlevel For Real Estate Agents):

    • Customizable Dashboards: Monitor key metrics and gain valuable insights.
    • Detailed Reports: Generate tailored reports to analyze your business performance.

    Try Gohighlevel For Free Here…

    Elevate Your Real Estate Business with GoHighLevel (Gohighlevel For Real Estate Agents)

    GoHighLevel offers a range of benefits to help you streamline your operations and boost your sales:

    1. Improved Efficiency (Gohighlevel For Real Estate Agents):

    • Centralized Management: Manage leads, campaigns, and pipelines from a single dashboard.
    • Time-Saving Automation: Automate follow-ups and other tasks.

    2. Enhanced Customer Experience (Gohighlevel For Real Estate Agents):

    • Professional Marketing Materials: Create stunning emails, websites, and sales funnels.
    • Effective Communication: Communicate with clients more efficiently and provide valuable information.

    3. Increased Sales (Gohighlevel For Real Estate Agents):

    • Robust Lead Tracking: Stay organized and prioritize leads effectively.
    • Automated Follow-ups: Nurture leads and close more deals.
    • Sales Pipeline Management: Visualize your sales process and identify opportunities.

    Ready to experience the power of GoHighLevel? Let’s dive deeper into how these benefits can transform your real estate business.

    Try Gohighlevel For Free Here…

    Setting Up GoHighLevel for Real Estate: A Step-by-Step Guide (Gohighlevel For Real Estate Agents)

    Ready to transform your real estate business with GoHighLevel? Let’s get started!

    Step 1: Sign Up for GoHighLevel (Gohighlevel For Real Estate Agents)

    Gohighlevel For real Estate Agents

    Begin by creating a free account or choosing a paid plan that suits your needs.

    Step 2: Customize Your Website (Gohighlevel For Real Estate Agents)

    Gohighlevel For real Estate Agents
    • Access your dashboard and create a new website.
    • Choose from pre-designed real estate templates to get started.
    • Customize the template to reflect your brand and style.
    Gohighlevel For real Estate Agents

    Step 3: Set Up Your Pipelines (Gohighlevel For Real Estate Agents)

    • Create and customize pipelines to track leads through your sales process.
    • Connect your email and phone for seamless communication.

    That’s it! With these steps, you’ve successfully set up GoHighLevel for your real estate business.

    Gohighlevel For real Estate Agents

    Key Takeaways:

    • GoHighLevel is a powerful tool for real estate professionals.
    • Setting up GoHighLevel is straightforward and can be done quickly.
    • Leverage GoHighLevel’s features to streamline your operations and boost your sales.

    Ready to start using GoHighLevel? Sign up for your free trial today!

    Try Gohighlevel For Free Here…

    Maximizing GoHighLevel for Real Estate Success: Essential Best Practices (Gohighlevel For Real Estate Agents)

    GoHighLevel is a powerful tool for real estate professionals seeking to streamline operations and boost productivity.

    Here are key best practices to maximize its potential:

    #1. Lead Generation (Gohighlevel For Real Estate Agents)

    • Utilize Lead Capture Forms: Leverage GoHighLevel’s built-in forms to capture leads effectively.
    • Automate Follow-ups: Stay top-of-mind with automated lead nurturing campaigns.
    • Harness Social Media: Generate leads through targeted social media marketing.

    #2. Client Retention (Gohighlevel For Real Estate Agents)

    • Track Interactions: Maintain a detailed record of client interactions.
    • Automate Communication: Stay in touch with automated follow-ups and personalized campaigns.
    • Deliver Exceptional Service: Provide outstanding customer experiences to foster loyalty.

    By following these best practices, you can optimize GoHighLevel to generate leads, retain clients, and drive growth in your real estate business.

    Try Gohighlevel For Free Here…

    Streamline Your Real Estate Business with GoHighLevel’s Funnel Templates (Gohighlevel For Real Estate Agents)
    Gohighlevel For real Estate Agents

    Are you a real estate agent looking to automate your workflow? GoHighLevel offers a variety of pre-built funnel templates specifically designed for the real estate industry.

    Key Benefits:

    • Generate Leads: Attract and capture potential clients.
    • Nurture Prospects: Cultivate leads and guide them through the sales process.
    • Close Deals Faster: Streamline your sales pipeline for efficient conversions.

    With GoHighLevel’s industry-specific templates, you can find the perfect funnel to suit your business needs.

    Try Gohighlevel For Free Here…

    Gohighlevel For real Estate Agents

    GoHighLevel offers a variety of pre-built funnel templates tailored to the real estate industry.

    Key Templates (Gohighlevel For Real Estate Agents):

    • Home Valuation Funnel: Generate leads by offering a free home valuation.
    • Open House Funnel: Promote open house events and capture visitor information.
    • Buyer Lead Funnel: Attract potential buyers with a free guide.
    • Seller Lead Funnel: Generate leads from sellers seeking guidance.

    Customization at Your Fingertips (Gohighlevel For Real Estate Agents):

    Each template is customizable to align with your unique needs and goals. Easily add or remove steps, modify messaging, and customize the design to match your brand.

    Beyond Real Estate Funnels (Gohighlevel For Real Estate Agents):

    GoHighLevel also provides a range of additional templates to streamline your marketing and sales processes, including:

    • Email Templates: Create professional and engaging emails.
    • Website Templates: Design stunning websites with ease.
    • Campaign Templates: Automate your marketing campaigns for maximum efficiency.

    With GoHighLevel’s versatile templates, you can streamline your workflows and achieve your real estate goals more effectively.

    Try Gohighlevel For Free Here…

    Elevate Your Real Estate Business with GoHighLevel’s Website Templates (Gohighlevel For Real Estate Agents)
    Gohighlevel For real Estate Agents

    Looking to establish a strong online presence? GoHighLevel’s pre-designed real estate website templates offer a quick and easy solution.

    Key Benefits:

    • Professional Design: Get a stunning website without hiring a designer.
    • Mobile-Optimized: Ensure your website looks great on all devices.
    • Customizable: Tailor the templates to match your brand and business needs.

    With GoHighLevel’s website templates, you can create a professional online presence in no time.

    Try Gohighlevel For Free Here…

    GoHighLevel’s Real Estate Website Templates: More Than Just Design

    Gohighlevel For real Estate Agents

    Beyond stunning visuals, GoHighLevel’s real estate website templates offer a range of features to streamline your business:

    • Lead Capture Forms: Easily collect contact information from visitors.
    • Automated Follow-ups: Nurture leads with automated email sequences.
    • CRM Integration: Connect seamlessly with your favorite real estate CRMs.
    • Powerful Analytics: Track website traffic and measure conversion rates.

    With these features, you can maximize your website’s effectiveness and drive results.

    Gohighlevel For real Estate Agents

    GoHighLevel offers a collection of pre-designed email templates tailored to the unique needs of real estate agents. These templates streamline your email creation process, ensuring your messages are professional and effective.

    Try Gohighlevel For Free Here…

    Elevate Your Real Estate Marketing with GoHighLevel’s Email Templates (Gohighlevel For Real Estate Agents)

    GoHighLevel offers a range of pre-designed email templates to streamline your communication and boost your results.

    Here are some essential templates for real estate professionals (Gohighlevel For Real Estate Agents):

    1. Property Listing Email: Showcase new listings with captivating descriptions, images, and a clear call-to-action.
    2. Open House Invitation: Invite potential clients to your open house events with all the essential details.
    3. Newsletter: Keep your subscribers updated with news, featured listings, and a strong call-to-action.
    4. Referral Request: Encourage referrals with a compelling message and a clear call to action.
    5. Follow-Up Email: Nurture leads and build relationships with personalized follow-up messages.

    These templates are designed to save you time, enhance your communication, and drive results.

    Try Gohighlevel For Free Here…

    Unleash the Power of GoHighLevel Funnels for Real Estate Success (Gohighlevel For Real Estate Agents)

    GoHighLevel funnels can revolutionize your real estate business by driving lead generation and conversions.

    Here’s a breakdown of the process (Gohighlevel For Real Estate Agents):

    1. Attract Leads: Create compelling lead magnets like free home valuations or e-books to attract potential clients.
    2. Capture Information: Offer valuable content in exchange for contact details, building your lead list.
    3. Nurture Relationships: Build trust and stay top-of-mind with personalized content and updates.
    4. Convert Leads: Present relevant offers and guide clients towards making a purchase.

    GoHighLevel’s automation tools streamline this process, allowing you to focus on building relationships and closing deals.

    With GoHighLevel’s pre-built templates, you can easily create effective funnels and start generating results.

    Try Gohighlevel For Free Here…

    Two Powerful Funnel Examples for Real Estate Marketing (Gohighlevel For Real Estate Agents)

    Sales funnels are essential for driving leads and conversions. Here are two effective examples for your real estate business:

    1. The Lead Magnet Funnel  (Gohighlevel For Real Estate Agents):

    • Attract Leads: Offer valuable content like free guides or checklists in exchange for contact information.
    • Nurture Relationships: Follow up with leads and guide them towards your services.

    2. The Consultation Funnel (Gohighlevel For Real Estate Agents):

    • Build Trust: Offer free consultations to showcase your expertise.
    • Provide Personalized Advice: Guide clients and offer tailored recommendations.

    These funnels are proven strategies for converting leads into clients.

    Try Gohighlevel For Free Here…

    GoHighLevel for Real Estate: Frequently Asked Questions (Gohighlevel For Real Estate Agents)

    Let’s address some common questions about using GoHighLevel in your real estate business:

    How can GoHighLevel streamline my business? (Gohighlevel For Real Estate Agents)

    GoHighLevel’s CRM capabilities, automation tools, and tracking features help you manage leads, automate follow-ups, and analyze your sales performance efficiently.

    What kind of support is available? (Gohighlevel For Real Estate Agents)

    GoHighLevel offers a range of support options, including live chat and extensive knowledge base articles.

    Can GoHighLevel integrate with other real estate tools? (Gohighlevel For Real Estate Agents)

    Yes, GoHighLevel integrates seamlessly with popular lead generation tools like Facebook Lead Ads and Zillow, as well as email marketing platforms like Mailchimp and Constant Contact.

    Try Gohighlevel For Free Here…

    GoHighLevel: Your Real Estate Business’s Secret Weapon (Gohighlevel For Real Estate Agents)

    GoHighLevel is a powerful all-in-one platform designed to streamline your real estate operations.

    Key Benefits:

    • Automation: Save time and focus on what matters most by automating marketing and sales processes.
    • Targeted Campaigns: Create personalized campaigns to reach your ideal audience.
    • Real-Time Tracking: Monitor campaign performance and make data-driven decisions.
    • Enhanced Communication: Automate email, text, Facebook messages, and voice drops to stay connected with clients.
    • Robust CRM: Manage contacts, deals, tasks, and more efficiently.

    Ready to unlock the power of GoHighLevel? Start your free trial today and transform your real estate business.

    Gohighlevel For real Estate Agents

    Try Gohighlevel For Free Here…