Author: Jason

  • 63 Amazing Bible Statistics And Insights You Should Know 2025

    63 Amazing Bible Statistics And Insights You Should Know 2025

    Bible statistics

    Here are some Bible statistics you should know;

    The Bible stands as an unparalleled literary and historical monument, profoundly shaping the course of human civilization. Beyond its spiritual depth, it is a treasure trove of remarkable facts and figures. From its word count to its linguistic reach, the Bible’s statistics offer a captivating lens into the extraordinary impact of this timeless book. 

    Join us as we uncover surprising insights into the scriptures that have left an indelible mark on history.

    Key Statistics- (Editor’s Pick) Bible Statistics

    • The Bible was originally written in Hebrew.
    • The Bible is the best-selling book of all time, with over 5 billion copies sold worldwide.
    • The Bible remains a hot commodity, with over 100 million copies sold every year.
    • A staggering 90% of American homes own at least one Bible, making it ubiquitous in many households.
    • The Bible has been translated into over 2,000 languages, making it one of the most translated books in history.
    • There are 66 books in the Bible.
    • The Bible is the most quoted book in history, with its phrases, verses, and stories permeating art, literature, music, and film.
    • A remarkable 80% of Christians read the Bible daily, demonstrating its continued relevance and importance in the lives of millions worldwide.
    • ‘Amen’ is the Last word of the Bible.

     General Bible Statistics

    1.  The Bible is a product of over a thousand years of writing, with its earliest books dating back to around 1200 BC and the latest completed by 100 AD. (Source)
    2. The original Bible lacked the familiar chapter and verse divisions, making memorization challenging. The Geneva Bible introduced this structure, revolutionizing Bible study. (Source)
    3. The Bible was originally written in Hebrew. (Source)
    4. The Bible’s longest word is Mahershalalhashbaz. (Source)
    5. The Bible contains a vast number of divine promises, totaling approximately 7,147 according to “All the Promises of the Bible.” (Source)
    6. Public opinion on the Bible’s influence in American culture is divided, with nearly one-quarter believing it is excessive and over two-fifths feeling it is insufficient. (Source)
    Bible statistics
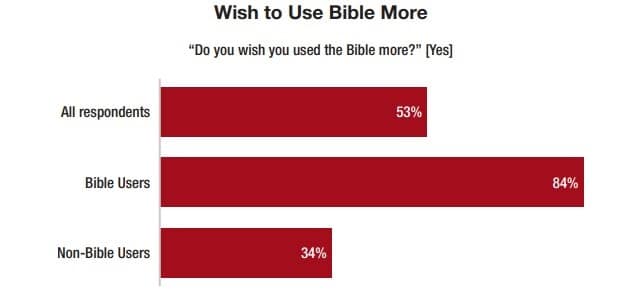
    1. More than half of American adults (53%) say yes, they do wish they
    2. read the Bible more. (Source)
    3. Most American adults desire to read the Bible more frequently, including a substantial portion of those who rarely or never engage with it. (Source)
    4. Bible ownership among practicing French Catholics has increased slightly since 1988, with two-thirds of this group owning a copy. (Source)
    5. While Bible usage is growing among Gen Z, it is declining among Millennials. In contrast, a larger proportion of Gen Zers report increased Bible use compared to those who report decreased use. (Source)
    6. A small but notable percentage of Americans find the Bible’s language challenging to connect with or uninteresting. (Source)
    7. China is currently the biggest producer of Bibles in the world with over 600 employees. (Source)
    8. Black Americans demonstrate the highest level of Bible engagement compared to other ethnic groups, with nearly one-third actively using Scripture. (Source)
    9. The New Testament is the preferred section of the Bible among most Americans surveyed, although a significant minority admit to limited Bible familiarity. (Source)
    10. With 803 occurrences, Moses, the preeminent figure in Judaism, ranks as the Bible’s third most-mentioned name, following David, Israel’s third King. (Source)
    Bible statistics
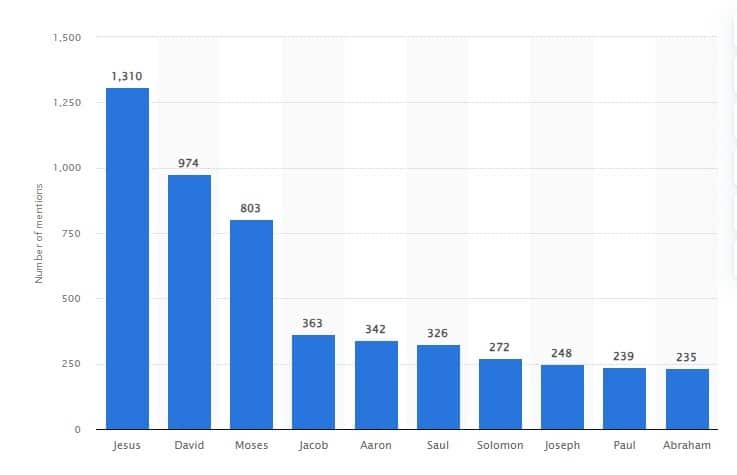
    1. The name Jesus dominates the biblical text, despite only appearing in the New Testament. (Source)
    2. A notable 71% of Americans express a keen interest in delving deeper into the Bible and the life of Jesus, indicating a substantial public curiosity about spiritual matters. (Source)
    3. The Bible’s influence spans the globe, with translations available in a staggering 3283 languages across 167 nations. (Source)
    4. A significant portion of Americans, 44%, believe the nation would decline without the Bible, while only 14% disagree. (Source)
    5. The belief in the Bible’s role in character development is prevalent among Americans, with 50% affirming its importance for children, an uptick from the previous year’s 46%. (Source)
    6. The Bible’s enduring popularity is evident in its print circulation, with an estimated 5 to 7 billion copies distributed worldwide. (Source)
    7. The Bible’s contemporary relevance is underscored by the exceptional sales of the “Message” translations, exceeding 20 million copies in just 25 years, according to Rev. Peterson’s literary agency.  (Source)
    8. Public opinion in the UK is skeptical of the Bible’s Christmas narrative, with over half doubting its historical accuracy. Conversely, less than a third find it wholly or partially believable. (Source)
    9. The biblical figure Methuselah holds the record for the longest human lifespan, reaching an astonishing age of 969 years. (Source)
    10. With annual sales surpassing 100 million copies, the Bible indisputably reigns as the world’s bestselling book. (Source)
    Bible statistics
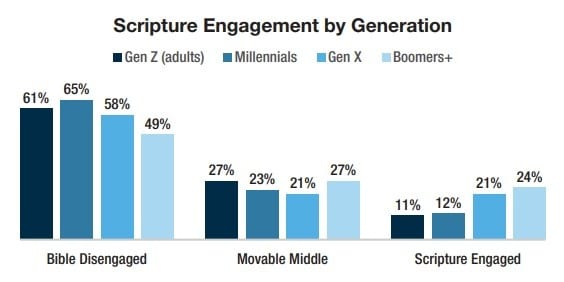
    1. Older generations (Boomers) exhibit higher levels of Bible engagement compared to younger generations (Millennials and Gen Z). (Source)
    2. Up to 65 million American adults are open to the message of the Bible. (Source)
    3. The biblical figure Methuselah holds the record for the longest human lifespan, reaching an astonishing age of 969 years. (Source)
    4. The Bible’s transformative impact is evident in the lives of many, with 58% of people reporting positive life changes attributed to its message. This represents a slight increase from the previous year and a notable surge among Gen Z adults, rising to 54%. (Source)
    5. The Bible holds the unfortunate distinction of being the world’s most stolen book. Its widespread availability in public spaces, such as hotels and hospitals, has made it an easy target for theft. (Source)

    Reading The Bible Statistics

    1. Regular Bible engagement correlates with increased spiritual engagement, as 22% of monthly readers reported heightened faith commitment and 13% indicated greater generosity. (Source)
    2. A generational divide emerges in Bible reading habits, with Millennials and Gen X demonstrating a preference for digital formats (27% and 26% respectively), compared to the significantly lower adoption rates among Boomers and Elders (9% and 2%). (Source)
    3. Traditional formats remain dominant among older Bible readers, with 91% expressing a preference for print over other mediums. (Source)
    Bible statistics
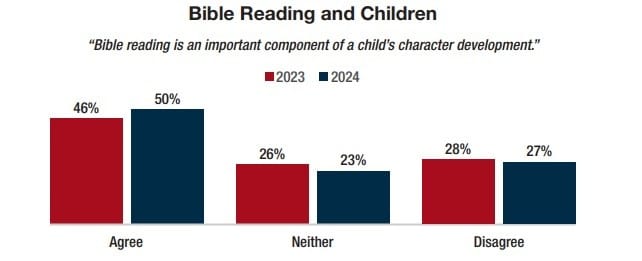
    1. In 2024, half of Americans believe Bible reading is essential for their children’s development, an increase from 46% the previous year. (Source)
    2. A consistent minority of Americans, comprising 11%, engage in daily Bible reading. (Source)
    3. Demographic trends in Bible reading reveal a stark contrast between generations, with millennials exhibiting the lowest rates and those over 70 demonstrating the highest frequency. (Source)
    4. The digital age has influenced Bible engagement, as 81% of online church attendees report independent Bible reading compared to 67% of primarily in-person attendees. (Source)
    5. Despite evolving media, the desire to read the Bible persists, with 56% of Americans expressing interest in 2019. (Source)
    6.  Structured Bible engagement is common among Americans, with 27 million following specific schedules, study plans, or programs. (Source)
    7. Personal preference dictates Bible reading for many Americans, with 31% of practicing Christians and 35% of non-practicing Christians admitting to selecting passages based on their mood. (Source)
    8. The Bible has inspired compassion for those in need, with 130 million Americans citing its influence on their support for refugees and war victims. (Source)
    9.  Marital status significantly impacts Bible engagement among American adults, with the separated demonstrating the highest likelihood (52%) and never-married individuals exhibiting the lowest (30%). (Source)
    10. The primary motivation for Bible reading among Americans is spiritual connection, with 47% citing a desire to draw closer to God. Seeking wisdom and finding comfort follow as secondary reasons, at 20% and 15% respectively. A small percentage (2%) read the Bible out of obligation. (Source)
    Bible statistics
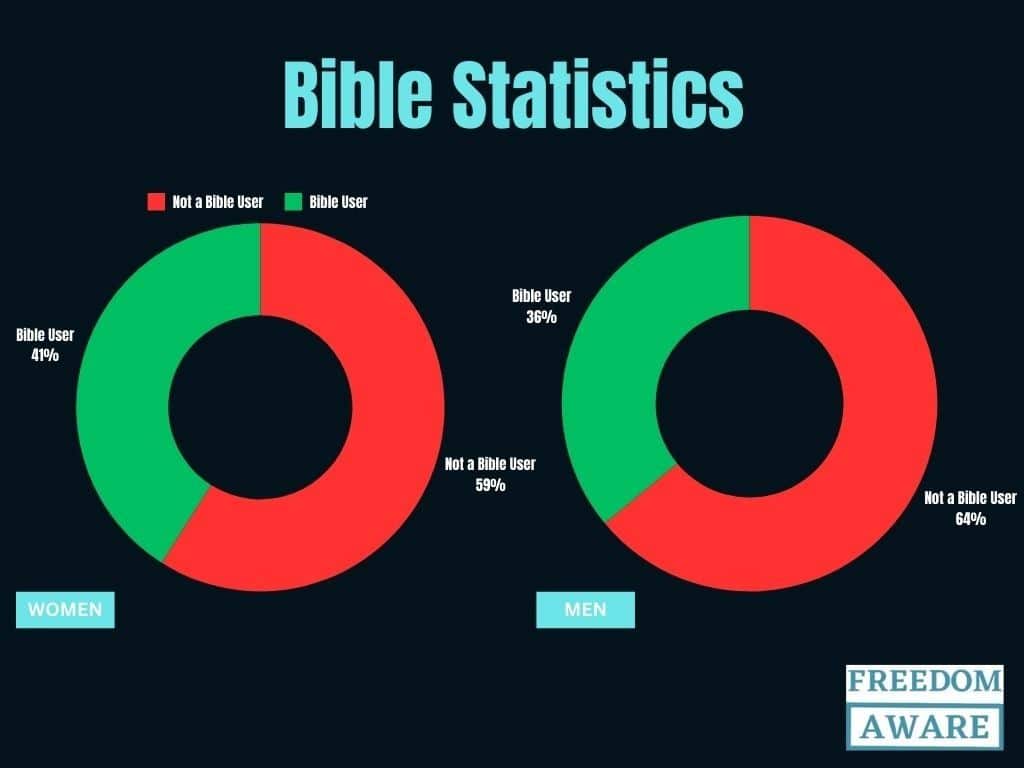
    1. Women are more engaged with the Bible than men, with 41% of women identifying as Bible users compared to 36% of men. (Source)
    2. Age correlates with Bible engagement, with older adults (Elders) displaying the highest usage (48%) and younger generations (Gen Z) the lowest (30%). (Source)
    3. Religious affiliation strongly influences Bible use, with Evangelical and Historically Black Protestants exhibiting the highest rates (70% and 68% respectively), while Catholics demonstrate lower engagement (37%). (Source)
    4. Racial disparities in Bible use are evident, with Black Americans leading at 57%, followed by Whites at 35% and Asians at 27%. (Source)

    The King James Statistics and Facts (Bible Statistics)

    1. The King James Version made its debut in 1611. (Source)
    2. The King James Version of the Bible took seven years to complete its translation process. (Source)
    3. The King James Bible is a cornerstone of the modern English language. (Source)
    4. The King James Bible is a vast compilation, containing two sections, 66 books, 783,137 words, and a staggering 3,116,480 letters. (Source)
    5. The Old Testament comprises 39 books, while the New Testament consists of 27. (Source)
    6. The Bible’s rich linguistic tapestry includes 8,674 unique Hebrew words, 5,624 Greek words, and 12,143 English terms. (Source)
    7. With 1,189 chapters and 31,102 verses, the Bible is a substantial literary work. (Source)
    8. The Old Testament contains 929 chapters and 23,145 verses, while the New Testament has 260 chapters and 7,957 verses. (Source)
    9. The structure of the Bible we know today is the result of careful organization. Cardinal Hugo de S. Caro introduced chapters in 1238, and Robertus Stephanus added verse divisions in 1551. (Source)
    10. Psalms holds the distinction of being the longest book in the Bible with 150 chapters, while Psalm 119 claims the title of the longest chapter with 176 verses. (Source)
    11. The Bible’s extremes of length are evident in Esther 8:9, the longest verse with 78 words, and John 11:35, the shortest with just two words: “Jesus wept.” (Source)
    12. The books of 3 John and Psalm 117 are the shortest in terms of word count. (Source)
    13. The Bible is a product of an extraordinary period, composed over 1,500 years by 40 diverse authors across three continents, using three languages (Hebrew, Aramaic [Chaldee], and Greek). (Source)
    14. The Old Testament is a collection of historical, poetical, and prophetic writings, with 17 books in each category (Source).
    15. The New Testament presents four Gospels, 21 letters, and the prophetic book of Revelation. (Source)
    Bible statistics

    Final Thoughts (Bible Statistics)

    The data presented here unveils a captivating portrait of the Bible – its historical depth, global reach, and enduring influence. 

    From impressive sales to linguistic complexity, the numbers tell a compelling story. Whether you approach the Bible as a scholar, a spiritual seeker, or simply an interested reader, these statistics offer a unique perspective on this timeless text. As you engage with its pages, consider the extraordinary journey it has undertaken and the profound impact it continues to make on the world.

  • 101 Latest Marketing Job Statistics And Trends 2025

    101 Latest Marketing Job Statistics And Trends 2025

    Marketing Job Statistics

    Stay ahead of the curve with the latest marketing jobs statistics and trends.

    In today’s digital age, a robust online presence is essential for businesses to thrive. Marketing professionals are the architects of this digital world, leveraging social media, content, and data to drive growth. The marketing industry is experiencing explosive growth, with job opportunities expanding rapidly. This article delves into the latest trends, salary insights, and in-demand skills to guide you through the exciting world of marketing.

    Marketing Job Statistics (Editor’s Top Picks)

    • The US Marketing Consultants industry boasted a workforce of 577,899 in 2023, demonstrating a steady 6.3% annual growth since 2018.
    • Google commands a dominant 74% share of worldwide search traffic.
    • The technology industry offers the highest salaries for marketers.
    • A report highlighted writing and analytics as the most sought-after skills for senior content marketing roles, accounting for 29% and 25% of demand respectively.
    • Marketing Managers are consistently ranked as having the most desirable role in sales and marketing.
    • Companies with CEOs who prioritize marketing as a growth driver are twice as likely to achieve annual growth rates exceeding 5% compared to their industry counterparts. 

    General Marketing Job Statistics

    1. Marketing Managers are consistently ranked as having the most desirable role in sales and marketing. (Source)
    2. The demand for chief marketing officers is expected to grow by 3% until 2032, creating about 311,600 job openings annually. (Source)
    3. Marketing manager positions were projected to increase by 6.62% in 2022. (Source)
    4. Women dominated the U.S. marketing workforce, holding 60% of positions between May 2020 and May 2021, with real estate and wellness & fitness sectors showing the highest female representation at 71% and 70% respectively. (Source)
    5. Marketing specialists are significantly more likely 48% to work for public companies rather than private ones. (Source)
    6. A significant uptick in marketing recruitment is expected in the UK, with 81% of businesses planning to hire for these roles in the next year compared to 67% the previous year. (Source)
    7. The demand for market research analysts is on the rise, with a projected 13% job growth creating 94,600 new positions annually until 2032. (Source)
    8. Approximately 358,200 individuals held marketing manager positions in 2022. (Source)
    9. 55% of marketers are contemplating switching careers due to opportunities for better compensation, benefits, and perks. (Source)
    10. The U.S. currently employs over 405,911 marketing specialists. (Source)
    11. Companies with CEOs who prioritize marketing as a growth driver are twice as likely to achieve annual growth rates exceeding 5% compared to their industry counterparts. (Source)
    12. The professional and business services industry, which encompasses marketing roles, experienced a surge in hiring, adding 74,000 new jobs in January 2024, surpassing the previous year’s monthly average. (Source)
    13. Customer service and digital marketing roles dominate job searches globally, attracting over 66,900 and 57,800 average monthly searches respectively. Project management and content-related positions follow closely behind. (Source)
    14. The project management marketing sector is poised for growth, with a projected 6% expansion leading to 34,000 new job openings annually until 2032. (Source)
    Marketing Job Statistics
    1. 86% of marketing managers work full-time, while 14% hold part-time roles. (Source)
    2. The advertising, PR, and related services industry reached a historic high in December 2023, with over 504,600 jobs. (Source)
    3. Marketers are significantly more likely to be employed by private companies, with a 72% higher probability compared to public companies. (Source)

    Core Competencies Marketing Job Statistics

    1. A bachelor’s degree in marketing provides a foundation for entry-level roles across the marketing spectrum, encompassing creative functions such as media design and copywriting, as well as analytical areas like market research. (Source)
    2. Bachelor’s degrees are the most common educational attainment for marketing managers, followed by graduate degrees and some college. (Source)
    3. Social media, SEO, and strategy emerged as the most sought-after skills in content marketing job postings within the UK in 2020. (Source)
    4. Technical degrees are the most required qualification for marketing positions in China, followed by undergraduate degrees, with master’s degrees being exceptionally rare. (Source)
    5. Business, communications, and social sciences are the predominant majors for marketing managers. (Source)
    6. Most marketing jobs in China demand between one and three years of experience, with a smaller proportion requiring three to five years. (Source)
    7. While operations and finance dominate the backgrounds of Fortune 100 CEOs, marketing is underrepresented at the C-suite level. Only 10% of Fortune 250 CEOs have marketing experience, with a mere 4% holding CMO-equivalent roles. (Source)
    8. A 2022 analysis identified writing and analytics as the most in-demand skills for senior content marketing roles, accounting for 29% and 25% of skill requirements respectively. (Source)

    Marketing Workforce Profile (Marketing Job Statistics)

    1. Women constitute the majority of marketing specialists, comprising 64.5% of the workforce, while men account for 35.5%. (Source)
    2. The BLS reports that marketing manager positions are comparatively secure during company downsizing. (Source)
    3. Similar to the overall marketing workforce, White individuals dominate the marketing specialist demographic, followed by Hispanic or Latino, Asian, and Black or African American. (Source)
    4. The marketing manager role is predominantly held by women, with 61.8% of the 557,304 marketing managers in 2022 being female. (Source)
    5. The marketing workforce is predominantly split between women (47.8%) and men (52.2%). (Source)
    6. The marketing industry exhibits a diverse ethnic composition, with White individuals representing the largest group (66.9%), followed by Hispanic or Latino, Asian, and Black or African American. (Source)
    7. Despite a higher proportion of women in marketing management roles, men exhibit a stronger preference for these positions, with a 1.69 to 1 ratio in terms of desire for the role. (Source)
    8. While women hold a majority of marketing manager positions (69%), men still constitute a significant portion (31%). (Source)
    9. The advertising and marketing segment of the UK’s creative industries employed 201,000 people in 2020. (Source)
    Marketing Job Statistics
    1. In 2023, 253 thousand people were employed in the advertising and marketing sub-sector of the UK’s creative industries. (Source)
    2. The typical marketing specialist is 36 years old. (Source)
    3. The UK advertising and market research industry demonstrates gender disparities, with more women employed overall but more men working as self-employed professionals. (Source)

    Marketing Compensation and Earnings (Marketing Job Statistics)

    1. While marketing managers across the U.S. achieved notable salaries, San Joaquin County, particularly the Lathrop and Manteca areas, offered the highest compensation. However, the majority of marketing managers were concentrated in San Francisco County, specifically the Chinatown, North Beach, and Russian Hill neighborhoods. (Source)
    2. Marketing managers enjoyed substantial earnings in 2022, with an average salary of $111,944, significantly surpassing the national average by $47,261. (Source)
    3. Compared to the national average, marketing managers exhibited a lower income inequality, as indicated by a GINI coefficient of 0.407 in 2022. (Source)
    4. The median annual salary for all marketing positions in China stands at ¥155,000, equivalent to approximately $23,310. (Source)
    5. Marketing Managers in China command an average annual salary of ¥238,717, or roughly $35,830. (Source)
    6. The average annual income for Marketing Analysts in China is ¥201,126, translating to around $30,206. (Source)
    7. Content Marketers in China typically earn an average annual salary of ¥184,126, which is about $27,711. (Source)
    8. Marketing Assistants in China have an average annual salary of ¥116,750, or approximately $17,544. (Source)
    9. Marketing specialists earned a median annual salary of $68,230 as of May 2022. (Source)
    10. Email marketing directors command salaries between $86,000 and $147,000, with an average compensation of $107,963. (Source)
    11. Marketing managers commanded a median annual wage of $157,620 in May 2023. Earnings were widely dispersed, with the lowest 10% earning less than $79,600 and the top 10% exceeding $239,200. (Source)
    12. Marketing research directors enjoy substantial earnings, with salaries ranging from $84,000 to $183,000 and an average of $124,736. (Source)
    13. The majority of marketing employers (78%) implemented salary increases in 2023, primarily driven by rising living costs (64%). (Source)
    14. Female marketing specialists experienced a narrower gender pay gap compared to the overall marketing industry, earning 96% of their male counterparts’ salaries in 2022. (Source)
    15. Marketing managers achieved substantial earnings in mid-2022, with a median annual wage exceeding $140,000. (Source)
    Marketing Job Statistics
    1. Digital marketing specialists have experienced a steady salary growth, increasing by 5% over the past five years. (Source)
    2. While New York City boasts the highest average annual wage for marketers at $80,006, Delaware emerges as the most favorable state for marketers in terms of overall lifestyle and cost of living. (Source)
    3. The technology sector stands out as the industry offering the most lucrative compensation for marketers. (Source)
    4. The average marketing salary in the UK rose by 2.6% over the last year, below the UK average of 3.5%. (Source)
    5. A gender pay gap persists in the marketing industry, with women earning 92% of men’s salaries in 2022. (Source)
    6. Content marketing directors typically earn between $60,000 and $156,000, averaging $102,374 annually. (Source)
    7. Demand generation managers typically earn between $64,000 and $119,000, averaging $86,624. (Source)
    8. Digital marketing directors command salaries ranging from $65,000 to $161,000, with an average compensation of $108,676. (Source)
    9. Brand marketing managers have a salary range of $54,000 to $116,000, with an average compensation of $78,714. (Source)
    10. Marketing managers achieved a median salary of $140,040 in 2022, with top earners reaching $198,530 and the lowest quarter earning $103,060. (Source)
    11. Product marketing managers enjoy salaries ranging from $65,000 to $135,000, with an average income of $95,940. (Source)
    12. Product marketing roles in India offer competitive compensation, with salaries typically ranging from Rs 8 to 14 lakhs per annum. (Source)
    13. Marketing professionals in the UK enjoy a salary spectrum ranging from £28,000 annually for marketing executives in medium-sized companies to a substantial £143,600 for Chief Marketing Officers in large corporations. (Source)
    14. Marketing consultants in India command substantial salaries, with earnings ranging from Rs 10 to over 30 lakhs per annum, solidifying their position as one of the highest-paid professions. (Source)
    15. Social media marketing managers are among the top earners in India’s marketing sector. (Source)
    16. Chinese marketing specialists earn an average monthly salary of ¥14,233 RMB, equivalent to approximately $1,979 USD, with a median income of ¥12,180 RMB. (Source)
    17. Individuals from working-class backgrounds face a significant salary disadvantage in marketing, earning 18.2% less than their counterparts from upper-class origins. (Source)
    18. Content marketers typically earn around $58,000 annually, though compensation can vary widely based on individual qualifications. (Source)
    19. While social media coordinator is an entry-level job, most professionals in this role make over $44,000 per year. As experience grows, average earnings can reach $51,000. (Source)
    20. SEO specialists, with their expertise in search engine optimization, typically command an average salary of around $52,000. (Source)

    Obstacles and Concerns in the Marketing Industry (Marketing Job Statistics)

    1. The advertising industry is bracing for significant job losses due to AI, with clerical roles facing a 28% reduction and sales-related roles experiencing a 22% decline by 2030. (Source)
    Marketing Job Statistics
    1. Content writer roles emerged as the most vulnerable to AI disruption, with nearly 82% of marketing professionals expressing concern. (Source)
    2. Followed by email marketing roles at 43%. (Source)
    3. The marketing industry is grappling with a widespread skills shortage, affecting 87% of employers. (Source)
    4. The UK marketing landscape has been challenged by skills shortages, affecting 80% of employers and leading to a 40% productivity decline in the past year. (Source)
    5. AI tools have significantly reduced the longevity of specialized skills, according to 53% of marketing employers. (Source)
    6. The healthcare industry experienced the steepest decline in marketing job postings, with a 60% drop on LinkedIn in 2023 compared to the previous year. (Source)
    7. Financial services and tech marketing roles also saw steep declines, with 56% and 52% fewer jobs being posted, respectively. (Source)

    Marketing Job Opportunities By Industry (Marketing Job Statistics)

    1. Computer Systems Design, Management consulting, and Advertising/PR firms are the primary employers of marketing managers. (Source)
    2. The number of marketing manager positions is projected to reach 381,900 by 2032. (Source)
    3. Organizations are increasingly relying on contract professionals, particularly in digital marketing, with 68% of managers planning to expand their use of these workers. (Source)
    4. The professional, scientific, and technical services sector employs a quarter of all marketing managers, highlighting its significance in the industry. (Source)
    5. The US Marketing Consultants industry has experienced rapid growth, with a workforce of 577,899 in 2023 and a consistent 6.3% annual increase since 2018. (Source)

    Marketing Job Prospects Across Regions (Marketing Job Statistics)

    Europe

    1. The UK’s advertising and marketing sector experienced significant growth between 2011 and 2021, with employment numbers rising from 148,000 to 225,000. (Source)
    2. The UK experienced a decline in sales, marketing, and related professionals between Q3 and Q4 2023, dropping from 947,900 to 917,900. (Source)
    3. The number of market associate professionals in the UK saw minimal growth between Q3 and Q4 2023, rising slightly from 203,400 to approximately 203,700. (Source)
    4. The UK job market experienced a significant downturn in the third quarter of 2022, with a 2.6% decrease in open positions, marking the largest quarterly decline since early 2020. The total number of vacancies fell to 1,266,000. (Source)
    5. A UK survey revealed a higher propensity for remote hiring within the marketing industry, with 43% of employers adopting or planning to adopt remote work compared to the national average of 28%. (Source)
    6.  In the fourth quarter of 2022, 192,000 people in the UK worked in advertising and market research. (Source
    7. UK marketing budgets expanded by an average of 5% in 2023. (Source)
    8. On average, marketing accounted for 13% of company budgets in the UK during 2023. (Source)

    North America

    1. The US advertising agency sector experienced significant growth in 2022, with employment numbers surging 10.4% from the previous year to surpass 195,280 employees. (Source)
    Marketing Job Statistics
    1. The number of US marketing manager positions is projected to increase by 7% between 2022 and 2032. (Source)
    2. U.S. public relations firms experienced a significant employment surge of nearly 14%, reaching a total of 62,370 employees. (Source)

    South America

    1. Editorial and digital marketing roles dominated job search trends in Brazil between February 2022 and 2023, averaging around 444 and 377 monthly searches respectively. (Source)
    2. Account Manager, Ad Ops Specialist, and Associate Advertising Manager emerged as the most sought-after marketing positions in Latin America, followed by Community Builder, Content Manager, and Copywriter. (Source)

    Asia-Pacific

    1. Marketing resumes ranked second in popularity in Singapore, accounting for 1.7% of all searched resumes. (Source)
    2. The marketing consulting industry is poised for significant growth, reaching a projected value of $343.5 billion by 2025, making it a highly lucrative sector for marketing professionals in India. (Source)
    3. Indian companies recruited 4,556 marketing professionals in May 2023. The year 2020 witnessed fluctuating employment trends within the marketing sector, with a downturn in April due to the COVID-19 pandemic followed by a subsequent recovery. (Source)

    In-Demand Marketing Jobs (Marketing Job Statistics)

    So, which marketing jobs are in the highest demand? Here are some of the most sought-after positions:

    Digital Marketing Manager: With the rise of digital marketing, companies are looking for professionals who can develop and execute online marketing strategies.

    Content Marketing Specialist: As content marketing continues to grow in importance, companies need professionals who can create engaging, high-quality content that resonates with their target audience.

    SEO Specialist: With search engines constantly evolving, companies need experts who can optimize their websites and content for maximum visibility.

    Social Media Manager: As social media becomes an increasingly important channel for customer engagement, companies are looking for professionals who can develop and execute social media strategies.

    Skills Required for Marketing Jobs (Marketing Job Statistics)

    To succeed in the marketing industry, professionals need to possess a range of skills, including:

    Data Analysis: The ability to collect, analyze, and interpret data is crucial for making informed marketing decisions.

    Content Creation: Marketing professionals need to be able to create high-quality, engaging content that resonates with their target audience.

    Digital Literacy: With the increasing importance of digital marketing, professionals need to be proficient in digital tools and platforms.

    Communication: Effective communication is essential for marketing professionals, who need to be able to convey their message to their target audience.

    Conclusion (Marketing Job Statistics)

    The marketing industry is experiencing a period of rapid transformation, driven by technology and shifting consumer behaviors. This presents an exciting opportunity for professionals who can adapt and embrace new trends. By staying informed about the latest job statistics and emerging skills, marketers can position themselves for success in this dynamic and rewarding field.

    Marketing Job Statistics

    FAQ (Marketing Job Statistics)

    Is there a demand for marketing jobs?

    Yes, there is a strong demand for marketing jobs. The marketing landscape is constantly evolving, driven by technological advancements and changing consumer behaviors. This creates a consistent need for skilled professionals who can navigate these complexities.

    Is There Money in a Marketing Career?

    Yes, there can be significant earning potential in a marketing career. Marketing offers a vast array of opportunities, and with dedication and career progression, it can also be a lucrative field.

    Which marketing field is the best?

    There’s no definitive “best” marketing field. The ideal choice depends largely on your interests, skills, and career goals. Each area offers unique challenges and rewards.

  • 93 Best Sales Enablement Statistics 2025: Unlocking The Power of Data-Driven Sales Statistics

    93 Best Sales Enablement Statistics 2025: Unlocking The Power of Data-Driven Sales Statistics

    sales enablement statistics

    Below, are some sales enablement statistics you should know;

    In today’s fast-paced sales landscape, staying ahead of the competition requires more than a solid sales strategy – it demands a data-driven approach. Sales enablement has emerged as a crucial component of modern sales organizations, empowering teams to sell more effectively and efficiently. But what does the data say about the impact of sales enablement on business outcomes? 

    In this article, we’ll delve into the latest sales enablement statistics, uncovering key trends, benchmarks, and insights that will help you optimize your sales enablement strategy and drive revenue growth.

    Key Sales Enablement Statistics (Editor’s Pick)

    • Organizations leveraging sales enablement technology are twice as likely to harness analytics to optimize sales strategies.
    • 23% of companies with a formal Revenue Enablement program support Customer Success, 18% support presales, and 15% support marketers, among other functions. Additionally, 25% have enablement reporting to the Chief Revenue Officer (CRO).
    • 70% of consumers prefer personalized experiences using their data.
    • 81% of organizations see sales enablement as a revenue team efficiency booster.
    • The global sales enablement platform market is projected to grow from $3.41 billion in 2023 to $12.7 billion by 2030.
    • 92% of executives credit sales enablement investments for boosting sales, and 84% plan continued or increased spending in this area.
    • 90% of organizations now have a dedicated sales enablement team, reflecting a 20% annual growth and increased industry recognition. 

    General Sales Enablement Statistics

    1. The sales enablement technology market is predicted to reach more than $3 billion by 2026. (Source)
    2. The global sales enablement platform market, valued at $3.41 billion in 2023, is poised for rapid growth, reaching $12.7 billion by 2030 at a 19.70% CAGR. (Source)
    3. A personalized shopping journey significantly influences customer loyalty, with 60% of consumers expressing intent to make repeat purchases. (Source)
    4. While critical for optimization, analytics visibility into effective sales enablement practices is limited to just 43% of organizations, leaving a substantial gap in data-driven decision-making. (Source)
    5. The industry is predicted to grow to $11 billion by 2032. (Source)
    6. A vast majority (over 90%) of companies have implemented some form of enablement program. (Source)
    7. Despite the growing emphasis on customer retention amid economic challenges, a surprising 79% of B2B companies overlook equipping their teams for customer success. (Source)
    8. Only 10% of sales enablement content drives a surprising 50% of all prospect interaction. (Source
    9. A significant portion of B2B companies (65%) have adopted value-based selling (VBS). To quantify the value proposition, 33% of these businesses utilize ROI calculators when interacting with economic buyers and influencers. (Source)
    10. Customer experience is paramount in today’s market. A significant 80% of customers equate its importance to product or service quality. (Source)
    11. Staff compensation and benefits represent the largest allocation within sales enablement budgets. This trend is projected to persist, with nearly half of sales enablement leaders anticipating increased budget and staffing in the coming year. (Source)
    12. Staff compensation and benefits represent the largest allocation within sales enablement budgets. This trend is projected to persist, with nearly half of sales enablement leaders anticipating increased budget and staffing in the coming year. (Source)
    13. A strong majority (63%) of individuals expressed a higher propensity to share personal data when they perceive substantial value in return. Fostering trust is equally crucial in this exchange. (Source)
    14. A positive experience can drive over a third (36%) of consumers back to a brand, regardless of price or convenience. (Source)
    15. 70% of consumers accept personalization if brands use their data. (Source)
    sales enablement statistics
    1. A resounding 75% of business leaders believe personalized interactions are indispensable for digital platforms. (Source)
    2. A vast majority (80%) of businesses claim to employ first-party data to create personalized customer journeys. (Source)
    3. Only 25% of businesses report success with omnichannel personalization investments. (Source)
    4. With an average of 9.2 sales interactions per deal, sales teams must be well-versed in market, product, customer, and competitor landscapes. (Source)
    5. Overwhelmingly, 75% of buyers express a preference for virtual interactions with salespeople and the autonomy to explore products independently. (Source)
    6. Sales enablement is predominantly managed by the sales team (38%), with marketing providing additional support. Nevertheless, there is clear evidence of growing cooperation between sales and marketing, as demonstrated by the 77% of respondents reporting collaborative efforts. (Source)
    7. People & Teams represents the most significant opportunity for growth, with an average rating of 3.26 placing organizations between Standard and Advanced maturity levels. Only 10% of respondents achieved an Advanced rating in this area. (Source)
    8. Over 90% of sales representatives surveyed reported a dramatic shift in buyer behavior within the past year and a half. (Source)
    9. According to 88% of U.S. consumers, the amount of personal information they divulge is contingent upon their trust in a company. (Source)
    10. Sales enablement generally affects 2.5 stages of the buyer’s journey, excelling in the early stages. Though less prominent in customer advocacy or post-loss contexts, its significance in post-sale and service aspects is undeniable. (Source)
    11. Sales enablement is predominantly overseen by the Chief Sales Officer (CSO) in 35% of companies. A further 25% of organizations assign this role to Chief Revenue Officers (CROs) or Chief Growth Officers (CGOs), indicating a trend towards increased collaboration between sales and marketing. (Source)
    12. Consumers are split on whether brands act in their best interest: 37% trust businesses to keep their data secure and use it responsibly, while another 37% do not trust online retailers with their data. (Source)
    13. 23% of companies with a formal Revenue Enablement program support Customer Success, 18% support presales, and 15% support marketers, among other functions. Additionally, 25% have enablement reporting to the Chief Revenue Officer. (Source)
    14. A surprising 79% of B2B companies overlook customer success enablement, despite the growing emphasis on customer retention amidst economic challenges. (Source)
    15. Currently, 35% of sales enablement teams also fulfill marketing responsibilities, but this dynamic is likely to evolve. A majority of CSOs anticipate sales enablement supporting marketing within the next three years, while nearly half foresee its expansion into customer success. (Source)
    16. A clear majority (62%) of sales training is dedicated to personal selling skills like closing deals and negotiation, eclipsing the focus on customer understanding, ICPs, and personas (54%). This data implies a sales culture prioritizing interactions over product expertise, as evidenced by only 33% emphasizing product knowledge. (Source)
    sales enablement statistics
    1. A significant 90% of organizations now have a dedicated sales enablement team, reflecting a substantial 20% annual growth. This trend underscores the increasing recognition of the critical role of sales enablement. (Source)
    2. More than half of respondents (54%) intend to invest in AI-powered meeting scheduling tools to help salespeople optimize their time and pinpoint optimal meeting times. (Source)
    3. A substantial 65% of survey participants agree that the evolving buyer landscape necessitates fresh sales methodologies. To thrive in this environment, businesses must engage customers on multiple platforms as buyers curate their journeys. (Source)
    4. While direct/field (63%) and inside sales reps (59%) continue to be the primary beneficiaries of sales enablement, the function is expanding to support a broader range of roles. Notably, post-sales functions like account management (54%) and services/customer success (18%) are receiving increased attention. (Source)

    Sales Enablement Statistics on Performance

    1. Survey results confirm the powerful impact of sales enablement on business outcomes, with 68% of respondents highlighting the necessity of evolving sales enablement strategies. (Source)
    2. Companies equipped with sales enablement programs significantly outperform their counterparts, boasting a 49% win rate on forecasted deals compared to the 42.5% win rate of those without such programs. (Source)
    3. Sales enablement efforts primarily focus on boosting sales productivity (28%), ensuring consistent rep performance (23%), and optimizing overall revenue (18%). (Source)
    4. A majority of companies (62%) rate sales enablement as highly effective in cross-functional corporate initiatives. Furthermore, sales enablement excels at aligning initiatives with sales goals, with a strong above-average rating of 59%. (Source)
    5. Tenure is a critical factor in sales enablement effectiveness. Teams with a track record of over two years in sales enablement outperform their counterparts by a significant five percentage points in terms of win rate. (Source)
    6. A majority of companies, representing 87% across all scales, are committed to preserving or growing their sales enablement budgets in the next year. (Source)
    7. Sales enablement platforms deliver a significant boost to win rates, with users outperforming their counterparts by a substantial seven percentage points. (Source)
    8. A vast majority of executives (92%) affirm that sales enablement investments have positively impacted sales performance this past year. This confidence is reflected in the 84% of executives planning to sustain or expand these investments in the upcoming year. (Source)
    9. Companies that plan to sustain or grow their sales enablement budgets enjoy a four percentage point higher win rate compared to those considering budget reductions. This data underscores the strategic importance of sales enablement, particularly in challenging economic climates. (Source)
    10. Sales enablement is crucial as it prepares salespeople to use tools and resources for virtual engagement effectively. Research has shown that sales enablement functions that manage sales technology achieve win rates six percentage points higher than those that do not. (Source)
    11. Sales enablement is a key driver of efficiency for revenue teams, with 81% of organizations recognizing its positive impact on streamlining sales processes. (Source)
    12. Leading-edge companies are expanding their focus from traditional sales enablement to a comprehensive revenue enablement strategy. (Source)
    13. Sales reps dedicate less than half (35.2%) of their time to active selling. (Source)

    Sales Enablement Technology Benchmarks (Sales Enablement Statistics)

    1. Enablement technology frees up nearly two extra workdays per week for sales reps to focus on customers, by automating content management and search, boosting productivity by 80%. (Source)
    sales enablement statistics
    1. Sales enablement technology is adopted by 56% of companies, with another 14% planning to implement it soon. (Source)
    2. While 58% of companies have a sales enablement function, only 19% leverage technology, hindering their ability to scale training and coaching for larger sales teams. (Source)
    3. MindTickle’s sales readiness platform accelerates sales rep onboarding by 60% through remote development and coaching, boosting overall performance. (Source)
    4. Less than half of executives grasp the potential of robotics and AI in enhancing customer experience, despite growing consumer expectations for seamless, personalized interactions. (Source)
    5. Digital sales rooms and other sales engagement tools correlate with a 46% higher win rate over the past year. (Source)
    6. Companies without sales enablement tools struggle with client retention, with 36% facing challenges in this area. (Source)
    7. Enablement technology empowers sales reps with quick access to information, boosting confidence and knowledge. Ninety-seven percent of users report improved client interactions, while 68% appreciate reduced uncertainty. (Source)
    8. Sales enablement technology doubles the likelihood of gaining insights into effective sales practices through analytics, driving data-driven improvements. (Source)
    9. Sales teams juggle an average of six different tools, highlighting the complexity of modern sales technology stacks. (Source)
    10. C-suite leaders prioritize sales enablement tools as the top tech investment for boosting sales productivity, with 55% supporting this view. (Source)
    11. Sales enablement technology adoption is on the rise, with a 5% increase to 65% of organizations using these tools this year. (Source)
    12. To streamline operations, 43% of companies plan to consolidate their technology stacks within the next 18 months. (Source)
    13. The MarTech market is booming, expanding from $413.6 billion in 2023 to a projected $2.1 trillion by 2032, with a rapid growth rate of 19.4% annually. (Source)
    14. As technology advances, customer expectations for personalized experiences are rising, with 73% demanding greater customization. (Source)
    15. AI-powered chatbots are a popular choice for enhancing customer experience, with 47% of respondents favoring them for quick query resolution. (Source)

    Sales Enablement Hurdles (Sales Enablement Statistics)

    1. Insufficient data, poor training, and talent mismatches contribute to nearly half of sales reps missing quotas. (Source)
    2. Privacy concerns hinder personalized experiences, with 43% of U.S. consumers resisting data collection. (Source)
    3. Lack of staff and resources is also seen as one of the biggest barriers to sales enablement maturity as cited by 52% of salesforce. (Source )
    4. Many sales enablement teams struggle to demonstrate value due to limited data analysis and ineffective communication of impact. (Source)
    5. Sales reps face a trifecta of challenges: intense competition, economic headwinds, and customer retention pressures. (Source)
    6. Sales enablement significantly impacts sales cycle time, quota attainment, and win rates, yet 42% of companies lack such programs. (Source)
    7. Transparency in data usage builds trust, with 71% of customers more likely to share personal information with companies that clearly explain its purpose. (Source)
    sales enablement statistics
    1. Many consumers perceive misuse of personal data, with over half believing companies fail to leverage it beneficially. (Source)
    2. Access to accurate, unified customer data is a major hurdle for personalization, with many organizations struggling to provide a single source of truth. (Source)
    3. Concerns over AI ethics are prevalent, with customers demanding human oversight in AI decision-making. (Source)
    4. Trust is paramount in the age of AI, with customers expecting companies to maintain ethical standards. (Source)
    5. A shortage of skilled sales enablement professionals with expertise in technology, data, content, and operations is hindering industry progress. (Source)
    6. Inconsistent customer experiences across departments frustrate consumers, with frequent information repetition being a common pain point. (Source)
    7. Access to content is a major challenge for sales reps without enablement technology, impacting productivity and knowledge sharing. (Source)
    8. Increasing revenue, effective coaching, and accelerating sales cycles are top priorities for organizations. (Source)
    9. Poor onboarding disrupts operations, leading to lost opportunities and hindered growth, according to 88% of respondents. (Source
    10. A significant gap exists between customer needs and employee understanding, with less than half of consumers feeling understood by sales reps. (Source)
    11. Limited staffing and resources are major obstacles to achieving sales enablement maturity. (Source)
    12. While budgets exist, companies often struggle to implement sales technology due to cultural barriers and skill deficiencies. (Source)
    13. Consumers are increasingly protective of their personal information. (Source)
    14. Customers desire personalized experiences but often encounter impersonal interactions, highlighting a gap in customer-centric strategies. (Source)

    Sales Enablement Earnings (Sales Enablement Statistics)

    1. Sales enablement specialists earn an average base salary of $84,365, with total compensation reaching $106,973. (Source)
    2. Sales enablement certifications boost earnings by $9,733 annually, while non-managerial roles earn $17,275 less than the average. (Source)
    3. Sales enablement managers earn an average base salary of $105,330, with total compensation reaching $146,791. (Source)
    4. A majority (61.3%) believe sales enablement salaries undervalue the role’s business impact. (Source)
    5. Additional earnings for sales enablement roles average $38,877 through bonuses and incentives. (Source)
    6. U.S. sales enablement professionals earn an average of $119,689 annually, with a range from $90,000 to $179,144. (Source)
    7. Over two-thirds of respondents receive bonuses or commissions. (Source)
    8. The average annual sales enablement salary is $100,390, with total compensation reaching $139,267. (Source)
    sales enablement statistics

    Conclusion (Sales Enablement Statistics)

    Sales enablement is a critical component of a successful go-to-market strategy. With 87% of top cloud companies investing in this function, it’s evident that sales enablement is a key differentiator. By optimizing sales processes and equipping reps with the necessary resources, businesses can achieve substantial gains in revenue and win rates.

  • 65+ Top QR Code Statistics 2025: A Growing Trend In Mobile Interaction

    65+ Top QR Code Statistics 2025: A Growing Trend In Mobile Interaction

    QR Code Statistics

    (QR Code Statistics) QR codes are here to stay: Here, are some of the latest QR code statistics; 

    I’ll never forget the thrill of scanning my first QR code. It felt like discovering a hidden universe of information. These tiny squares have become an everyday part of our lives. Incredible, isn’t it? QR code use has exploded over the past year, shooting up by 96%! It’s mind-boggling.

    From being used to track vehicles during manufacturing to becoming one of the biggest marketing trends of the decade, QR codes have come a long way. You can’t escape them these days.

    Let’s explore some of the latest QR code statistics.

    QR Code Statistics (Editor’s Pick)

    • Almost nine of ten smartphone owners have scanned a QR code at least once.
    • Over a third of shoppers won’t buy if they can’t pay with a QR code.
    • Major social media platforms use built-in QR codes to add friends by scanning unique codes.
    • QR code payments are booming, with a global market value of $10.28 billion in 2022, and are expected to grow rapidly.
    • China is the QR code king, with billions of devices using them for payments.
    • QR code use in the U.S. is on the rise, with millions of households and consumers adopting the technology.
    • QR codes are driving big business, with billions of coupons redeemed in 2022 alone.
    • QR codes are taking the world by storm. Over 26 million scans were recorded across more than 50 countries.
    QR Code Statistics

    What Is A QR Code? A QR code (Quick Respond Code) is a type of barcode that a digital device can scan. It looks like a square with a pattern of black and white squares. Unlike traditional barcodes, QR codes can store much more information, such as website links, contact details, files, images, audio, videos, and more.

    It’s a quick and easy way to access information or take action with your smartphone.

    QR Code Statistics, Usage, Trends, and Forecasts

    1. Black is the most common color for QR codes, preferred by 85% of users. (Source)
    2. Global QR code data reveals 26.95 million scans from over 50 countries. (Source)
    3. With a 26% increase from 2020, almost 89 million Americans scanned QR codes via their smartphones in 2022. This upward trajectory is set to endure, as estimates predict the US user base to surpass 100 million by 2025. (Source)
    4. A vast majority, 86.66%, of smartphone users have experienced scanning a QR code, with 36.40% engaging in this activity weekly. Moreover, 46.81% of individuals perceive QR codes as facilitating a touchless lifestyle. (Source)
    5. China reigned supreme in QR code payment adoption in 2022, boasting approximately 10 billion mobile devices equipped with this technology. (Source)
    6. The survey revealed a marked disparity in QR code security perceptions, with 42.55% of participants feeling safest scanning at restaurants, bars, or cafés, while only 19.4% shared this sentiment for fitness centers. (Source)
    7. A significant portion of consumers, representing 38.99% of respondents, expressed a desire for expanded QR code utilization going forward. (Source)
    8. 57% of consumers prefer merchants’ digital payment options while shopping from stores (Source)
    9. The data revealed that 67% of participants found QR codes to simplify their lives. (Source)
    10. More than 30% of Italian galleries and museums currently offer QR code services, with an additional 40% planning to implement them in the future. (Source)
    11. QR codes have been integrated into the signage of Abu Dhabi. (Source)
    12. Over 90% of iOS devices and 85% of Android devices come with pre-installed QR code scanners. (Source)
    13. QR codes are now utilized by half of all restaurants in the United States. (Source)
    14. According to Bitly, downloads for QR codes skyrocketed by 750% in the last 18 months. (Source)
    15. QR codes play an instrumental role in making AR experiences available to users. The global AR and VR market is projected to grow by $162.71 billion by 2025. (Source)
    16. Google Chrome is in the process of creating a feature for its Chrome Canary browser that allows users to share web pages by generating QR codes. (Source)
    17. QR code payments in Japan have grown, reaching nearly 15 trillion yen in transaction value. (Source)
    QR Code Statistics
    1. QR code creation skyrocketed by 283% in 2022 compared to 2021 and increased by an additional 43% the previous year. While global QR code scans surged by nearly 60% in the same period. (Source)
    2. Website QR codes dominate the market, comprising a substantial 49% of all QR codes generated within the past year. (Source)
    3. The prospect of increased QR code use resonates with 75% of adults. (Source)
    4. This trend is more pronounced among younger age groups, with 82% of 18-44-year-olds expressing interest, while the figure drops to 64% for those aged 45 and above. (Source)
    5. Similar to barcodes, QR codes incorporate error correction, allowing for data recovery even when up to 30% of the code is damaged or obscured. (Source)
    6. While 54% of 18-24 year-olds have frequently used marketing-related QR codes, this figure drops to 48% for 30-44 year-olds and further declines to 44% for those aged 45-64. (Source)
    7. Major social media platforms use built-in QR codes to add friends by scanning unique codes. (Source)
    8. In Latin America, QR code transaction values were projected to surpass $1.4 billion by the same year. (Source)
    9. A staggering 5.3 billion coupon codes were redeemed through QR codes in 2022. (Source)
    10. Scantrust SA forecasted a robust 67% of Singaporeans were utilizing QR codes for mobile payments in 2018, anticipating an explosive surge in adoption during the following years. (Source)
    11. The year 2019 saw the introduction of JPQR, a uniform QR code for all payment providers in Japan. (Source)
    12. As stated by Peabody, Mezze and the entire Boqueria chain adopted QR code menus in place of printed ones during the COVID-19 crisis. (Source)
    13.  The global QR code payment market experienced significant growth, expanding from a valuation of $8.07 billion in 2020 to a projected $35.07 billion by 2030. This represents a robust compound annual growth rate (CAGR) of 16.1% from 2021 to 2030. (Source)
    14. A 2021 survey found that 45% of US shoppers had used a marketing QR code in the past three months, with the highest usage among 18-29-year-olds. Additionally, 59% believed QR codes would become a permanent feature of mobile phone usage. (Source)
    QR Code Statistics
    1. QR codes can encode a maximum of 2953 bytes, which translates to 4296 alphanumeric, 7089 numeric, or 1817 Kanji (JIS X 0208) characters. (Source)
    2. The global QR code payment market experienced rapid growth, reaching a valuation of USD 10.28 billion in 2022. This upward trajectory is projected to continue, with an anticipated compound annual growth rate (CAGR) of 17.03% extending through 2028. (Source)

    QR Code Adoption Across Nations (QR Code Statistics)

    1. A substantial majority of consumers in China (81%), Hong Kong (78%), and Singapore (74%) have significantly increased their QR code usage. (Source)
    2. In Spain, QR code usage has increased for 60% of consumers, while 25% maintain their previous usage levels. (Source)
    3. A majority of consumers (67%) perceive QR codes as user-friendly, facilitating easy access to information. This trend is consistent across most markets, with notable exceptions in Denmark and the United States, where agreement levels dip to 50% and 44%, respectively. (Source)
    4. Approximately 50% of Italians and Spaniards intend to increase their QR code usage, contrasting sharply with the more hesitant attitudes of Germans and French consumers. (Source)
    5. Twenty percent of European consumers expressed uncertainty about increased QR code usage in the future. (Source)
    6. 16% of males and 10% of females used smartphones to scan QR codes for information. (Source)
    7. In 2020, MobileAssist, a Bahamian financial technology firm, teamed with Super Value to allow customers to pay for groceries with QR codes. (Source)
    8. QR code usage in the Bahamas is growing, with over 90,000 downloads and 7,500 registered users of MobileAssist’s app. (Source)
    9. The Central Bank of the Bahamas introduced a digital Bahamian dollar using QR codes for payments and fund transfers. (Source)
    10. AML Foods partnered with Kanoo to introduce QR code payments in their stores. (Source)
    11. Mercado Pago and TodoPago are the leading QR code payment platforms in Argentina. (Source)
    12. Mercado Pago achieved a significant milestone, processing 8.2 million QR code transactions within its first year of operation. By March 2019, the platform had already garnered a user base of 3 million. (Source)
    13. TodoPago boasts a user base of 1.5 million buyers and 600,000 merchants. Its strategic focus on QR codes propelled app downloads to triple in 2018, and the platform continues to expand its reach. (Source)
    QR Code Statistics
    1. A strong majority of 80% of US users express confidence in QR codes. (Source)
    2. QR codes facilitate efficient inbound travel to the Bahamas. (Source)
    3. QR code payments in Argentina witnessed rapid growth, with a user base expanding from 3% of adults in 2018 to a projected 24% in 2022. (Source)
    4. Upon acceptance, international students bound for the Bahamas receive a unique QR code for expedited entry. (Source)
    5. Consumers primarily use food QR codes to access product details (57%), followed by brand websites (43%). Other popular uses include product or company information (34%), recipes (25%), and interactive games (9%). (Source)
    6. A significant portion of Canadians, 36%, shun retailers lacking contactless payment options, while half of the population consciously restricts purchases to stay within contactless spending limits. (Source)
    7. According to GSMA 2020, Mexico’s overall annual QR code digital payment transaction growth rate is predicted to be 18.8% between 2020 and 2024. (Source)
    8. Over half of Mexican consumers reported increased QR code usage, while roughly a quarter maintained previous levels. The country’s population is notably enthusiastic about future QR code adoption. (Source)
    9. In India, the transaction value of QR code payments is expected to rise from $62 billion in 2022 to $125 billion in 2026. This is driven by a national QR code standard and reduced cash usage. (Source)
    10. Predictions for 2020 indicated that QR code scanning would reach 11 million U.S. households. (Source)
    11. The number of U.S. smartphone users scanning QR codes is projected to increase by 16 million between 2022 and 2025. (Source)
    12. Contactless payments in the U.S. experienced a dramatic 150% increase since March 2019. This surge directly contributed to an 11% rise in QR code adoption since the onset of the pandemic. (Source)
    13. Over a third of consumers strongly prefer QR code payments and will abandon a purchase if this option is unavailable. (Source)
    14. Bharat QR code acceptance surged past 4.8 million in India by September 2022, with the goal of unifying QR code payments across all merchant locations. (Source)
    15. India holds the second position with a staggering 1,101,723 million QR code scans. (Source)
    16. Two-fifths of India’s population are familiar with and utilize QR codes. (Source)
    17.  In 2018, the BMC planned to digitize the Cooperage Bandstand in Colaba, Mumbai, with a QR code. Hindustan Petroleum introduced a customer feedback initiative via QR code that same year. (Source)
    QR Code Statistics
    1. QR code generation has quadrupled between 2021 and 2024. (Source)
    2. UPI QR codes experienced significant growth, surging 79% to reach 272 million by June 2023. (Source)
    3. The Asia Pacific region witnessed an 83% surge in QR codes for packaging between 2014 and 2018. (Source)

    Conclusion on QR Code Statistics

    QR codes have rapidly gained prominence in recent years, emerging as versatile tools for businesses and individuals to share information and products effortlessly. The data presented in this article underscores the global surge in QR code adoption. 

    QR codes are an enduring trend, offering businesses the opportunity to enhance customer engagement and experiences through effective implementation.

    QR Code Statistics

    FAQ (QR Code Statistics)

    What percent of people use QR codes?

    A vast majority, 86.66%, of smartphone users have encountered QR codes, with a significant portion, 36.40%, scanning at least once weekly.

    How big is the QR code market?

    The QR Code Solution market is projected to experience substantial growth, expanding from US$1,038.72 million in 2023 to US$2,247.17 million by 2030. This represents a compound annual growth rate (CAGR) of 11.44% over the forecast period.

    What are the statistics of QR code menu?

    Menu QR codes have become a staple in the food and beverage sector, particularly since the pandemic. By offering contactless menu access, they’ve transformed the dining experience. A substantial 75% of restaurants have adopted this technology, leading to a 30% decrease in menu printing costs and a remarkable 40% surge in customer engagement.

    How can we check how many people have scanned a QR code?

    Dynamic QR Codes offer advanced tracking capabilities. Unlike static codes, they display a total scan count and a link to detailed performance metrics within the dashboard. This real-time data provides valuable insights into code engagement.

    Which country uses QR codes the most?

    Determining the global leader in QR code usage is challenging due to varying data sources. While China boasts an impressive 10 billion mobile devices equipped for QR code payments, the United States leads in terms of total scans, reaching 2,880,960 million.

    Do QR codes expire? 

    Static QR codes are permanent. Once created, they always direct users to the same fixed destination, such as a website or specific data. 

  • 70 Intriguing Call Center Statistics And Trends For 2025

    70 Intriguing Call Center Statistics And Trends For 2025

    call center statistics
    Call Center Statistics: The Industry (A Snapshot)

    Call centers remain a vital customer interaction channel. With millions of calls handled daily, the industry is constantly evolving. This article delves into key statistics, emerging trends, and challenges shaping the call center landscape.

    Discover the latest insights and trends driving the call center industry.

    Call Center Industry by the Numbers (Call Center Statistics)

    The call center industry is experiencing significant growth. Here’s a snapshot of key statistics:

    • Market Growth: The global call center market is projected to reach $494.7 billion by 2030, growing at a CAGR of 5.8%.
    • Industry Size: The US boasts approximately 2.9 million call center employees.
    • Customer Preference: 86% of consumers value call center services.
    • AI Integration: The call center AI market is estimated to reach $2.8 billion by 2024.
    • Call Volume: The average call center handles about 4,400 calls monthly, with a 48-call miss rate.

    These figures highlight the industry’s scale and the increasing demand for efficient and effective customer service.

    Want to explore specific trends or challenges within the call center industry?

    Call Center Industry: Key Statistics

    The call center industry is a significant player in global customer service. Here’s a breakdown of key figures:

    1. US Dominance: The US maintains a strong position in the call center industry regarding employment and expansion. (source)
    call center statistics
    1. Global Market Growth: The global call center market is booming and is expected to reach $494.7 billion by 2030 from $314.5 billion in 2022. (source)
    2. US Workforce: Over 2.9 million people were employed in the US call center industry in 2022. (source)
    3. Industry Leaders: Tata Consultancy Services and Genpact are leading players, generating billions in revenue. (source)
    4. Job Growth Challenges: The US experienced a significant decline in call center job creation from 2016 to 2022. (source)
    5. Global Market Growth: Valued at $314.5 billion in 2022, it’s projected to reach $494.7 billion by 2030, growing at a CAGR of 5.8%. (source)
    6. US Workforce: Employed over 2.9 million people in 2022. (source)
    7. Top Players: Companies like Tata Consultancy Services ($27 billion revenue) and Genpact ($4 billion revenue) are industry leaders. (source)
    8. Job Market Fluctuations: The US experienced a significant decline in call center job creation from 2016 to 2022. (source)
    9. Consumer Reliance: 86% value call center services, highlighting the need for human interaction. (source)
    10. Call Transfers: The average caller is transferred 2.6 times before resolving their issue. (source)
    11. Customer Preference: Most consumers prefer human interaction over automated systems. (source)
    12. Increased Call Volumes: Call center leaders report increased call volumes since the pandemic. (source)
    13. Average Handling Time (AHT): The typical call center benchmark for AHT is six minutes. (source)
    14. Call Duration and Hold Times: Average call duration is 302 seconds, with an average hold time of 25.8 seconds. (source)
    15. Generational Preferences: Millennials and Gen Z demonstrate varying confidence levels and reliance on call centers. (source)
    16. Generational Differences: While Millennials have some confidence in call centers, Gen Z strongly prefers digital channels. (source)
    17. Agent Productivity: Agents spend approximately 32 minutes on customer interactions per hour, with the remaining time allocated to after-call work, breaks, and meetings. (source)
    18. Customer Expectations: Consumers increasingly demand personalized interactions and faster response times. (source)
    19. Call Center Performance Metrics: First-call resolution rates, average handle time, and answer speed are critical performance indicators. (source)
    20. Customer Preferences: Phone calls remain a preferred support channel, especially for complex issues. However, there’s a growing preference for faster response times and digital communication channels. (source)

    These statistics show the industry’s size, growth trajectory, and employment landscape.

    The Rise of AI in Call Centers (Call Center Statistics)

    AI is transforming the call center industry. Here are key statistics:

    call center statistics
    1. Market Growth: The call center AI market is expected to reach $2.8 billion by 2024, growing at a CAGR of 23.1%. (source)
    2. Automation Surge: AI automation in agent interactions will increase fivefold by 2026. (source)
    3. Agent Empowerment: Two-thirds of contact center managers believe AI will enhance agent capabilities. (source)
    4. Cost Savings: Conversational AI is projected to save $80 billion in labor costs by 2026. (source)
    5. AI Adoption: One in ten agent interactions will be automated by AI by 2026. (source)

    These statistics highlight the significant impact of AI on the call center landscape.

    The Impact of Customer Experience on Call Center Success (Call Center Statistics)

    Customer experience is a critical driver of business success. Here’s how call centers play a role:

    1. Revenue and Market Share: Poor customer experience poses significant risks to revenue and market share. (source)
    2. Customer Loyalty: Exceptional customer experiences can lead to a 16% price premium and increased customer loyalty. (source)
    3. Customer Satisfaction: 95% of call center professionals prioritize customer satisfaction as a key performance indicator. (source)
    4. Customer Churn: Negative call center experiences can lead to customer attrition, with 59% of US customers considering switching brands after multiple bad experiences. (source)

    The Impact of Customer Experience on Brand Loyalty (Call Center Statistics)

    Customer experiences significantly impact brand loyalty and purchasing decisions. Here’s a breakdown:

    call center statistics
    1. Global Impact: Negative call center experiences can lead to customer attrition, with 32% of Latin American and 59% of US customers considering switching brands. (source)
    2. Customer Expectations: Speed, convenience, knowledge, and friendliness are key components of a positive call center experience. (source)
    3. Purchase Influence: Excellent call center service can significantly influence purchasing decisions, with 83% of customers reporting a positive impact. (source)
    4. Customer Sentiment: Poor call center experiences lead to negative emotions, such as disappointment, unhappiness, and anger. (source)
    5. Word-of-mouth: Negative experiences are often shared with others, while positive experiences can drive brand loyalty and new customer acquisition. (source)

    Key Call Center Performance Metrics (Call Center Statistics)

    Measuring call center performance is crucial for identifying areas for improvement. Here are the key metrics:

    1. Customer Satisfaction (CSAT): This metric gauges customer happiness and satisfaction. A good CSAT score typically falls between 75% and 85%. (source)
    2. First Call Resolution (FCR): Measures the percentage of customer issues resolved on the first call. High-performing call centers aim for an FCR rate of 70% or higher. (source)
    3. Average Handle Time (AHT): This represents the average duration of a customer call, including hold times, transfers, and after-call work. The industry average is around 6 minutes. (source)
    4. Occupancy Rate: Ideally, the rate is between 80-85%. This metric measures the percentage of time agents are actively engaged with customers. (source)
    5. Average Speed of Answer (ASA): The target is under 28 seconds, representing customers waiting before their call is answered. (source)
    6. Customer Abandonment Rate: Should be between 2-5%. Higher rates indicate poor call center performance. (source)
    7. Service Level: Typically around 81.5%, this metric measures the percentage of calls answered within a specified time. (source)

    Challenges Facing the Call Center Industry (Call Center Statistics)

    The call center industry faces several challenges impacting operations and customer satisfaction:

    1. High Attrition Rates: The sector struggles with a 42% attrition rate due to factors like burnout and lack of support. (source)
    2. Service Strategy Gaps: Poor service strategies, such as limited personalization, negatively impact customer experience. (source)
    3. Wait Time Impact: Longer wait times correlate with lower customer satisfaction scores and potential revenue loss. (source)
    4. Personalization Challenges: Delivering personalized interactions is crucial but needs more customer understanding. (source)
    5. Technical Issues: Technical glitches can disrupt operations and negatively impact customer experience. (source)
    6. First Call Resolution (FCR): Measures the percentage of customer issues resolved on the first call. A higher FCR rate indicates efficient problem-solving and reduced customer effort.  (source)
    7. Average Handle Time (AHT): This represents the average duration of a customer call, including after-call work. Optimizing AHT enhances agent efficiency. (source)
    8. Occupancy Rate: Measures the percentage of time agents are actively handling calls. Balancing occupancy is essential for agent well-being and operational efficiency. (source)
    9. Average Speed of Answer (ASA): Reflects the average wait time for customers. Minimizing ASA improves customer satisfaction. (source)

    Key Call Center Performance Metrics (Call Center Statistics)

    Effective call center management relies on key performance indicators (KPIs). Here’s a breakdown of crucial metrics:

    call center statistics
    1. Service Level: Measures the percentage of calls answered within a specific timeframe. An 80% service level within 20 seconds is a common industry standard. (source)
    2. Abandonment Rate: Indicates the percentage of callers who hang up before their call is answered. A rate below 5% is considered good. (source)
    3. Abandonment Wait Time: Understanding when customers abandon calls (often at 30 and 60 seconds) helps optimize call handling. (source)
    4. Schedule Adherence: Measures how closely agents adhere to their schedules, with a recommended rate of 85% or higher. (source)

    Industry-Specific Performance Metrics (Call Center Statistics)

    1. Financial Services: A 79% customer satisfaction score highlights the industry’s focus on customer satisfaction. (source)
    2. Healthcare: A 7% abandonment rate indicates efficient call handling in the healthcare sector. (source)
    3. E-commerce: A 75% first-call resolution rate demonstrates a focus on resolving customer issues quickly. (source)
    4. Technology: A 79% service level reflects the industry’s commitment to timely call answering. (source)
    5. Retail: A low customer satisfaction score of 39% indicates challenges in meeting customer needs. (source)
    6. Telecom: An 80-90% occupancy rate suggests efficient agent utilization in the telecom industry. (source)
    7. Automotive: A 78% customer satisfaction score highlights the industry’s focus on customer satisfaction. (source)
    Emerging Trends in the Call Center Industry (Call Center Statistics)

    The call center industry is undergoing significant transformation driven by technological advancements and evolving customer expectations. Key trends include:

    1. Voice Assistant Integration: With over 8.4 billion voice assistants projected for use by 2024, businesses can leverage this technology to offer efficient self-service options. (source)
    2. Cloud-Based Contact Centers: The shift towards cloud-based contact center solutions (CCaaS) is gaining momentum, offering scalability and enhanced customer experiences. (source)
    3. Omnichannel Engagement: Customers expect seamless interactions across multiple channels, driving the growth of omnichannel customer engagement solutions. (source)
    4. Remote Agent Workforce: The trend towards remote work is expanding the call center agent pool, offering flexibility and cost savings. (source)
    5. Sentiment Analysis: Advancements in sentiment analysis enable businesses to better understand customer emotions, tailoring interactions accordingly. (source)

    Call Centers: Evolving to Meet Modern Customer Demands (Call Center Statistics)

    The call center landscape is undergoing a rapid transformation, driven by technological advancements and evolving customer expectations. To thrive in this dynamic environment, businesses must adapt to several key trends.

    Automation and AI: Your New Call Center Powerhouse (Call Center Statistics)

    Leveraging automation and artificial intelligence (AI) is no longer optional but essential for call centers. AI-powered tools like virtual agents and chatbots are revolutionizing customer interactions by providing instant, accurate responses to common queries. This frees up human agents to focus on more complex issues, enhancing overall efficiency and customer satisfaction. Furthermore, AI-driven analytics offer valuable insights into customer behavior, enabling data-driven decision-making and personalized service.

    Personalization: Building Stronger Customer Relationships (Call Center Statistics)

    Gone are the days of generic customer service. Today’s consumers crave personalized experiences. By harnessing customer data, call centers can tailor interactions to individual preferences, creating a sense of connection and loyalty. From recommending products based on purchase history to routing customers to agents familiar with their accounts, personalization is key to standing out in a crowded marketplace.

    Omnichannel Excellence: Meeting Customers Where They Are (Call Center Statistics)

    Consumers expect seamless interactions across multiple channels. Call centers must adapt by offering support through phone, email, chat, social media, and more. A consistent customer experience, regardless of the channel, is crucial for building trust and satisfaction. By integrating these channels, businesses can provide efficient and convenient support, increasing customer engagement and loyalty.

    Cloud Power: Flexibility and Scalability at Your Fingertips (Call Center Statistics)

    Cloud technology is reshaping the call center industry by offering unparalleled flexibility and scalability. By adopting cloud-based solutions, businesses can eliminate the need for costly on-premises infrastructure and quickly adapt to changing demands. Additionally, cloud platforms often incorporate advanced features like speech recognition and natural language processing, empowering call centers to deliver cutting-edge customer experiences.

    Data-Driven Success: Unlocking Insights for Growth (Call Center Statistics)

    Advanced analytics is transforming call centers into data-driven operations. By analyzing customer interactions, businesses can identify trends, preferences, and pain points. These insights enable call centers to optimize processes, improve agent performance, and deliver proactive support. Data-driven decision-making is essential for staying ahead of the competition and delivering exceptional customer experiences.

    call center statistics

    In conclusion, call centers that embrace these trends will be well-positioned to succeed in the evolving customer landscape. By investing in automation, personalization, omnichannel capabilities, cloud technology, and data analytics, businesses can create efficient, customer-centric operations that drive growth and loyalty.

  • 107 Top Business Process Outsourcing Statistics Trends And Facts 2025

    107 Top Business Process Outsourcing Statistics Trends And Facts 2025

    Business process outsourcing statistics

    Here are some Business Process Outsourcing statistics you should know;

    The global business process outsourcing (BPO) market is booming, with staggering growth projected in the coming years.

    BPO is no longer a niche strategy. It’s a key driver of efficiency, cost savings, and competitive advantage for businesses of all sizes. 

    Let’s explore the most recent BPO data to gain insights into this evolving sector.

    BPO Industry Snapshot (Business Process Outsourcing Statistics) 

    • The insurance BPO services market is valued at USD 7.08 billion in 2024 and is projected to expand to USD 8.94 billion by 2029.
    • The BPO industry is poised for substantial growth, with projected revenues reaching a staggering US$0.39 trillion by 2024.
    • Small businesses exhibited a strong preference for outsourcing partners in marketing (27%), IT services (22%), and design (21%).
    • Approximately 300,000 jobs are outsourced from the United States annually.
    • The UAE has solidified its position as a global business epicenter, attracting multinational corporations needing robust BPO support for their international operations.
    • The IT and telecom sector is projected to contribute over 32.7% of the total revenue generated by the Asia Pacific BPO market between 2022 and 2032.
    • The customer care BPO market in the Middle East and Africa is projected to experience significant growth, expanding from $1,986.49 million in 2023 to $2,618.71 million by 2028.
    • The healthcare-payer BPO market is growing, expanding from a valuation of USD 13.20 billion in 2021 to a projected USD 21.30 billion by 2030 at a robust CAGR of 9.5%.
    • The United States is expected to dominate global revenue, with an estimated US$146.30 billion in 2024.

    BPO Market Trajectory ( Business Process Outsourcing Statistics)

    1. The market is projected to expand at a compound annual growth rate (CAGR) of 4.67% from 2024 to 2029, culminating in a total market value of US$0.49 trillion. (Source)
    2. The business process outsourcing market is projected to be worth approximately US$ 318.8 billion in 2024, and it is anticipated to grow at a consistent annual rate of 8% until it reaches US$ 688.2 billion by 2034. (Source)
    3. Revenue within the Business Process Outsourcing industry is estimated to total US$0.39 trillion in 2024. (Source)
    4. Expenditure on Business Process Outsourcing is projected to average US$110.50 per employee in 2024. (Source)
    5. A combination of political stability, robust infrastructure, and a large consumer market within the United States fosters expansion in the BPO sector. (Source)
    6. The escalating demand for tailored and streamlined services is anticipated to fuel growth within the US BPO market. (Source)
    7. Before the COVID-19 pandemic, the global outsourcing market was assessed at a value of $92.5 billion. (Source)
    8. The administrative outsourcing industry is projected to generate $21 billion in revenue during 2023. (Source)
    9. The Healthcare payer BPO market, valued at USD 13.20 billion in 2021, is projected to attain USD 21.30 billion by 2030, demonstrating a compound annual growth rate of 9.5%. (Source)
    10. The United States is expected to dominate global revenue, with an estimated US$146.30 billion in 2024. (Source)
    11. Danish outsourcing giant ISS World reported approximately US$11.52 billion in revenue for 2023, marking a year-over-year increase of roughly US$570 million. (Source)
    12. Valued at USD 56.80 billion in 2022, the Business Process as a Service market is poised to expand to USD 145.30 billion by 2031, exhibiting a compound annual growth rate of 11%. (Source)
    Business process outsourcing statistics
    1. With an estimated value of USD 92.49 billion in 2023, the global customer experience business process outsourcing market is anticipated to expand at a compound annual growth rate of 11.9% from 2024 to 2030. (Source)
    2. Data security is cited as a key concern by 68% of outsourced businesses exploring cloud computing options. (Source)

    BPO Across Industries (Business Process Outsourcing Statistics)

    1. The insurance BPO sector continues to grow as insurance providers increasingly delegate non-core operations. (Source)
    2. While less than one-third (29%) of businesses with 50 employees or fewer engage in outsourcing, this practice is adopted by two-thirds (66%) of businesses with 51 to 500 employees. (Source)
    3. Business Process Outsourcing contributed approximately 29% to global IT Services revenue in 2022. (Source)
    4. Driven by labor scarcity and escalating public sector outsourcing, IT-related BPO services sales in Japan are anticipated to exceed 3.2 trillion yen by the 2027 fiscal year. (Source)
    5. Valued at USD 7.08 billion in 2024, the Insurance BPO Services Market is projected to reach USD 8.94 billion by 2029, demonstrating a compound annual growth rate of 4.76%. (Source)
    6. Over half of executives (52%) utilize outsourcing for business operations. (Source)

    Outsourcing Services for Businesses (Business Process Outsourcing Statistics)

    1. Financial tasks are outsourced by approximately 44% of businesses. (Source)
    2. Content marketing is a commonly outsourced function, with 30% of marketing professionals utilizing external providers. (Source)
    3. Lead generation and cold calling are frequent outsourcing targets within operational departments. (Source)
    4. Accounting functions are outsourced by 37% of businesses. (Source)
    5. A significant portion of executives (81%) depend on external providers for some or all cybersecurity functions. (Source)
    6. IT services are predominantly sourced through third-party delivery models, with 76% of surveyed executives adopting this approach. This trend is expected to mirror IT outsourcing rates, reaching up to 80% adoption. (Source)
    7. Legal functions, tax services, HR operations, financial management, and supply chain management (including manufacturing and procurement) are the most sought-after outsourced business processes, with adoption rates ranging from 48% to 64%. (Source)
    8. ISS World excels in facility services, while Accenture is a leading provider of IT, help desk, HR outsourcing, and consulting services. (Source)
    Business Process Outsourcing Statistics
    1. Over 40% of larger organizations leverage outsourcing for HR and operational tasks, albeit without complete reliance on external partners. (Source)

    Key Benefits of BPO (Business Process Outsourcing Statistics)

    Cost Reduction (Business Process Outsourcing Statistics)
    1. Cost minimization is a primary driver for outsourcing, cited by 70% of executives as a key reason. (Source)
    2. Approximately 59% of global business leaders identify cost-cutting as a major benefit, alongside focusing on core competencies and addressing capacity constraints. (Source)
    3. To reduce expenses, 28% of businesses outsource company development. (Source)

    Operational Efficiency and Growth (Business Process Outsourcing Statistics)

    1. Outsourced lead generation teams can boost lead generation by up to 43% compared to in-house efforts. (Source)
    2. Companies leverage outsourcing to streamline operations, access new capabilities, and adapt to changing market conditions, with cost reduction (57%), capability expansion (51%), and strategic agility (49%) as primary motivations. (Source)

    Talent and Resource Optimization (Business Process Outsourcing Statistics)

    1. The significant cost of employee benefits, accounting for 29.4% of employer expenditures, according to the Bureau of Labor Statistics, drives many organizations to seek BPO solutions. (Source)

    BPO Landscape and Future Directions (Business Process Outsourcing Statistics)

    Global BPO Trends (Business Process Outsourcing Statistics)

    1. The finance and accounting segment within South Africa’s BPO market is projected to expand rapidly, with a compound annual growth rate of 13% from 2021 to 2028. (Source)
    2. North America captured more than 36.0% of the revenue in 2023 and is anticipated to maintain its leading position from 2024 to 2030, fueled by the increasing demand for BPO services from numerous major technology companies within the region. (Source)
    Business Process Outsourcing Statistics
    1. The IT business process outsourcing (BPO) market share is expected to increase by USD 281.25 billion from 2021 to 2026, and the market’s growth momentum will accelerate at a CAGR of 8.12%. (Source)
    2. The United Arab Emirates is embracing specialized BPO offerings, with Customer Experience Management (CXM) and Knowledge Process Outsourcing (KPO) gaining prominence. (Source)
    3. The United States BPO market is experiencing accelerated growth fueled by advancing technology adoption. (Source)
    4. South Africa’s BPO sector is characterized by surging demand for specialized services, particularly legal process outsourcing and healthcare outsourcing. (Source)
    5. Automation and AI adoption is a notable trend in the European BPO market, aimed at enhancing efficiency and cutting costs. (Source)
    6. Nigeria’s BPO market is witnessing a growing emphasis on voice-based services such as customer support and telemarketing. (Source)

    Evolving Outsourcing Preferences (Business Process Outsourcing Statistics)

    1. Small businesses demonstrated a strong preference for outsourcing marketing (27%), IT services (22%), and design (21%) functions in 2023. (Source)
    2. In April 2020, Wipro, a business process outsourcing company, collaborated with Nutanix to provide digital database services. (Source)
    3. 92% of the top 2,000 global companies use IT outsourcing. (Source)
    4. Today, more than 40% of banking and financial institution support desk employment is outsourced. (Source)

    Business Process Outsourcing Statistics By Regions

    Europe Business Process Outsourcing Trends (Business Process Outsourcing Statistics)

    1. The UK’s BPO market is expected to generate $29.31 billion in revenue by 2024. (Source)
    2. The market is projected to expand at a consistent annual rate of 5.67% from 2024 to 2029, culminating in a market size of US$38.61 billion by the end of the forecast period. (Source)
    3. Eastern Europe’s BPO market is expected to reach $4.29 billion in 2024 and grow 3.32% annually to $5.05 billion by 2029. (Source)
    4. European businesses are projected to spend an average of US$283.70 per employee on BPO services in 2024. (Source)
    5. Europe’s BPO industry is set to expand significantly, increasing from $72.45 billion in 2023 to $132.57 billion by 2031, with an annual growth rate of 7.9% during this period. (Source)
    6. The UK is projected to be the leading European BPO hub, driven by its robust business environment, skilled talent pool, and strategic geographic position. (Source)
    7. The UK is projected to be the leading European BPO hub, driven by its robust business environment, skilled talent pool, and strategic geographic position. (Source)
    8. HR outsourcing emerged as the dominant segment within the UK BPO market in 2022, contributing $3.5 billion or 26.3% to the overall market value. (Source)
    9. The UK BPO services market generated $13.5 billion in revenue in 2022, demonstrating a consistent 5.1% annual growth from 2017. (Source)
    10. A substantial majority, three out of five, of British B2B companies outsource critical business operations. (Source)
    11. Poland is the leading BPO hub in Eastern Europe, with Romania and the Czech Republic following closely behind. (Source)
    12. Southern Europe boasts the highest rate of adoption of BPO and future plans among European regions. (Source)
    13. Businesses in Eastern Europe are expected to allocate an average of US$36.25 per employee to BPO services in 2024. (Source)
    Business Process Outsourcing Statistics
    1. Europe’s BPO market is set to generate $118.60 billion in revenue this year. Looking ahead, the market is projected to expand at a consistent annual growth rate of 4.32% from 2024 to 2029, culminating in a total revenue of $146.50 billion by 2029. (Source)
    2. The UK’s historical ties with developing countries, coupled with the shared English language, make it an ideal destination for businesses seeking to outsource their operations. (Source
    3. Eastern Europe’s BPO industry is characterized by its abundance of multilingual talent. (Source)

    United States Business Process Outsourcing Trends (Business Process Outsourcing Statistics)

    1. The Professional, Scientific, and Technical Services sector in the United States exhibits a market concentration level of 22%. (Source)
    2. The BPO industry in the United States is experiencing rapid growth due to changing customer expectations. (Source)
    3. The U.S. BPO Services market is fragmented, with no dominant players, as the combined market share of the top four companies is below 40%. (Source)
    4. The U.S. BPO market experienced a dip in demand as the pandemic caused a decrease in both business formation and corporate profits. (Source)
    5. The U.S. BPO industry is poised for consistent growth, reaching a market volume of $178.70 billion by 2029, with an estimated annual growth rate of 4.08%. (Source)
    6. The United States is forecast to dominate the BPO market in 2024, accounting for $146.30 billion in revenue. (Source)
    7. The anticipated average spending on each employee within the U.S. BPO market for 2024 is $840. (Source)
    8. An estimated 300,000 jobs are relocated annually from the United States to overseas operations. (Source)

    Asia And The Pacific Region Business Process Outsourcing Trends (Business Process Outsourcing Statistics)

    1. India’s BPO industry is poised for significant growth, with a projected annual growth rate of 8.76%, leading to a market volume of $10.94 billion by 2029. (Source)
    2. According to the National Investment Promotion Agency, India’s retail industry is on track for substantial growth, reaching $1.1 trillion by 2027 and doubling to $2 trillion by 2032, driven by a consistent 25% annual growth rate. (Source)
    3. India and the Philippines are recognized global hubs for IT, customer service, and back-office services. (Source)
    4. India, the Philippines, and China are the dominant forces in their respective regional BPO markets. (Source)
    5. According to Data Bridge Market Research, India’s BPO market, valued at $6.08 billion in 2022, is projected to nearly double in size by 2030, reaching $12.38 billion. (Source)
    6. India’s Business Process Outsourcing market is projected to spend an average of $13.19 per employee in 2024. (Source)
    7. The BPO market in Japan is expected to reach $38 billion by 2025. (Source)
    8. The Asia Pacific BPO market is expected to be dominated by customer services throughout the decade from 2022 to 2032. (Source)
    9. China’s leading position in the Asia Pacific BPO market solidified in 2022, and it is expected to persist, with revenues on track to reach $35.054 billion by 2030. (Source)
    10. With a projected compound annual growth rate of 9.8%, the Asia Pacific BPO market is poised to expand significantly, reaching $185.1 billion by 2032. (Source)
    11. The Asia Pacific BPO market is anticipated to expand at a robust 9.8% annual rate from 2023 to 2030. (Source)
    12. The Asia Pacific BPO market size in 2022 was at a valuation of $72.7 billion. (Source
    Business Process Outsourcing Statistics
    1. The Asia Pacific Business Process Outsourcing Market Size is expected to reach USD 185.1 Billion by 2032. (Source)
    2. Japan’s IT-related BPO market clocked in at 2.78 trillion Japanese yen during the 2022 fiscal year. (Source)
    3.   China is quickly building a strong outsourcing industry, and emerging outsourcing players already have strong credentials. (Source)
    4. The Japanese business process outsourcing market is predicted to grow at a steady annual rate of 9.1% between 2024 and 2034. By 2034, Japan will comprise 29.4% of East Asia’s overall business process outsourcing market. (Source)

    Africa Business Process Outsourcing Trends (Business Process Outsourcing Statistics)

    1. Nigeria’s strong foundation of skilled and educated labor positions it as a prime choice for businesses seeking BPO services. (Source)
    2. Nigeria’s BPO industry is set to achieve a $0.70 billion valuation in 2024, followed by a robust growth period at an 11.93% compound annual growth rate, culminating in a market size of $1.23 billion by 2029. (Source)
    3. South Africa’s BPO industry is poised for rapid growth, expanding at a 13.2% annual rate to reach a valuation of $3.6 billion by 2027. (Source)
    4. Employing more than 270,000 people in 2020, South Africa’s BPO industry is a vital job creator. Government targets aim to boost this number to 500,000 by the decade’s end. (Source)
    5. The 2021 EF English Proficiency Index placed South Africa in the 12th position, surpassing rival outsourcing locations, including Poland. (Source)
    6. The average expenditure per employee within South Africa’s BPO market is projected to be $75.21 in 2024. (Source)
    7. The time zone differential benefits South Africa’s BPO market considerably. (Source)
    8. From a $2.16 billion valuation in 2022, South Africa’s BPO market is expected to soar to $6.49 billion by 2031. (Source)
    9. South Africa is considered the leading African country for business outsourcing, according to service providers. Cape Town has become a preferred destination for BPO establishments. (Source)
    10. South Africa’s BPO industry is forecast to attain a $1.89 billion valuation in 2024, followed by consistent annual growth of 3.64%, leading to a market size of $2.26 billion by 2029. (Source)
    11. Customer service is the undisputed leader in South Africa’s BPO market, accounting for more than 31% of the market in 2019. This segment is expected to experience significant growth, with a high CAGR forecast for the period 2021 to 2028. (Source)
    12. Nigerian BPO companies are projected to spend an average of $9.02 per employee in 2024. (Source)

    Middle East Business Process Outsourcing Trends (Business Process Outsourcing Statistics)

    1. The United Arab Emirates’ BPO market is projected to generate approximately $0.98 billion in revenue by 2024. (Source)
    2. The customer care BPO market in the Middle East and Africa is projected to grow from $1.99 billion in 2023 to $2.62 billion by 2028 at a steady annual growth rate of 5.7%. (Source)
    3. The Saudi Arabian business process outsourcing market is anticipated to grow significantly from 2024 to 2030. (Source)
    4. The increasing number of new businesses is propelling the U.A.E. to the forefront of the Middle East and Africa’s BPO market. (Source)
    5. Middle East and Africa BPO market, with a projected 7.1% compound annual growth rate between 2023 and 2030. (Source)
    6. The market is expected to grow steadily at a 4.82% annual rate from 2024 to 2029, reaching a total value of approximately $1.24 billion by the end of the forecast period. In 2024, the average expenditure on each BPO employee will be $141.00. (Source)
    7. Small and Medium Enterprises (SMEs) are increasingly turning to outsourcing, significantly contributing to expanding the UAE’s BPO market. (Source)
    8. The UAE has emerged as a global business hub, attracting numerous multinational corporations seeking BPO services to support their worldwide operations. (Source)
    9. Data Bridge Market Research forecasts substantial growth for the UAE’s BPO market, which is valued at $1.8 billion in 2023 and is expected to reach $3.3 billion by 2031. (Source)

    Conclusion (Business Process Outsourcing Statistics)

    The BPO market is evolving rapidly, driven by technological advancements and the ever-growing need for businesses to streamline operations and optimize costs.

    Gain a competitive edge by keeping abreast of the newest BPO data and unleash your business’s maximum capabilities.

    Business Process Outsourcing Statistics

    Frequently Asked Questions (Business Process Outsourcing Statistics)

    What are the stats about business process outsourcing?

    The U.S. BPO industry is poised for consistent growth, reaching a market volume of $178.70 billion by 2029, with an estimated annual growth rate of 4.08%.

    What percentage of businesses outsource?

    A significant portion of small businesses, around 37%, rely on external providers for IT services and accounting. Other functions commonly outsourced include digital marketing (34%), human resources (24%), and customer service (24%).

    How big is the business process outsourcing industry?

    The global Business Process Outsourcing (BPO) market, valued at a substantial USD 340.99 billion in 2022, is projected to grow at a steady CAGR of 6.13% until 2028, reaching a total market size of USD 487.14 billion.

    What is the top 1 outsourcing country?

    India is a premier outsourcing destination, offering a vast pool of highly skilled professionals, courtesy of its vast higher education system, which is the largest in the world.

    Which industry outsources the most? 

    The IT sector outsources the most, followed by Health care, Finance, Retail, and Insurance. 

    Who gains from outsourcing?

    By outsourcing to regions with lower labor costs, companies can significantly improve their profit margins while simultaneously offering consumers more affordable products or services.

  • GoHighLevel Vs Kartra (2025) – Which Is Best For Your Business?

    GoHighLevel Vs Kartra (2025) – Which Is Best For Your Business?

    Gohighlevel vs Kartra

    GoHighLevel vs Kartra: Choosing the Champion for Your Online Business

    Deciding between GoHighLevel and Kartra? Both platforms offer robust features, but their strengths lie in different areas.

    GoHighLevel excels as an agency-focused platform, offering advanced tools for client management, lead generation, and marketing automation.

    Kartra is a comprehensive all-in-one solution for solopreneurs and small businesses, emphasizing ease of use and a wide range of features.

    To make an informed decision, consider your specific needs:

    • Are you a marketing agency? GoHighLevel’s white-label capabilities and focus on scalability might be the ideal fit.
    • Are you a solopreneur or a small business owner? Kartra’s all-in-one approach could streamline your operations.

    Ultimately, the best way to determine the right platform is to test them out. Both offer free trials, allowing you to experience their features firsthand.

    Need more help? Feel free to ask about specific features or request a detailed comparison.

    #GoHighLevel

    Gohighlevel vs Kartra

    GoHighLevel: Streamline Your Agency Workflow in One Powerful Platform

    Imagine consolidating your marketing, sales, and management tasks under one roof. GoHighLevel, created by a marketing agency that understands your struggles firsthand, makes this a reality.
    Focus on Growth, Not Busywork:
    GoHighLevel empowers agencies to shift their focus from managing multiple tools (IN their business) to working strategically ON their business.
    Gohighlevel vs Kartra
    All-in-One Marketing Powerhouse:
    • Client Acquisition & Retention: Effortlessly attract new clients, nurture leads, and cultivate lasting customer relationships.
    • Automation & Efficiency: Streamline workflows, automate repetitive tasks, and free up valuable time for strategic growth.
    • Data-Driven Marketing: Track key metrics (calls, leads, clicks, etc.) and optimize your campaigns for maximum ROI.
    • Marketing Funnels & Sales Pipelines: Design high-converting funnels, manage sales pipelines seamlessly, and boost revenue.
    • Reputation Management & Customer Service: Build trust and cultivate positive client experiences through effective reputation management and exceptional customer service tools.
    Go beyond the limitations of multiple platforms! GoHighLevel offers a comprehensive solution at a fraction of the typical cost, with an intuitive interface accessible to technical and non-technical users. Consolidate your tech stack, streamline operations, and unlock significant growth for your agency.

    # Kartra 

    Gohighlevel vs Kartra
    A Top Contender in the GoHighLevel Arena

    In the ongoing quest for the best marketing tool, Kartra emerges as a strong competitor to GoHighLevel. It stands out:

    • The White-Label Edge: Kartra boasts a white-label feature, allowing you to rebrand the platform for your clients, similar to GoHighLevel.
    • My Experience Matters: Based on my exploration of various marketing tools (including personal use, testing, and in-depth research), Kartra stands out as exceptional.
    • All-in-One Powerhouse: Kartra offers a comprehensive suite of features, making it easy to build effective sales funnels quickly.
    • User-Friendly Approach: Navigating and utilizing Kartra’s features is known for being intuitive and user-friendly.
    • Reliability You Can Count On: Kartra delivers dependable service regarding performance and stability.

    This overview highlights Kartra’s strengths, but exploring the other alternatives in this guide will give you a more comprehensive picture. Consider your specific needs and preferences to find the perfect marketing tool to fuel your success.

    Kartra: Streamline Sales, Deepen Engagement, Grow Your Business

    Kartra offers an all-in-one marketing platform to:

    • Effortlessly build high-converting sales funnels with drag-and-drop tools and pre-made templates.
    • Boost revenue by optimizing conversion rates through effective funnels.
    • Nurture leads and build strong customer relationships with email marketing, memberships, and webinars.
    • Increase customer retention by offering white-labeled solutions under your own brand (Agency feature).

    Kartra empowers businesses to streamline sales, cultivate deeper customer connections, and achieve sustainable growth.

    Gohighlevel vs Kartra

    Kartra: All-in-One Marketing Platform for Streamlined Business Growth

    Kartra goes beyond marketing, offering a comprehensive suite to streamline your entire business. Here are its key features:
    • Sales & Marketing Automation: Build high-converting sales funnels (drag-and-drop builder, templates), create supercharged checkouts, and automate email campaigns for lead nurturing.
    • Content & Course Creation: Design landing pages and courses with ease using pre-made templates, host high-quality videos, and build membership sites.
    • Growth & Engagement Strategies: Recruit affiliates to expand your reach, offer convenient appointment scheduling, and optimize campaigns with A/B testing and analytics.
    • Exceptional Customer Support: Provide excellent customer service through a dedicated helpdesk with ticketing and live chat.
    In short, Kartra empowers you to streamline sales, automate marketing, create engaging content, and build strong customer relationships – all under one roof.

    GoHighLevel vs Kartra: A Comparative Overview

    To help you make an informed decision about which platform best suits your business needs, we’ll conduct a side-by-side comparison of GoHighLevel and Kartra. This comprehensive analysis will cover key features, pricing, strengths, and weaknesses.

    Note: For optimal viewing, this comparison is best viewed on a desktop screen.

    [Insert a detailed comparison table here, including columns for GoHighLevel and Kartra, and rows for features like CRM, email marketing, automation, sales funnels, pricing, and more. Provide brief descriptions and ratings for each platform in each category.]

    By the end of this comparison, you’ll clearly understand the key differences between GoHighLevel and Kartra, enabling you to select the platform that best aligns with your specific business goals and budget.

    Stay tuned for an in-depth analysis of specific features and use cases in the following sections.

    OUR STAR RATING (GoHighLevel vs Kartra)

    GOHIGHLEVELKARTRA
    Overall Rating4.5 ★4.5 ★
    Ease of Use4 ★4 ★
    Value for Money5 ★5 ★
    Pricing4 ★5 ★
    Customer Support4.5 ★4 ★

    WHO ARE THEY FOR (GoHighLevel vs Kartra): AUDIENCE

    GoHighLevel: A Digital Marketer’s All-in-One Toolkit

    GoHighLevel is a comprehensive platform designed specifically for agencies and marketers. It’s a one-stop solution that replaces the need for multiple tools and software.

    Imagine having a CRM, marketing automation, sales funnels, website builder, and more all under one roof. That’s GoHighLevel. Its integrated calendar, funnel, and lead follow-up system streamline operations, making it a powerful tool for scaling your agency.

    GoHighLevel is built to help agencies operate more efficiently and effectively.

    Visit Gohighlevel Here…

    Kartra: The All-in-One Solution for Solopreneurs and Course Creators

    Kartra is a comprehensive platform tailored for individuals and small teams looking to streamline their online business operations. It’s particularly well-suited for solopreneurs, authors, and course creators who value a unified solution.

    Kartra aims to simplify business management and reduce costs by consolidating multiple tools into a single platform. While the initial investment might be significant, it can potentially offset the expenses of using separate tools for CRM, email marketing, membership sites, and more.

    Kartra’s membership site functionality, combined with its robust marketing automation features, is a standout feature that sets it apart from competitors.

    Visit Kartra Here…

    Pros and Cons (GoHighLevel vs Kartra)

    PROS (GoHighLevel vs Kartra)

    GOHIGHLEVEL KARTRA
    14-day free trial$1 14-day full trial
    Full website, funnel, membership site systemFull website, funnel, membership site system
    CRM, SMS, marketing automation includedAn all-in-one system replaces other expensive tools
    Native email marketing systemNative email marketing system
    Import ClickFunnels funnelsThe agency portal facilitates client work

    CONS (GoHighLevel vs Kartra)

    Lack of good landing page templatesNo email marketing integrations (only SMTPs)
    Overwhelming feature setFewer integrations than other platforms
    Not many integrationsSteep learning curve compared to the competition
    Less educational materialCan be overwhelming at first
    Visit Gohighlevel HereVisit Kartra Here 

    PRICING (GoHighLevel vs Kartra)

    GoHighLevel Pricing

    GoHighLevel offers two primary plans:

    • Agency Starter: Priced at $97 per month, this plan is ideal for smaller agencies or businesses with limited client needs.
    • Agency Unlimited: At $297 per month, this plan caters to agencies with multiple clients, offering unlimited sub-accounts.

    For advanced features like white-label mobile apps and custom integrations, an additional $497 per month is required.

    Gohighlevel vs Kartra

    Kartra Pricing

    Kartra offers four pricing tiers:

    • Starter: $119 per month (limited features)
    • Growth: $299 per month (more advanced features)
    • Professional: $549 per month (unlimited features)

    Higher tiers unlock additional features like Kartra Agency, and increased limits on leads, domains, and emails.

    Kartra offers a 25% discount when you pay annually for any plan.

    Gohighlevel vs Kartra

    PRICING INFORMATION (GoHighLevel vs Kartra)

    GOHIGHLEVEL (view Gohighlevel Here)KARTRA (view Kartra Here)
    Free 14 Day Trial AvailableNo Free 14 Day Trial Available
    $1 Trial For 14 Days$1 Trial For 14 Days
    No 30-Day Money Back Guarantee30-Day Money Back Guarantee
    Cancel AnytimeCancel Anytime
    Annual DiscountAnnual Discount
    Monthly SubscriptionMonthly Subscription
    No Freemium AccountNo Freemium Account
    No Credit Card to StartNo Credit Card to Start

    Features (GoHighLevel vs Kartra)

    Gohighlevel (see features)Kartra (see features)
    Landing page builderYESYES
    Visual editorYESYES
    Landing page templatesYESYES
    Sales funnel templatesYESYES
    Complete page hostingYESYES
    Mobile responsive pagesYESYES
    A/B Split TestingYESYES
    Funnel BuilderYESYES
    Share funnelsYESYES
    Custom webhooksYESYES
    Email Auto-respondersYESYES
    Affiliate tracking softwareYESYES
    Membership SitesYESYES
    Behavioral Adaptive MarketingYESYES
    Included subdomainYESYES
    Use your domainYESYES
    Checkout forms, shopping cartYESYES
    Full website builderYESYES
    Video marketing toolNOYES
    Customer HelpdeskNOYES
    Calendar scheduling toolYESYES
    Agency PortalYESYES

    Integrations: GoHighLevel vs Kartra

    While both platforms offer integration capabilities, their approaches differ. GoHighLevel prioritizes flexibility with a robust Zapier integration, allowing users to connect with a vast array of third-party apps. Kartra, on the other hand, is a more self-contained platform with limited native integrations, relying primarily on SMTP connections for email services and offering a more streamlined user experience.

    Integrations (GoHighLevel vs Kartra)
    Gohighlevel (see integrations)Kartra (see integrations)
    ActioneticsNONO
    ActiveCampaignNONO
    ConvertKitNONO
    AweberNONO
    MailChimpNONO
    HTML formsYESNO
    Zapier + WebhooksYESYES
    Membership SoftwareNOYES
    Checkout softwareYESYES
    AnalyticsYESYES
    Webinar softwareNOYES
    SMS / Texting softwareYESYES
    Bot softwareYESYES
    Calendar toolsYESYES
    Custom integrations / APIYESYES
    + many moreYESYES
    GoHighLevel vs Kartra: Affiliate Program Comparison

    Considering promoting either platform? Both GoHighLevel and Kartra offer affiliate programs with recurring commissions.

    GoHighLevel: Earn a generous 40% recurring commission for every referred customer. Simple!

    Kartra: Commissions vary per product, offering more flexibility but requiring more research on payouts.

    Ready to learn more? Click the links below to visit each platform’s website.

    GoHighLevel vs Kartra: A Quick Comparison

    GoHighLevel is a powerful platform designed for agencies, offering a robust suite of tools for client management, lead generation, and marketing automation. Its focus on scalability and white-label capabilities makes it a top choice for businesses looking to manage multiple clients.

    Try a 14-day Free Trial here…

    Kartra is an all-in-one solution catering primarily to solopreneurs and small businesses. It offers a comprehensive set of tools for building and managing online businesses, including sales funnels, email marketing, and membership sites.

    Both platforms aim to streamline operations, but their core strengths and target audiences differ significantly.

    Try Kartra at $1 for 14 days here…

    Exploring Your Options (GoHighLevel vs Kartra): GoHighLevel and Kartra Alternatives

    Can’t decide between GoHighLevel and Kartra? Explore these popular alternatives:

    GoHighLevel vs Kartra: A Quick Overview

    GoHighLevel is a powerful platform designed specifically for agencies and marketers. It offers a comprehensive suite of tools for managing clients, generating leads, and automating marketing processes. Its white-label capabilities make it a top choice for businesses looking to scale their operations.

    Visit Gohighlevel Here…

    Kartra is an all-in-one solution catering to solopreneurs and small businesses. It provides a range of tools for building and managing online businesses, including sales funnels, email marketing, and membership sites.

    Visit Kartra Here…

    Both platforms offer robust features, but their target audiences and core strengths differ.

    GoHighLevel vs Kartra: A Quick Comparison

    GoHighLevel is a powerful platform designed for agencies and marketers, offering a comprehensive suite of tools for client management, lead generation, and marketing automation. It’s known for its white-label capabilities and focus on scalability.

    Visit Gohighlevel Here…

    Kartra is an all-in-one solution for entrepreneurs and small businesses, providing a range of tools for building and managing online businesses. It emphasizes ease of use and a comprehensive feature set.

    Visit Kartra Here…

    Both platforms aim to streamline operations, but their core strengths and target audiences differ significantly.

    GoHighLevel vs Kartra: Sales Funnel Showdown

    Both GoHighLevel and Kartra offer robust tools for building high-converting sales funnels. Here’s a quick comparison:

    • GoHighLevel: Stands out with its flexibility and customization options. Build funnels from scratch, import existing ones from ClickFunnels, and leverage advanced features like live chat and booking calendars.

    Visit Gohighlevel Here…

    • Kartra: Offers pre-built funnels and a user-friendly interface, making it a great choice for those seeking a quick setup. Their done-for-you templates can be a time-saver.

    Visit Kartra Here…

    Ultimately, the best platform depends on your specific needs and preferences.

    GoHighLevel vs Kartra: Email Marketing and Automation Showdown

    Both GoHighLevel and Kartra offer robust email marketing and automation features but with distinct strengths.

    GoHighLevel excels in its integration with other marketing tools and its flexibility. The platform allows for complex automation scenarios and offers features like “next campaign” and “stop on response” for advanced users.

    Visit Gohighlevel Here…

    Kartra shines in its user-friendly interface and pre-built templates. While its automation capabilities are solid, it might not match the depth and complexity offered by dedicated email marketing platforms like ActiveCampaign.

    Visit Kartra Here…

    Ultimately, the best choice depends on your specific needs and preferences. If you prioritize a standalone email marketing tool with advanced features, ActiveCampaign might be a better fit. However, if you prefer an all-in-one solution with a focus on ease of use, Kartra could be the ideal choice.

    GoHighLevel vs Kartra: Online Courses and Membership Areas

    Both GoHighLevel and Kartra offer tools for creating online courses and membership areas, but with distinct strengths.

    GoHighLevel provides a solid foundation for building memberships and online courses, with features like unlimited video hosting and user management. However, its focus on agencies might limit its depth compared to dedicated platforms.

    Visit Gohighlevel Here…

    Kartra excels in delivering a comprehensive online course and membership experience. Its pre-built templates, advanced features, and focus on the user experience make it a strong contender in this category.

    Visit Kartra Here…

    Ultimately, the best choice depends on your specific needs and priorities. If you’re an agency focused on building multiple membership sites, GoHighLevel might suffice. However, if you’re a solopreneur or small business prioritizing a rich learning experience for your students, Kartra’s dedicated features could be more appealing.

    GoHighLevel vs Kartra: Pricing and Value

    Both platforms offer flexible pricing plans with varying features.

    • GoHighLevel: Offers two main plans: Agency Starter ($97/month) and Agency Unlimited ($297/month). While it lacks an annual discount, it provides a generous 14-day free trial without requiring a credit card.

    See Gohighlevel Pricing Plan Here…

    • Kartra: Offers four tiers ranging from $119 to $549 per month. It includes an annual discount but requires a credit card for the free trial.

    See Kartra Pricing Plan Here…

    While both platforms offer competitive pricing, GoHighLevel’s free trial and white-label option might be a slight edge for agencies.

    Gohighlevel vs Kartra

    GoHighLevel vs Kartra: Which is Right for You?

    Both GoHighLevel and Kartra offer powerful tools for building and growing online businesses.

    GoHighLevel excels as an agency-centric platform, providing the necessary tools for managing clients, generating leads, and automating marketing processes. Its white-label capabilities are a standout feature.

    Visit Gohighlevel Here…

    Kartra shines as an all-in-one solution for entrepreneurs and small businesses, offering a comprehensive set of tools for managing various aspects of an online business. Its focus on ease of use and pre-built templates is a key advantage.

    Visit Kartra Here…

    Ultimately, the best choice depends on your specific business needs and goals. Consider your team size, target audience, and desired level of customization when making your decision.

  • Top GoHighLevel Affiliates Earning Big (2025)

    Top GoHighLevel Affiliates Earning Big (2025)

    Top Gohighlevel Affiliates

    Top Gohighlevel Affiliates: GoHighLevel’s Affiliate Powerhouse (Earning Potential Revealed)

    The GoHighLevel affiliate program offers serious earning potential. Top affiliates are raking in a staggering $10,000 to $150,000 every month.

    Here’s the breakdown:

    • As an affiliate, you earn a generous 40% recurring commission every month for each agency client you refer.
    • There’s even more earning potential! You get an additional 5% monthly recurring commission from any clients signed up by your referrals (think of them as your affiliate team).

    The appeal of these high commissions has attracted many agencies and entrepreneurs to the GoHighLevel affiliate program, creating a competitive landscape.

    Let’s dive into the strategies of the top GoHighLevel affiliates who are crushing it and banking $10,000 to $150,000 per month.

    Top Gohighlevel Affiliates

    Gohighlevel 30-day free trial offer

    How Top GoHighLevel Affiliates Dominate

    GoHighLevel spotlights its top affiliates with a monthly leaderboard, showcasing their ongoing success. While rankings can fluctuate, it’s fascinating to see the diverse strategies these high performers use to generate referrals and sign-ups.

    The Top Earners (Top Gohighlevel Affiliates): Unveiling How GoHighLevel’s Affiliate Stars Drive Results

    Here are the two main approaches these affiliate masters use:

    • Agency Powerhouse Affiliates: Some leverage their existing marketing agencies, recommending GoHighLevel to their clients and capitalizing on their established relationships.
    • Content Kings and Queens: Others have built a strong online presence through YouTube channels or informative blogs. They attract potential users with valuable free content and might even offer bonus materials related to GoHighLevel, ultimately converting them into paying customers through their affiliate links.
    Top Gohighlevel Affiliates

    Let’s dissect the winning strategies of the top GoHighLevel affiliates to see what makes them tick.

    1. Jason Wardop (Top GoHighLevel Affiliates)

    Top Gohighlevel Affiliates

    Jason Wardop is a digital marketing guru who wears many hats. He’s an entrepreneur, runs his marketing agency, and is a highly successful promoter of GoHighLevel. In 2022, his achievements with GoHighLevel earned him a Tesla Model Y.

    Jason’s entrepreneurial journey started in 2015 when he secured significant funding to launch his first software company. He eventually sold the company in early 2021.

    Now, Jason leverages his YouTube channel, with over 211,000 subscribers, to teach people how to build online businesses from scratch, even without any initial investment, experience, or technical knowledge. He champions GoHighLevel as the go-to software for businesses and uses his affiliate link to encourage viewers to sign up. To sweeten the deal, he offers bonuses and free courses as incentives.

    Sign Up for the Gohighlevel Affiliate Program Here… 

    2. Dominic Baptist (Top GoHighLevel Affiliates)

    Top Gohighlevel Affiliates

    Dominic Baptist is a young SaaS whiz-kid specializing in HighLevel. He’s climbed the ranks to become one of the platform’s top affiliates, crushing it with over $100k in monthly referral income. This 26-year-old marketing guru from Springfield, Illinois, went from a $15/hour mall job to a breakthrough in the software marketing world.

    Beyond the impressive income, Dominic uses his YouTube channel to empower others. With over 21,000 subscribers, he creates valuable content around GoHighLevel and teaches viewers how to scale their own SaaS businesses. Similar to Jason Wardop, Dominic leverages his YouTube platform to promote his affiliate link and incentivize sign-ups with bonus materials, like free courses. This highlights the power of YouTube as a key traffic source for GHL affiliates.

    Sign Up for the Gohighlevel Affiliate Program Here…

    3. Max Perzon (Top GoHighLevel Affiliates)

    Top Gohighlevel Affiliates

    Max Perzon’s journey began in Sweden in 2014, coding websites as a web developer. He soon discovered a passion for SEO and affiliate marketing, and with relentless effort, became a top player in this exciting field.

    Today, Max’s expertise extends beyond personal success. He runs a thriving online education business, offering courses that guide aspiring entrepreneurs in launching, managing, and scaling profitable online ventures. Additionally, he leads SNMA (Super Niche Marketing Agency), a specialist firm that helps solar and roofing contractors attract more leads, schedule appointments, and convert them into satisfied customers.

    Max’s influence extends to YouTube, where his channel boasts over 53,000 subscribers. He engages his audience with a diverse mix of content, including tutorials on GoHighLevel, the art of cold calling, online business guides, and informative reviews of SaaS platforms.

    Sign Up for the Gohighlevel Affiliate Program Here…

    4. Chris Record (Top GoHighLevel Affiliates)

    Top Gohighlevel Affiliates

    Hailing from Las Vegas, Nevada, Chris Record is a seasoned affiliate marketer and a top earner with GoHighLevel. More than just a marketer, Chris is a passionate entrepreneur who’s earned the moniker “entrepreneur artist.”

    On his YouTube channel, Chris takes a unique approach. He crafts inspiring rap and hip-hop music videos that resonate with aspiring entrepreneurs seeking to elevate their businesses and lifestyles. This creative strategy serves as a source of motivation and guidance.

    Chris’ entrepreneurial spirit extends beyond YouTube. He runs LifePreneur, a thriving marketing agency where he fosters a supportive community and empowers individuals to unlock their entrepreneurial potential.

    Sign Up for the Gohighlevel Affiliate Program Here…

    5. Samuel Fletcher (Top GoHighLevel Affiliates)

    Top Gohighlevel Affiliates

    Samuel Fletcher is a double threat in the GoHighLevel world: a top affiliate and the mastermind behind SupplyGem, a software review powerhouse. Launched in 2018 alongside online business expert Noel Griffith, SupplyGem aims to be your trusted source for unbiased software advice.

    Samuel leverages his experience running online businesses and empowering digital entrepreneurs. This expertise translates into insightful software reviews and comparison guides on SupplyGem. These resources equip you with the knowledge needed to launch, manage, and scale your online business with confidence.

    Sign Up for the Gohighlevel Affiliate Program Here…

    6. Pavel Ketsuk (Top GoHighLevel Affiliates)

    Top Gohighlevel Affiliates

    Pavel Ketsuk is a high-performing GoHighLevel affiliate and the founder of LIT – Leads on Demand, a lead generation agency that gets results. LIT specializes in helping home remodeling companies supercharge their lead flow by securing high-quality leads and appointments every month.

    Pavel’s influence extends beyond LIT. He’s built a YouTube channel with over 39,000 subscribers, where he likely shares valuable insights and strategies.

    Sign Up for the Gohighlevel Affiliate Program Here…

    7. Kasim Aslam (Top GoHighLevel Affiliates)

    Top Gohighlevel Affiliates

    Kasim Aslam is a marketing powerhouse. This entrepreneur wears many hats: Google Ads specialist, top GoHighLevel affiliate, and the CEO of Solutions 8, a US powerhouse Google Ads agency that propels businesses to growth.

    Kasim’s expertise extends far beyond Google Ads. He co-founded The Driven Mastermind, a prestigious global marketing mastermind, and co-authored the Amazon bestseller “You vs. Google.” He’s also a highly sought-after figure in the industry, having served as the first traffic coach for DigitalMarketer.com’s ELITE program and co-hosting the popular Perpetual Traffic podcast.

    Kasim’s mastery of Google Ads has undoubtedly fueled his success as a top GoHighLevel affiliate. He leverages his deep knowledge to help countless businesses achieve their marketing goals.

     Sign Up for the Gohighlevel Affiliate Program Here…

    8. Abigail O (Top GoHighLevel Affiliates)

    While the specifics of Abigail’s strategies remain under wraps, her impressive results speak for themselves. She’s consistently ranked among the top GoHighLevel affiliates, demonstrating a winning approach.

    9. Jasper Aiken (Top GoHighLevel Affiliates)

    Jasper Aiken isn’t just a name, it’s a marketing and video creation powerhouse. This multi-talented individual boasts skills as a professional videographer and video editor. But his talents extend far beyond the screen. Jasper is also a top-ranked GoHighLevel affiliate from the US.

    On his YouTube channel, with over 10,000 subscribers, Jasper merges his passions. He creates valuable content around GoHighLevel, while simultaneously empowering viewers to build their marketing software empires and achieve financial freedom, all from the comfort of home.

    Sign Up for the Gohighlevel Affiliate Program Here…

    10. Damian Player (Top GoHighLevel Affiliates)

    Top Gohighlevel Affiliates

    Damian Player isn’t just an affiliate, he’s a community champion. As the founder of Grind Village, Damian is a serial entrepreneur passionate about empowering the next generation. His focus? Helping young entrepreneurs launch and scale successful SaaS companies.

    Damian’s dedication extends beyond his ventures. He leveraged his expertise to guide over 4,500 individuals in scaling their agencies using the power of GoHighLevel, solidifying his position as a top affiliate for the platform.

    Sign Up for the Gohighlevel Affiliate Program Here…

    Cracking the Code: Become a Top GoHighLevel Affiliate?

    The key to becoming a top GoHighLevel affiliate lies in problem-solving. Show potential customers how GoHighLevel streamlines their online businesses, boosting their income.

    Here’s the playbook top GoHighLevel affiliates use to generate leads and sales:

    • YouTube Domination: This platform reigns supreme for driving traffic.
    • Agency Allure: The agency model is another powerful strategy.
    • SEO Savvy: Search Engine Optimization remains a top contender.
    Top Gohighlevel Affiliates

    Building a Winning Audience (Top GoHighLevel Affiliates):

    Top affiliates don’t just sell software, they build communities. They target a specific audience – entrepreneurs – and position GoHighLevel as the go-to solution.

    Incentivizing Success (Top Gohighlevel Affiliates):

    Top affiliates understand the power of a sweetener. They create valuable resources like courses and bonuses, encouraging sign-ups through their affiliate link.

    The Winning Formula (Top GoHighLevel Affiliates): Education is King

    Top GoHighLevel affiliates prioritize education. They focus on equipping their audience with the knowledge to leverage GoHighLevel effectively. This commitment to value creation is the secret sauce behind their success.

    Sign Up for the Gohighlevel Affiliate Program Here…

  •  110+ Comparing Digital Marketing VS Traditional Marketing Statistics To Know In 2025

     110+ Comparing Digital Marketing VS Traditional Marketing Statistics To Know In 2025

    Digital Marketing vs Traditional Marketing Statistics

    Here are 110+ digital marketing vs traditional marketing statistics you should know in 2025 and beyond;

    In today’s fast-paced, technology-driven world, how businesses approach marketing has significantly transformed. 

    The rise of digital marketing has cast a long shadow over traditional marketing. 

    While some companies cling to old methods, many marketers find themselves at a crossroads: embrace the digital revolution or hold onto the familiar?

    Let’s explore key statistics comparing digital marketing vs. traditional marketing statistics to shed light on this. We’ll also analyze top advertising examples from both sides to help you decide which approach is best for your brand.

    Digital marketing takes the online route, utilizing tactics like search engine optimization (SEO), social media engagement, and email marketing. It’s generally more budget-friendly and allows for precise audience targeting, offering greater measurability.

    On the other hand, traditional marketing operates offline, employing methods like TV commercials, print ads, and direct mail. While effective for broad reach and brand recognition, it can be costlier and offer less data on its impact.

    Digital Marketing vs Traditional Marketing statistics: Key Differences

    1. Cost: Forget fat wallets! Digital marketing lets you stretch your budget further with lower costs per impression and a higher return on investment (ROI).
    2. Targeting: Laser focus, not shotgun blasts! Digital marketing lets you target your ideal customers with pinpoint accuracy based on demographics, interests, and even online behavior.
    3. Measurability: No more guessing games! Digital marketing provides real-time results, so you can see exactly how your campaigns perform and make adjustments.
    4. Speed: Lightning fast! Launch digital marketing campaigns in a flash, unlike traditional marketing’s slow and steady approach.
    5. Interactivity: It’s a two-way street! Digital marketing fosters conversations and engagement with your customers, building stronger relationships.
    6. Scalability: Go global with a click! Digital marketing breaks down geographical barriers, letting you reach customers worldwide.
    7. Personalization: Speak their language! Digital marketing allows you to tailor your message and content to each customer.
    8. Environment: Save the trees! Digital marketing is eco-friendly, reducing the need for physical materials and waste.

    General Digital Marketing Statistics (Digital Marketing VS Traditional Marketing Statistics)

    1. U.S. online shopping is booming: E-commerce revenue is expected to surge from $768 billion in 2021 to $1.3 trillion by 2025. (Source)
    Digital Marketing vs Traditional Marketing Statistics
    1. The U.S. market is predicted to skyrocket by a staggering $657.8 billion by 2029, reaching a record high of $1.9 trillion. That’s a whopping 53.79% increase over just five years. (Source)
    2. The global digital marketing market is expected to reach about $786.2 billion by 2026. (Source)
    3. The U.S. alone is a digital marketing powerhouse, with a market value reaching a mighty $460 billion in 2022. (Source)
    4. The market is expected to grow by 9% annually between 2020 and 2026. (Source)
    5. 78% of brand marketers consider it crucial to their overall strategy. (Source)
    Digital Marketing vs Traditional Marketing Statistics
    1. A recent survey predicts a hefty 8.77% increase in digital marketing spending by B2B product marketers in the U.S., while traditional advertising budgets are expected to shrink by 3.64%. (Source)
    2. Content is king! Savvy marketers understand this. Over 70% of business marketers are actively investing in content marketing. (Source)
    3. Short-form video is the hot new trend. 89% of global marketers believe in the power of short-form video content and plan to keep investing in it. (Source)
    4. By the end of 2022, the U.S. retail e-commerce market was projected to be worth up to $986.10 billion. (Source)
    5. Recent research suggests over 72% of the marketing budget is now allocated to digital ad channels. (Source
    6.  A compelling 60% of adult listeners reported acting after hearing a podcast ad. (Source)
    7. In B2B marketing, the website takes center stage as the most impactful channel. (Source)
    8. 74% use podcasts to discover new products and services. (Source)

    The Digital Canvas: Unveiling Display Advertising Stats (Digital Marketing VS Traditional Marketing Statistics)

    1. Programmatic buying is on the rise for digital outdoor ads. Spending jumped from $180 million in 2020 to $530 million in 2022, showcasing its growing popularity. (Source)
    2. The U.S. is the undisputed champion of banner ads, spending a whopping $61 billion in 2022. That translates to an average of $30.99 per internet user on banner ads. (Source)
    3. Across the pond, Europe’s digital display ad market is thriving. As of 2021, the UK leads the pack with a market value of €14.8 billion, followed closely by Germany at €5.6 billion. (Source)
    4. Digital billboards are lighting up the landscape. The U.S. market for digital outdoor advertising is projected to surge from $2.72 billion in 2020 to a cool $3.84 billion by 2023. (Source)
    5. The global trend is even more impressive. Be ready for a digital outdoor ad explosion – spending is expected to skyrocket from $6.7 billion in 2019 to $15.9 billion by 2027. (Source)
    6. Global spending on banner ads is on fire, In 2022, it reached a staggering $158.2 billion, fueled by a sizzling growth rate of 12.8%. (Source)
    7. Over half (57%) of U.S. consumers admit to paying attention to digital outdoor ads, particularly billboards and street-level displays. (Source)
    8. Digital ads leave a lasting impression. Studies show that seeing display ads, consumers are 155% more likely to search for the brand’s specific terms online. (Source)
    Digital Marketing vs Traditional Marketing Statistics
    1. Mobile is king! 50% of all ad clicks happen on mobile devices, so make sure your campaigns are optimized for smaller screens. (Source)
    2. When consumers see display ads for products they’ve already shown interest in, they’re 70% more likely to make a purchase. (Source)
    3. Digital billboards are stealing the show in the UK! In 2021, digital displays comprised 64% of the country’s total outdoor ad revenue. (Source)

    The Power of Email Marketing: Still Going Strong (Digital Marketing VS Traditional Marketing Statistics)

    Email marketing is a powerful digital marketing channel that allows you to directly connect with customers, promoting your latest products and offers. By integrating it with marketing automation tools, you can deliver personalized messages at the right time, maximizing the impact of your campaigns.

    1. The effectiveness speaks for itself. 79% of marketers rank email marketing as one of their top 3 marketing strategies. (Source)
    2. Email remains a favorite among consumers, with roughly 50% preferring to be contacted by businesses through email. (Source)
    3. Half of media planners already leverage email marketing, and a significant 22% plan to jump on board soon. (Source)
    4.  MailChimp, the leading B2B platform, boasts an impressive annual revenue of $800 million. (Source)
    5. Trailing closely behind is ActiveCampaign, raking in $165 million annually. (Source)
    6. Get ready for a high return on investment (ROI). Email marketing delivers $36 for every $1 spent. (Source)
    7. About 90% of brands consider email marketing to be critical to their success as a brand. (Source)
    8. With a massive audience of over 4.14 billion email users worldwide, email advertising has a bright future for reaching new customers. (Source)
    9. As of 2021, over 65% leverage automation in their email marketing campaigns, ensuring efficient and targeted outreach. (Source)
    10. According to a February 2024 global survey, over half (58%) of marketing executives now use automation tools to streamline their email marketing efforts. (Source)
    11.  The global average click-through rate for marketing emails in 2020 was 2.6%. However, Australia stands out with a higher CTR of 3.1%. (Source)
    12. Reading time for brand emails has dipped to 10 seconds in 2024, compared to 13.4 seconds in 2018. Time to grab attention fast! (Source)
    13. The market is expected to balloon from $7.5 billion in 2020 to $17.9 billion by 2027, thanks to a solid 13.3% CAGR. (Source)
    14. A recent 2023 survey found that 88% of email users check their inboxes several times a day. (source)
    15. In the US, 62% of B2B and B2C marketers boosted their email marketing budgets in the past year, leaving other channels in the dust. (source)

    Social Media Marketing Statistics (Digital Marketing VS Traditional Marketing Statistics)

    1. Social media users are exploding worldwide, with a current user base of 4.9 billion. By 2027, that number is expected to reach a staggering 5.85 billion. (Source)
    2.  A staggering 91.9% of marketers in large US organizations leverage social media platforms for marketing purposes. (Source)
    3.  Globally, social media marketing spending reached an estimated value of $230.30 billion. (Source)
    4. The average US adult spends 2 hours and 25 minutes daily on social media platforms. (Source)
    5.  The annual ad spend is expected to surge at a healthy CAGR of 11.99%, pushing the market volume to a whopping $362 million by 2026. (Source)
    6. Social media marketing spending in the US hit a record high of over $80.67 billion in 2022. (Source)
    Digital Marketing vs Traditional Marketing Statistics
    1. Across 29 countries, 83% of marketers consider social media their primary digital marketing channel. It’s a global force you can’t ignore. (Source)
    2.  The overall market size is estimated at a staggering $72.2 billion. (Source)
    3. Businesses dedicate around 17% of their resources to social media marketing. (Source)
    4.  In 2022, ad spending in the UK hit a cool $12.16 billion, and with a scorching CAGR of 9.28%, that number is expected to climb to a massive $17.34 billion by 2026. (Source)

    Mobile Marketing Performance Statistics (Digital Marketing VS Traditional Marketing Statistics)

    Mobile advertising budgets are on the rise as consumer habits shift towards smartphones. People are spending more and more time on their phones, making them a prime target for advertisers.

    1. Social media reigns supreme in mobile advertising, with a projected market spend of $141 billion in 2022. (Source)
    2. In 2022, worldwide spending hit a staggering $327.1 billion, reflecting a 17.2% jump from the previous year. (Source)
    3. Fueled by surging demand, the mobile ad market is on an unstoppable trajectory, with projections reaching nearly $399.6 billion by 2024 (source).
    4. Mobile marketing budgets are on a steady climb. In just six months, spending jumped from 13.5% in February 2020 to 23% in June. This upward trend is expected to continue, with marketers anticipating a whopping 35.7% of their budgets dedicated to mobile marketing within the next five years (Source).
    5. Nearly seven out of ten marketers are on board with mobile. A study reveals that 69% of surveyed marketers use mobile channels in their digital marketing strategies (Source).
    6. Mobile advertising is on a global spending spree, surging from an estimated $234 billion in 2019 to a projected $495 billion by 2024. (Source)
    7. The US leads the pack in mobile ad spend. A projected $120 billion in 2020 puts them far ahead of China, the second-largest market, by nearly $50 million. (Source)
    8. Smartphones are driving Facebook’s ad revenue. Over 92% came from mobile in 2018, a significant jump from 88% in 2017. (Source)

    Search Engine Marketing Statistics (Digital Marketing vs Traditional Marketing Statistics)

    Search Engine Marketing (SEM) drives Results, combining paid search advertising with organic SEO strategies to supercharge your brand’s search engine visibility. Search engine marketing is a powerful digital advertising strategy for putting you directly in front of your target audience.

    1. Google is the undisputed king when it comes to online searches, holding a massive 91.61% market share globally (Source).
    2. Over 6 in 10 internet users are swayed by Google paid search ads, highlighting their effectiveness in capturing user interest (Source)
    3. In 2019, 75% of people found paid search ads helpful in locating the information they needed on a website or search engine. (Source)
    4. Google dominates the search landscape, holding a staggering 85% share of global desktop searches and a near-monopoly on mobile with a 98% market share. (Source)
    Digital Marketing vs Traditional Marketing Statistics
    1. The first five results on search engines account for more than two-thirds of all clicks. This is approximately 67.6%. (Source)

    Native Advertising Statistics (Digital Marketing VS Traditional Marketing Statistics)

    Native ads are the chameleons of online advertising. They seamlessly adapt to the platform they’re on, delivering paid content that feels like a natural part of the user experience.

    1. Surveys reveal that people find native ads 62% easier to understand compared to display ads, and 31% easier than social media ads. (Source)
    2. native ad recommendations are 27% more trusted than social media ads. (Source).
    3. 50% of marketers recognize native advertising as a force to be reckoned with in the online advertising landscape. (Source)
    4. Native advertising packs a punch! It can boost brand affinity by 18% and purchase intent by 9%. (Source)
    5. Get ready for a native advertising boom! By 2025, the global market is expected to reach $400 billion, reflecting a massive 372% growth since 2020. (Source)
    6. 68% of consumers trust native ads seen in an editorial context, compared to 55% for social media ads. (Source)
    7. Native advertising boasts an average CTR of 0.30%, more than double the click-through rate of display ads (0.12%). (Source)
    8. Consumers are 53% more likely to set their sights on native ads compared to traditional banner ads. (Source)

    General Traditional Marketing Statistics (Digital Marketing VS Traditional Marketing Statistics)

    Traditional Marketing is the opposite of digital marketing it operates offline, employing methods like TV commercials, print ads, and direct mail.

    1. In 2022, business-to-business (B2B) traditional advertising spending in the United States was projected to amount to 17.7 billion U.S. dollars, marking a 5.8 percent increase from the previous year. (Source)
    2. B2B traditional ad spending is expected to keep growing and is projected to reach 19.2 billion dollars by 2024. (Source)
    Digital Marketing vs Traditional Marketing Statistics
    1. Traditional advertising dipped slightly in 2023. Global spending landed at just over $806 billion U.S. dollars, reflecting a 1.9% decrease compared to the previous year’s total of over $821 billion. (Source)
    2. 50% of consumers prefer the convenience of buying online and picking up their purchases in-store, (Source)

    Radio Advertising Statistics (Digital Marketing VS Traditional Marketing Statistics)

    1. The global radio market continues to expand, experiencing a healthy 6.8% compound annual growth rate, reaching over $19.58 billion in 2022. (Source)
    2. Over 90% of U.S. radio ad revenue from 2006 to 2022 stemmed from OTA (over-the-air) broadcasts. (Source)
    3. Retailers pumped an estimated $316 million into radio ads in 2019, securing the number two spot among radio advertisers. (Source)
    4. The market is expected to shrink at a CAGR of -0.46% from 2024 to 2029, reaching a projected volume of US$27.95 billion by 2029. (Source)
    5. The average ad spending per radio listener in the Traditional Radio Advertising market is estimated to be US$9.25 in 2024. (Source)
    6. By 2029, the number of listeners is anticipated to reach 3.21 billion globally. (Source)
    7. The US leads the way in traditional radio ad spending, highlighting the enduring relevance of this medium in the modern marketing world. (Source)
    8. Nearly half (46%) of radio listeners report considering a new product, service, or even a whole new company after hearing an ad on the radio. (Source)
    9. The global radio market is forecast to grow steadily at a CAGR of 4.6%, reaching $23.43 billion by 2026. (Source)

    The Power of the Screen (Digital Marketing VS Traditional Marketing Statistics): Television Advertising Statistics

    Once the king of the living room, television advertising reigned supreme. Reaching millions with captivating audio-visual storytelling, it surpassed the impact of print and radio. However, the rise of the internet and social media has shifted the entertainment landscape. Television viewership has fragmented, reducing the guaranteed reach advertisers once enjoyed.

    Even though TV advertising lost its No.1 top advertising medium spot to the Internet, it is still the second-largest advertising medium. It beats print media.

    1. The global TV advertising revenue was estimated at $151 billion in 2021. However, this figure rose to $159 million in 2022. (Source)
    1. The US TV ad market is projected to reach $81.0 billion by 2025, up from an estimated $72.3 billion in 2021. (Source)
    2. The pandemic hit a pause on TV ad spending. Global revenue dipped to $141 billion in 2020 due to COVID-19 disruptions. (Source)
    3.  The US TV penetration rate has dipped 10 percentage points since 2014, reaching 71% in 2021. (Source)
    4.  The United Kingdom has the highest TV ad spend in Central and Eastern Europe (CEE). (Source)
    5. North America accounted for a massive $64.5 billion television advertising in 2021. (Source)
    6. In 2021, the TV ad revenue in the UK was worth £5.38 billion. (Source)
    Digital Marketing vs Traditional Marketing Statistics
    1. Global revenue lands at roughly $132.4 billion U.S. dollars, down from $135.1 billion in 2022. The trend is expected to continue with slight fluctuations in the coming years. (Source)

    Out-of-Home Advertising Reach (Digital Marketing VS Traditional Marketing Statistics)

    Out-of-home advertising, or OOH for short, goes where people do. Think eye-catching posters, stadium signage, dynamic digital billboards, and even airplane ads, all designed to grab attention outside the home.

    1.  JCDecaux, the world’s largest outdoor advertising company, raked in over $3.2 billion in revenue in 2021. (Source)
    2.  In 2021 Clear Channel Outdoor Company is the second largest outdoor advertising firm globally with a revenue of $2.2 billion. (Source)
    3. McDonald’s dominated the U.S. out-of-home advertising landscape, shelling out $59.9 million on ads. Apple trailed closely behind, spending $57 million. (Source)
    4. A survey found that a whopping 92% of marketers in the U.S. increased their spending on outdoor ads in 2022. (Source)
    5. The U.S. billboard scene saw a surge in 2021, with the number jumping from 343,106 in 2020 to over 351,000 by year’s end. (Source)
    6. A U.S. survey revealed an 84% anticipation of more interactive outdoor advertisements among over 611 marketers. Additionally, 60% of those surveyed believe declining digital ad effectiveness is due to consumer fatigue with digital content. (Source)
    7. 92% of U.S. marketers surveyed ramped up their outdoor advertising in 2022. (Source)
    8. Billboards reign supreme in outdoor advertising, with 80% of U.S. consumers noticing them. Following closely behind are printed signs displayed in physical locations. (Source)
    9.  The global billboard and outdoor market is expected to reach a staggering $66.8 billion by 2022 (Source)
    10. The market is projected to grow at a healthy Compound Annual Growth Rate (CAGR) of 8.3% between 2022 and 2026 (Source)
    11. By 2026, the market is expected to be valued at an even more impressive $87.76 billion, with a CAGR of 7.1% (Source)
    12. The global outdoor advertising spending reached over $34 billion in 2021. The value is expected to increase to $42 billion by 2024. (Source)

    Telemarketing Statistics (Digital Marketing VS Traditional Marketing Statistics)

    Telemarketing is all about reaching out to potential buyers with phone calls to promote products or services. Think of it as the original “cold call,” connecting with folks who might not be expecting your pitch.

    Phone calls are still the preferred means of communication for marketers, especially due to increased remote jobs and limitations on face-to-face interactions.

    1. There’s a 75% chance of the prospect picking up on the first attempt. (Source)
    2. The best time of the day to call prospective customers is between 4 pm and 5 pm. (Source)
    3. Over 93% of a cold call’s success hinges on the caller’s vocal tone. (Source)
    4. 76% of top performers say they “always” perform research before reaching out to prospects. (Source)
    5. 63% of sellers say cold calling is the worst part of their job. (Source)
    Digital Marketing vs Traditional Marketing Statistics
    1. 75% of CEOs said they would take based on call cold. (Source)

    Print Advertising Statistics (Digital Marketing VS Traditional Marketing Statistics)

    The print advertising industry is all about tangible impact. It includes classic channels like consumer magazines, newspapers, posters, and banners – all delivered in physical, printed form. The digital versions are excluded.

    1. Newspapers take the crown in the world of print advertising, boasting a massive market volume of $35.59 billion in 2022. (Source)
    2. By 2029, the number of readers in the Print Advertising market is estimated to reach 3.1bn users. (Source)
    3. Ad spending in the global Print Advertising market is expected to hit $34.28 billion in 2024. (Source)
    4. The global ad spend on magazine advertising reached a cool $14.79 billion in 2022. (Source)
    5. The global ad spend for print advertising was about $50.38 billion in 2022. (Source)
    6.  The total number of print newspaper readers, worldwide, is expected to reach over 1.2 billion by 2026. (Source)

    Direct Mail Advertising Statistics (Digital Marketing VS Traditional Marketing Statistics)

    Think of direct mailing as old-school email marketing. It’s all about reaching your target audience with physical sales materials like brochures, coupons, or even free samples – delivered straight to their doorstep.

    1. Direct mail boasts a knockout open rate of 80-90%, leaving email marketing in the dust with just 20-30%. (Source)
    2. The market is expected to experience an annual growth rate (CAGR 2024-2029) of 1.14%, leading to a projected market volume of US$61.59bn by 2029. (Source)
    3. While digital ads battle for attention, direct mail cuts through the noise. This personalized and tangible marketing strategy is a global success story, proving that sometimes, old-school tactics still reign supreme. (Source
    4. 74% of marketers claim that direct mail delivers the best ROI response rate and conversion rate of all other channels. (Source)
    5. The global direct mail market soared to a staggering $72.67 billion in 2022, proving that direct mail still packs a punch. (Source)
    6. Direct mail continues to be a big deal in the U.S., with spending reaching a hefty $43.3 billion in 2022. (Source)
    Digital Marketing vs Traditional Marketing Statistics

    Marketers in the US have a toolbox of direct mail formats to choose from. Newsletters and postcards keep it concise, while self-mailers offer more space for your message. For a bigger impact, catalogs and packages can showcase your products in all their glory.

    FAQs About Digital Marketing vs Traditional Marketing (Digital Marketing VS Traditional Marketing Statistics)

    1. What is the difference between digital marketing and traditional marketing? Digital marketing refers to the promotion of products, brands, or services using digital channels, while traditional marketing refers to the promotion of products, brands, or services using offline channels.
    2. Which is more effective, digital marketing or traditional marketing? The most effective strategy often lies in combining both approaches, using digital marketing to reach a wider audience and traditional marketing to create an emotional connection with customers.
    3. What are the advantages of digital marketing? Digital marketing provides increased reach, improved targeting, cost-effectiveness, measurable results, and flexibility.
    4. What are the disadvantages of digital marketing? Digital marketing is vulnerable to information overload, constant evolution, security concerns, and dependence on technology.
    5. What are the advantages of traditional marketing? Traditional marketing provides a tangible, physical experience for customers, emotional connection, brand awareness, and local reach, and no technology is required.
    6. What are the disadvantages of traditional marketing? Traditional marketing can be expensive, limited in reach, difficult to measure, time-consuming, and have a negative environmental impact.

    Conclusion: Digital Marketing VS Traditional Marketing Statistics

    The age-old debate continues to rage: is digital marketing more effective than traditional marketing? The answer, however, is a complex one. It depends on your company’s unique needs and marketing objectives.

    The digital vs traditional marketing puzzle has been a topic of discussion for as long as digital marketing has been around. While traditional marketing may be considered “old-fashioned” by some, it still holds a special place in the hearts of many consumers.

    Take direct mail marketing, for instance. Statistics show that it leads to higher response rates and ROI. Contrary to popular belief, traditional marketing is still alive and kicking, and it takes savvy marketers to unlock its full potential.

    Rather than pitting digital against traditional, why not harness the power of both? Each has its strengths and weaknesses; combining them allows you to create a truly unstoppable marketing strategy.

    For example, traditional marketing excels at reaching local audiences and establishing credibility, while digital marketing can increase your reach and exposure to a wider target audience. Multichannel marketing statistics confirm that using multiple marketing channels is the key to achieving positive results.

    So, why choose between digital and traditional marketing when you can use both to supercharge your marketing strategy, generate more leads, and boost sales?

    Digital Marketing vs Traditional Marketing Statistics
  • 70+ Fascinating Employer Branding Statistics And Trends In 2025

    70+ Fascinating Employer Branding Statistics And Trends In 2025

    Employer Branding Statistics

    Employer Branding Statistics: More Than Just a Marketing Buzzword

    Employer branding isn’t merely a marketing tactic; it’s the heart and soul of a company’s identity. It’s the promise of an experience, the reflection of a company’s values, and the magnet that attracts top talent.

    Imagine joining a company based on a carefully crafted image, only to find a stark contrast between the advertised culture and the reality. This disconnect can be devastating for both the employee and the company.

    A strong employer brand is crucial for attracting and retaining top talent. It goes beyond simply filling positions; it’s about building a team that shares the company’s vision and contributes meaningfully to its success. In the following sections, we’ll delve deeper into the importance of employer branding and explore strategies to build a compelling employer brand.

    Employer Branding by the Numbers: Key (Employer Branding Statistics)

    Employer Branding Statistics

    Employer branding is more than just a buzzword; it’s a strategic imperative. These key statistics underscore its significance in today’s competitive talent landscape:

    • Employer Brand Drives Job Applications: A robust employer brand is a powerful magnet for top talent. Over three-quarters of job seekers (76%) research a company’s employer brand before applying.
    • The Impact of Positive Employer Reputation: A strong employer brand significantly increases job application rates. An overwhelming 96% of job seekers are more likely to apply for a role at a company with a positive reputation.
    • The High Cost of a Poor Employer Brand: A lackluster employer brand can lead to high turnover rates. 92% of employees are open to exploring new opportunities if a company with a better reputation comes along.
    • Leveraging Employee Advocacy: Employees are your brand ambassadors. 72% of employer branding teams utilize their employees to promote the company culture and values.
    • Gender Disparities in Employer Expectations: Women are more likely (19%) to seek new employment due to a perceived lack of opportunities, highlighting the need for inclusive employer branding.
    • The Great Resignation and Flexible Work: The pandemic has shifted employee priorities. 76% of people are open to new job opportunities if flexible work policies are reversed.
    • Total Rewards Package: While salary remains crucial (61%), factors like work-life balance (57%), job security (55%), and a pleasant work atmosphere (54%) are increasingly important. Women emphasize a positive work environment (59% vs. 50% of men).
    • Beyond Salary: To enhance employee satisfaction and retention, 22% of employees desire additional perks like salary protection and fair compensation.

    These statistics underscore the critical role of employer branding in attracting, retaining, and engaging top talent. By investing in employer branding, companies can create a powerful competitive advantage.

    Employer Branding: Key Statistics and Trends

    Employer branding has evolved into a critical component of a company’s overall strategy. Here’s a data-driven snapshot of its impact:

    The Power of Employer Branding (Employer Branding Statistics)

    Job Seeker Behavior (Employer Branding Statistics):

    1. A majority (76%) of job seekers research a company’s employer brand before applying. (source)
    2. LinkedIn is a primary tool for job searches, utilized by over 75% of recent job changers. (source)
    3. Company websites and social media are initial research points for 52% of job applicants. (source)

    Employer Brand Challenges and Opportunities (Employer Branding Statistics):

    1. Talent acquisition leaders recognize social and professional networks as powerful tools for employer branding (68%). (source)
    2. The primary challenge for job seekers is understanding a company’s work environment and culture. (source)
    3. The focus is shifting from employee engagement to employee experience, with 55% of professionals recognizing this trend. (source)
    4. Acquiring top talent is a significant challenge for 40% of employer branding professionals. (source)
    5. Negative reviews deter job seekers, with 87% hesitant to apply to companies with negative feedback. (source)

    Employee Preferences and Expectations (Employer Branding Statistics)

    What Employees Value (Employer Branding Statistics):

    1. Wages remain the top factor in job offers (61%). (source)
    2. Work-life balance (57%), job security (55%), and a positive work atmosphere (54%) are increasingly important. (source)
    3. Women place a higher value on a pleasant work atmosphere (59% vs. 50% of men). (source)
    4. Opportunities for growth and development are crucial for 22% of employees. (source)

    The Rise of Remote Work and Flexibility (Employer Branding Statistics):

    1. 76% of people are open to new job opportunities if flexible work policies revert. (source)
    2. 42% of candidates won’t apply for roles without their preferred working model. (source)

    The Role of Technology in Employer Branding (Employer Branding Statistics)

    1. AI Adoption: While still in its early stages, 20% of employer branding professionals use AI, with another 15% considering it. (source)
    2. Employee Advocacy: 72% of employer branding teams leverage employees as brand ambassadors. (source)
    3. Video Content: There’s a growing preference for video content (42%) to understand company culture. (source)

    Diversity and Inclusion in Employer Branding (Employer Branding Statistics)

    1. Gender Disparities: Women are more likely (19%) to perceive a lack of opportunities compared to men. (source)
    2. Reskilling and Upskilling: 69% of workers, especially younger generations, prioritize reskilling opportunities. (source)

    Employer Branding in a Global Context (Employer Branding Statistics)

    1. Global Adoption: Over half (53%) of HR professionals in Brazil have employer branding strategies. (source)
    2. Brand Guidelines: In the US, only 30% of companies have established brand guidelines. (source)
    3. A significant disparity exists in AI training adoption across generations. While 32% of individuals aged 25-34 actively participate in regular AI training sessions. (source)
    4. this figure drops dramatically to just 5% among Baby Boomers. (source)

    These statistics underscore the evolving landscape of employer branding. Companies must adapt their strategies to meet the changing expectations of the workforce, leveraging technology and employee advocacy to build a strong and compelling employer brand.

    The Impact of Employer Branding on Talent Acquisition and Retention (Employer Branding Statistics)

    1. Employer Brand as a Deciding Factor: A strong majority (76%) of job seekers prioritize research into a company’s employer brand before applying. (source)
    2. Digital Age Job Search: LinkedIn has become a dominant platform in job searches, utilized by over 75% of recent job changers. (source)
    3. Employer Brand Dissemination: Talent acquisition leaders recognize the power of social and professional networks (68%) in promoting employer brands. (source)
    4. The Job Seeker Journey: Company websites and social media are initial touchpoints for 52% of job applicants. (source)

    Challenges in Employer Branding (Employer Branding Statistics)

    1. Understanding Company Culture: Job seekers struggle to grasp a company’s work environment and culture. (source)
    2. Talent Acquisition Difficulties: Securing top talent is a challenge for 40% of employer branding professionals. (source)
    3. Leveraging Employee Advocacy: 72% of employer branding teams utilize employees as advocates. (source
    4. identifying and engaging top talent remains a challenge (30%). (source)

    The Evolving Workplace and Employee Expectations (Employer Branding Statistics)

    1. Shift from Engagement to Experience: The focus is shifting from employee engagement to employee experience, recognized by 55% of professionals and desired by 77% of job seekers. (source)
    2. The Great Resignation and Talent Mobility: A significant number of employees (84%) considered leaving their jobs for better opportunities. (source)
    3. while 92% would consider switching to a more impressive employer brand. (source)
    4. Work-Life Balance and Flexibility: Flexible work arrangements (76%) and job security (55%) are increasingly important to employees. (source)
    5. with women placing a higher emphasis on work-life balance (59% vs. 50% of men). (source)
    6. Employee Development and Growth: Opportunities for growth and development are crucial for 69% of workers, particularly younger generations. (source)

    The Role of Technology and Diversity in Employer Branding (Employer Branding Statistics)

    1. AI Adoption in Employer Branding: While still in its early stages, 20% of employer branding professionals use AI, with another 15% considering it. (source)
    2. Video Content and Employee Advocacy: There’s a growing preference for video content (42%) in understanding company culture. (source)
    3. 72% of employer branding teams leverage employees as advocates. (source)
    4. Diversity and Inclusion: Women are more likely to perceive a lack of opportunities (19%), and there’s a need for greater focus on diversity and inclusion in employer branding strategies. (source)

    Industry Trends and Challenges (Employer Branding Statistics)

    1. Job Search Platforms and Channels: While Indeed remains the most popular job portal (56%).  (source)
    2. recruitment agencies (41% in APAC, and 19% in Latin America) are gaining traction. (source)
    3. Sectoral Differences: Retail and hospitality have higher perceived accessibility for job seekers compared to sectors like chemicals and life sciences. (source)
    4. The Rise of Remote Work: White-collar workers experienced a more significant decline in remote work compared to blue-collar workers. (source)

    Key Priorities for Employees (Employer Branding Statistics)

    1. Compensation and Benefits: Salary remains the top priority (61%) (source)
    2.  followed by work-life balance (57%). (source)
    3. and job security (55%). (source)
    4. Work Environment: A pleasant work atmosphere is crucial for 54% of employees, with women placing a higher value on it. (source)
    5. Career Growth: Opportunities for reskilling and upskilling are important to 76% of workers, particularly white-collar employees. (source)

    These statistics highlight the evolving landscape of employer branding and the increasing importance of creating a positive and inclusive workplace culture to attract and retain top talent.

    1. Employer Brand Drives Job Seeker Behavior: 88% of job seekers consider a company’s employer brand before applying. (source)
    2. The Power of Social Media: LinkedIn is a dominant platform for job searches (75%). (source)
    3. while company websites and social media are initial research points for 52% of applicants. (source)
    4. Building a Strong Employer Reputation: Companies with positive employer brands are three times more likely to make quality hires and enjoy a 50% decrease in cost-per-hire. (source)
    5. Employee Satisfaction and Loyalty: Employees who understand and connect with their company’s mission are 67% more engaged. (source)
    6. a positive employer brand can boost employee referrals by 51%. (source)
    7. Diversity and Inclusion: 78% of companies prioritize diversity to enhance their employer brand. (source)
    8. while 67% of job seekers consider workplace diversity a crucial factor. (source)
    9. The Power of Employer Brand: 69% of job seekers would turn down a job offer from a company with a poor reputation, even when unemployed. (source)
    10. Impact on Turnover: Companies boasting strong employer brands experience a 28% reduction in turnover rates. (source)
    11. The Digital Age Job Seeker: 64% of job seekers won’t consider a company without an online presence, highlighting the importance of a robust digital footprint. (source)
    12. Transparency and Company Culture: 76% of candidates prioritize understanding team culture and values before accepting a job offer. (source)
    13. Cost Efficiency: Companies with a robust employer brand can significantly reduce hiring costs by up to 50%. (source)
    14. Talent Retention: A positive employer brand can increase employee retention rates by 28%. (source)
    15. Accelerated Hiring: Streamline your recruitment process with a strong employer brand, reducing time-to-hire by up to 50%. (source)
    16. Candidate Attraction: A remarkable 76% of job seekers prioritize a company’s reputation when considering employment opportunities. (source)
    17. Recruitment as a Marketing Function: HR professionals increasingly recognize recruitment as a marketing discipline (86%). (source)
    18. Candidate Journey: A Marketing Funnel: Understanding the candidate journey is crucial. 48% of job seekers use social media to research company culture before applying, mirroring traditional marketing funnel behaviors. (source)
    19. Employer Reputation Management: A company’s response to reviews significantly impacts its employer brand (67%). This echoes the importance of reputation management in marketing. (source)
    20. Culture as a Competitive Advantage: A strong company culture is a powerful differentiator (82%), similar to how unique value propositions drive product differentiation in marketing. (source)
    21. Employer Branding: The Key to Talent Acquisition: 89% of HR leaders recognize employer branding as a competitive advantage in attracting top talent, mirroring the role of brand building in driving sales. (source)

    Shaping Your Company’s Future (Employer Branding Statistics): Top Employer Branding Trends for 2024

    In today’s fiercely competitive talent market, a strong employer brand is no longer a luxury but a necessity. To stay ahead, companies must adapt to the evolving landscape. Let’s explore the key trends shaping employer branding in 2024.

    Employer Branding Trends (Employer Branding Statistics): Shaping the Future of Work

    Employer branding has evolved from a mere marketing tactic to a strategic imperative. Here are some key trends shaping the landscape:

    The Rise of Employer Value Proposition (EVP) (Employer Branding Statistics)

    • Defining Your Company’s Promise: EVP encapsulates a company’s unique value offering to employees, encompassing benefits, culture, growth opportunities, and work-life balance.
    • Employee Well-being: A strong EVP prioritizes employee well-being with initiatives like generous leave policies, employee assistance programs, and wellness initiatives.

    Diversity, Equity, and Inclusion (DEI) as a Business Imperative (Employer Branding Statistics)

    • Building a Strong Reputation: DEI initiatives are essential for building a positive brand reputation and fostering trust with customers and employees.
    • Driving Business Success: A diverse and inclusive workplace fosters innovation, creativity, and better decision-making.

    The Impact of AI on Employer Branding (Employer Branding Statistics)

    • Recruitment Revolution: AI is transforming recruitment by automating tasks, improving candidate matching, and enhancing the overall candidate experience.
    • Data-Driven Insights: AI-powered analytics provide valuable insights into employer brand perception, enabling data-driven decision-making.

    The Evolving Role of the Employee (Employer Branding Statistics)

    • Employee Experience as a Top Priority: The focus has shifted from employee engagement to employee experience, emphasizing overall well-being and job satisfaction.
    • The Power of Employee Advocacy: Employees are becoming powerful brand ambassadors, sharing their experiences on social media and influencing potential candidates.

    The Changing Job Market (Employer Branding Statistics)

    • Talent Shortage: The competition for top talent is fierce, with companies vying for the best candidates.
    • Remote Work and Flexibility: Flexible work arrangements are increasingly in demand, with a significant impact on employer branding.
    • Employee Expectations: Employees prioritize work-life balance, job security, and opportunities for growth and development.

    These trends highlight the dynamic nature of employer branding. To thrive in today’s competitive landscape, companies must prioritize employee experience, embrace diversity and inclusion, and leverage technology to build a compelling employer brand.

    Employer Branding: The Cornerstone of Business Success (Employer Branding Statistics)

    Employer branding is more than just marketing; it’s the foundation of a thriving organization. By aligning a company’s values, culture, and employee experience, it fosters a powerful connection with both current and potential employees.

    A strong employer brand is a strategic asset that drives business growth. It attracts top talent, boosts employee retention, and enhances a company’s reputation. By prioritizing employer branding, organizations can create a workplace where employees feel valued, engaged, and motivated to contribute to the company’s success.

    Ultimately, a strong employer brand is a win-win for both employees and the company.

    Employer Branding Statistics