
(QR Code Statistics) QR codes are here to stay: Here, are some of the latest QR code statistics;
I’ll never forget the thrill of scanning my first QR code. It felt like discovering a hidden universe of information. These tiny squares have become an everyday part of our lives. Incredible, isn’t it? QR code use has exploded over the past year, shooting up by 96%! It’s mind-boggling.
From being used to track vehicles during manufacturing to becoming one of the biggest marketing trends of the decade, QR codes have come a long way. You can’t escape them these days.
Let’s explore some of the latest QR code statistics.
QR Code Statistics (Editor’s Pick)
- Almost nine of ten smartphone owners have scanned a QR code at least once.
- Over a third of shoppers won’t buy if they can’t pay with a QR code.
- Major social media platforms use built-in QR codes to add friends by scanning unique codes.
- QR code payments are booming, with a global market value of $10.28 billion in 2022, and are expected to grow rapidly.
- China is the QR code king, with billions of devices using them for payments.
- QR code use in the U.S. is on the rise, with millions of households and consumers adopting the technology.
- QR codes are driving big business, with billions of coupons redeemed in 2022 alone.
- QR codes are taking the world by storm. Over 26 million scans were recorded across more than 50 countries.
What Is A QR Code? A QR code (Quick Respond Code) is a type of barcode that a digital device can scan. It looks like a square with a pattern of black and white squares. Unlike traditional barcodes, QR codes can store much more information, such as website links, contact details, files, images, audio, videos, and more.
It’s a quick and easy way to access information or take action with your smartphone.
QR Code Statistics, Usage, Trends, and Forecasts
- Black is the most common color for QR codes, preferred by 85% of users. (Source)
- Global QR code data reveals 26.95 million scans from over 50 countries. (Source)
- With a 26% increase from 2020, almost 89 million Americans scanned QR codes via their smartphones in 2022. This upward trajectory is set to endure, as estimates predict the US user base to surpass 100 million by 2025. (Source)
- A vast majority, 86.66%, of smartphone users have experienced scanning a QR code, with 36.40% engaging in this activity weekly. Moreover, 46.81% of individuals perceive QR codes as facilitating a touchless lifestyle. (Source)
- China reigned supreme in QR code payment adoption in 2022, boasting approximately 10 billion mobile devices equipped with this technology. (Source)
- The survey revealed a marked disparity in QR code security perceptions, with 42.55% of participants feeling safest scanning at restaurants, bars, or cafés, while only 19.4% shared this sentiment for fitness centers. (Source)
- A significant portion of consumers, representing 38.99% of respondents, expressed a desire for expanded QR code utilization going forward. (Source)
- 57% of consumers prefer merchants’ digital payment options while shopping from stores (Source)
- The data revealed that 67% of participants found QR codes to simplify their lives. (Source)
- More than 30% of Italian galleries and museums currently offer QR code services, with an additional 40% planning to implement them in the future. (Source)
- QR codes have been integrated into the signage of Abu Dhabi. (Source)
- Over 90% of iOS devices and 85% of Android devices come with pre-installed QR code scanners. (Source)
- QR codes are now utilized by half of all restaurants in the United States. (Source)
- According to Bitly, downloads for QR codes skyrocketed by 750% in the last 18 months. (Source)
- QR codes play an instrumental role in making AR experiences available to users. The global AR and VR market is projected to grow by $162.71 billion by 2025. (Source)
- Google Chrome is in the process of creating a feature for its Chrome Canary browser that allows users to share web pages by generating QR codes. (Source)
- QR code payments in Japan have grown, reaching nearly 15 trillion yen in transaction value. (Source)
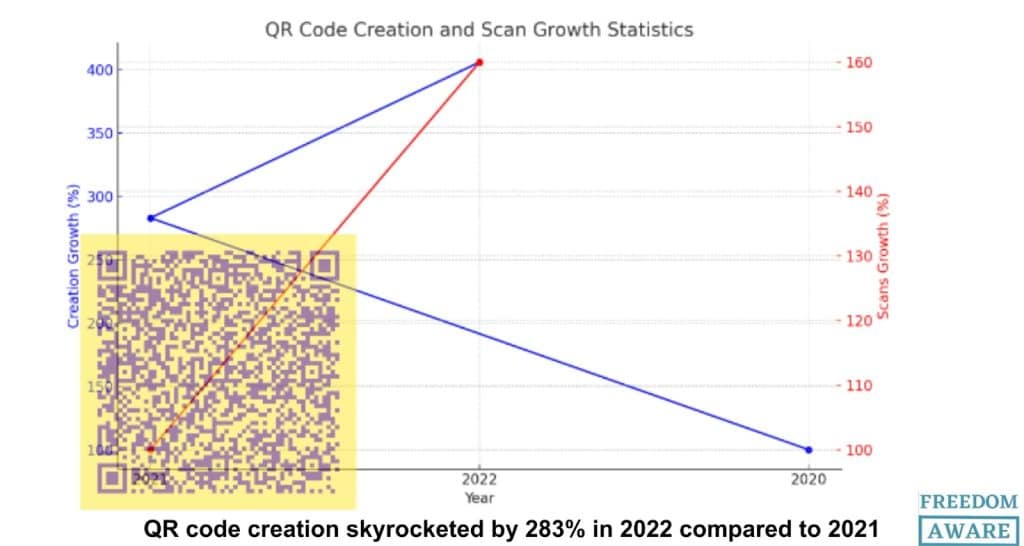
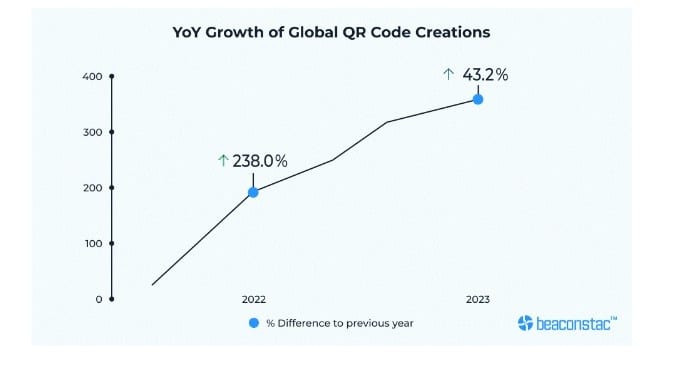
- QR code creation skyrocketed by 283% in 2022 compared to 2021 and increased by an additional 43% the previous year. While global QR code scans surged by nearly 60% in the same period. (Source)
- Website QR codes dominate the market, comprising a substantial 49% of all QR codes generated within the past year. (Source)
- The prospect of increased QR code use resonates with 75% of adults. (Source)
- This trend is more pronounced among younger age groups, with 82% of 18-44-year-olds expressing interest, while the figure drops to 64% for those aged 45 and above. (Source)
- Similar to barcodes, QR codes incorporate error correction, allowing for data recovery even when up to 30% of the code is damaged or obscured. (Source)
- While 54% of 18-24 year-olds have frequently used marketing-related QR codes, this figure drops to 48% for 30-44 year-olds and further declines to 44% for those aged 45-64. (Source)
- Major social media platforms use built-in QR codes to add friends by scanning unique codes. (Source)
- In Latin America, QR code transaction values were projected to surpass $1.4 billion by the same year. (Source)
- A staggering 5.3 billion coupon codes were redeemed through QR codes in 2022. (Source)
- Scantrust SA forecasted a robust 67% of Singaporeans were utilizing QR codes for mobile payments in 2018, anticipating an explosive surge in adoption during the following years. (Source)
- The year 2019 saw the introduction of JPQR, a uniform QR code for all payment providers in Japan. (Source)
- As stated by Peabody, Mezze and the entire Boqueria chain adopted QR code menus in place of printed ones during the COVID-19 crisis. (Source)
- The global QR code payment market experienced significant growth, expanding from a valuation of $8.07 billion in 2020 to a projected $35.07 billion by 2030. This represents a robust compound annual growth rate (CAGR) of 16.1% from 2021 to 2030. (Source)
- A 2021 survey found that 45% of US shoppers had used a marketing QR code in the past three months, with the highest usage among 18-29-year-olds. Additionally, 59% believed QR codes would become a permanent feature of mobile phone usage. (Source)
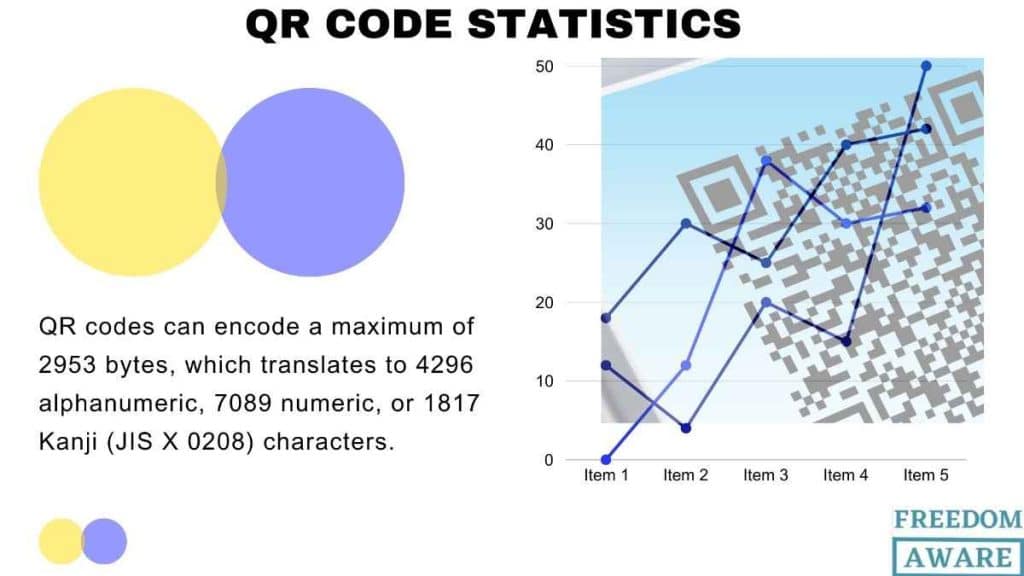
- QR codes can encode a maximum of 2953 bytes, which translates to 4296 alphanumeric, 7089 numeric, or 1817 Kanji (JIS X 0208) characters. (Source)
- The global QR code payment market experienced rapid growth, reaching a valuation of USD 10.28 billion in 2022. This upward trajectory is projected to continue, with an anticipated compound annual growth rate (CAGR) of 17.03% extending through 2028. (Source)
QR Code Adoption Across Nations (QR Code Statistics)
- A substantial majority of consumers in China (81%), Hong Kong (78%), and Singapore (74%) have significantly increased their QR code usage. (Source)
- In Spain, QR code usage has increased for 60% of consumers, while 25% maintain their previous usage levels. (Source)
- A majority of consumers (67%) perceive QR codes as user-friendly, facilitating easy access to information. This trend is consistent across most markets, with notable exceptions in Denmark and the United States, where agreement levels dip to 50% and 44%, respectively. (Source)
- Approximately 50% of Italians and Spaniards intend to increase their QR code usage, contrasting sharply with the more hesitant attitudes of Germans and French consumers. (Source)
- Twenty percent of European consumers expressed uncertainty about increased QR code usage in the future. (Source)
- 16% of males and 10% of females used smartphones to scan QR codes for information. (Source)
- In 2020, MobileAssist, a Bahamian financial technology firm, teamed with Super Value to allow customers to pay for groceries with QR codes. (Source)
- QR code usage in the Bahamas is growing, with over 90,000 downloads and 7,500 registered users of MobileAssist’s app. (Source)
- The Central Bank of the Bahamas introduced a digital Bahamian dollar using QR codes for payments and fund transfers. (Source)
- AML Foods partnered with Kanoo to introduce QR code payments in their stores. (Source)
- Mercado Pago and TodoPago are the leading QR code payment platforms in Argentina. (Source)
- Mercado Pago achieved a significant milestone, processing 8.2 million QR code transactions within its first year of operation. By March 2019, the platform had already garnered a user base of 3 million. (Source)
- TodoPago boasts a user base of 1.5 million buyers and 600,000 merchants. Its strategic focus on QR codes propelled app downloads to triple in 2018, and the platform continues to expand its reach. (Source)
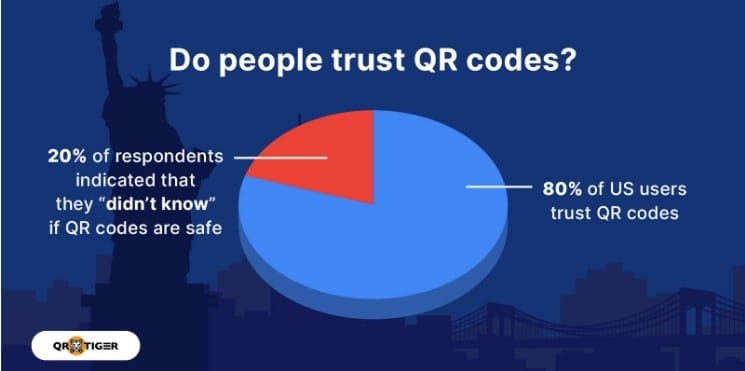
- A strong majority of 80% of US users express confidence in QR codes. (Source)
- QR codes facilitate efficient inbound travel to the Bahamas. (Source)
- QR code payments in Argentina witnessed rapid growth, with a user base expanding from 3% of adults in 2018 to a projected 24% in 2022. (Source)
- Upon acceptance, international students bound for the Bahamas receive a unique QR code for expedited entry. (Source)
- Consumers primarily use food QR codes to access product details (57%), followed by brand websites (43%). Other popular uses include product or company information (34%), recipes (25%), and interactive games (9%). (Source)
- A significant portion of Canadians, 36%, shun retailers lacking contactless payment options, while half of the population consciously restricts purchases to stay within contactless spending limits. (Source)
- According to GSMA 2020, Mexico’s overall annual QR code digital payment transaction growth rate is predicted to be 18.8% between 2020 and 2024. (Source)
- Over half of Mexican consumers reported increased QR code usage, while roughly a quarter maintained previous levels. The country’s population is notably enthusiastic about future QR code adoption. (Source)
- In India, the transaction value of QR code payments is expected to rise from $62 billion in 2022 to $125 billion in 2026. This is driven by a national QR code standard and reduced cash usage. (Source)
- Predictions for 2020 indicated that QR code scanning would reach 11 million U.S. households. (Source)
- The number of U.S. smartphone users scanning QR codes is projected to increase by 16 million between 2022 and 2025. (Source)
- Contactless payments in the U.S. experienced a dramatic 150% increase since March 2019. This surge directly contributed to an 11% rise in QR code adoption since the onset of the pandemic. (Source)
- Over a third of consumers strongly prefer QR code payments and will abandon a purchase if this option is unavailable. (Source)
- Bharat QR code acceptance surged past 4.8 million in India by September 2022, with the goal of unifying QR code payments across all merchant locations. (Source)
- India holds the second position with a staggering 1,101,723 million QR code scans. (Source)
- Two-fifths of India’s population are familiar with and utilize QR codes. (Source)
- In 2018, the BMC planned to digitize the Cooperage Bandstand in Colaba, Mumbai, with a QR code. Hindustan Petroleum introduced a customer feedback initiative via QR code that same year. (Source)
- QR code generation has quadrupled between 2021 and 2024. (Source)
- UPI QR codes experienced significant growth, surging 79% to reach 272 million by June 2023. (Source)
- The Asia Pacific region witnessed an 83% surge in QR codes for packaging between 2014 and 2018. (Source)
Conclusion on QR Code Statistics
QR codes have rapidly gained prominence in recent years, emerging as versatile tools for businesses and individuals to share information and products effortlessly. The data presented in this article underscores the global surge in QR code adoption.
QR codes are an enduring trend, offering businesses the opportunity to enhance customer engagement and experiences through effective implementation.
FAQ (QR Code Statistics)
What percent of people use QR codes?
A vast majority, 86.66%, of smartphone users have encountered QR codes, with a significant portion, 36.40%, scanning at least once weekly.
How big is the QR code market?
The QR Code Solution market is projected to experience substantial growth, expanding from US$1,038.72 million in 2023 to US$2,247.17 million by 2030. This represents a compound annual growth rate (CAGR) of 11.44% over the forecast period.
What are the statistics of QR code menu?
Menu QR codes have become a staple in the food and beverage sector, particularly since the pandemic. By offering contactless menu access, they’ve transformed the dining experience. A substantial 75% of restaurants have adopted this technology, leading to a 30% decrease in menu printing costs and a remarkable 40% surge in customer engagement.
How can we check how many people have scanned a QR code?
Dynamic QR Codes offer advanced tracking capabilities. Unlike static codes, they display a total scan count and a link to detailed performance metrics within the dashboard. This real-time data provides valuable insights into code engagement.
Which country uses QR codes the most?
Determining the global leader in QR code usage is challenging due to varying data sources. While China boasts an impressive 10 billion mobile devices equipped for QR code payments, the United States leads in terms of total scans, reaching 2,880,960 million.
Do QR codes expire?
Static QR codes are permanent. Once created, they always direct users to the same fixed destination, such as a website or specific data.
Leave a Reply