Print marketing statistics: Discover the surprising benefits of print marketing with these eye-opening statistics;
It’s easy to assume that online marketing is the only way to reach your target audience. However, print marketing remains a powerful tool for businesses looking to make a lasting impression and drive results. Despite the rise of digital marketing, print marketing continues to deliver impressive returns on investment. Research shows that print marketing is still a highly effective way to reach and engage consumers. Print materials generate more responses and are seen as more trustworthy and memorable than digital ads.
Here are some surprising print marketing statistics that will make you rethink your marketing strategy.
Key Print Marketing Statistics (Editor’s Pick)
- 70% of consumers prefer to receive print ads over digital ads.
- 62% of consumers visit a website after seeing a print ad.
- 77% of consumers sort through their mail as soon as it’s delivered.
- 70% of households with incomes above $100,000 read newspapers.
- The response rate for direct mail is 5.1%, compared to just 0.6% for email marketing.
- 67% of consumers have purchased online after seeing a product in a print catalog.
- 80% of consumers say they are likelier to do business with a company that offers personalized print materials.
- Print marketing has a median ROI of 29%, compared to 23% for digital marketing.
- 55% of consumers look forward to receiving mail from their favorite brands.
- 61% of readers trust newspaper ads compared to 42% for online ads.
- Consumers are 75% more likely to remember a brand after seeing a print ad.
General Print Marketing Statistics
- The global market for print-on-demand services was valued at $7.24 billion in 2023 and is projected to expand to $65.37 billion by 2032, exhibiting a compound annual growth rate (CAGR) of 27.7% during the forecast period from 2024 to 2032. (Source)
- Despite economic difficulties, 60 new print magazines were introduced in the United States in 2020, suggesting a persistent demand for print media. (Source)
- Integrating print and digital advertisements into online campaigns can boost their effectiveness by 400%. (Source)
- Advertising expenditure in the United Kingdom’s Print Advertising market is projected to attain $1.30 billion by 2024. (Source)
- Consumers tend to retain print advertisements for an average of 17 days, suggesting their enduring impact on purchasing decisions. (Source)
- Personalized print advertisements designed for individual recipients have been observed to yield a 135% increase in response rates. (Source)
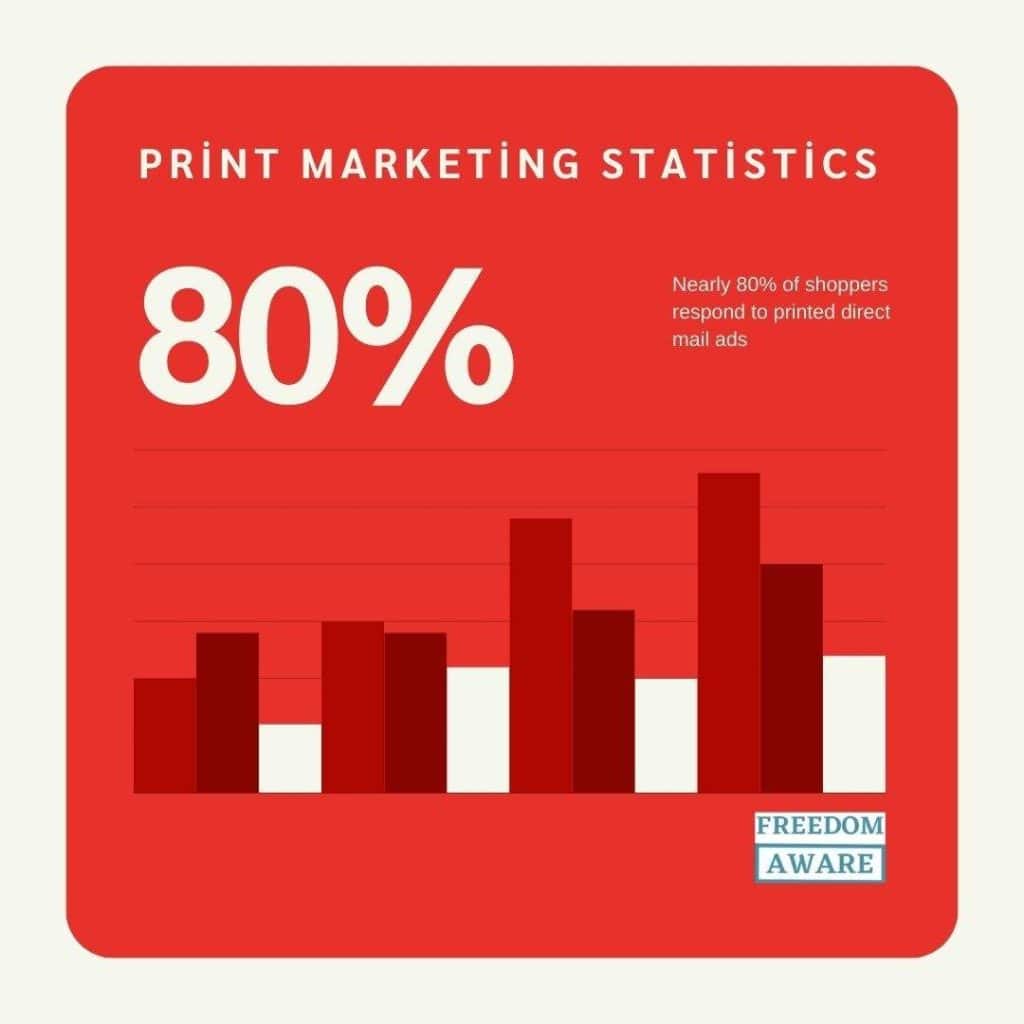
- Nearly 80% of shoppers respond to printed direct mail ads, while only 45% take action on electronic ads. (Source)
- Print advertisements motivate consumers 20% more effectively, particularly when they engage multiple senses. (Source)
- According to projections, global print advertising expenditure is anticipated to reach $34.28 billion by 2024. (Source)
- The United States is the largest spender on print advertisements, with an estimated expenditure of up to $9.6 billion in 2024. (Source)
- Recipients of print advertising have been shown to purchase 28% more items and spend 28% more than those who do not receive print advertisements. (Source)
- Advertising expenditure in Germany’s print advertising sector is projected to reach $2.97 billion by the year 2024. (Source)
- Placing advertisements in niche magazines or local newspapers enables businesses to target specific demographics and interests effectively. (Source)
- A significant 95% of individuals under the age of 25 are reported to read magazines. (Source)
- A significant 44% of customers are reported to visit a brand’s website after receiving direct mail or print marketing materials. (Source)
- A significant 70% of Americans express a preference for reading printed mail. (Source)
- A significant 84% of Millennials dedicate time to perusing their physical mail. (Source)
- A significant 70% of households with incomes exceeding $100,000 are reported to read newspapers. (Source)
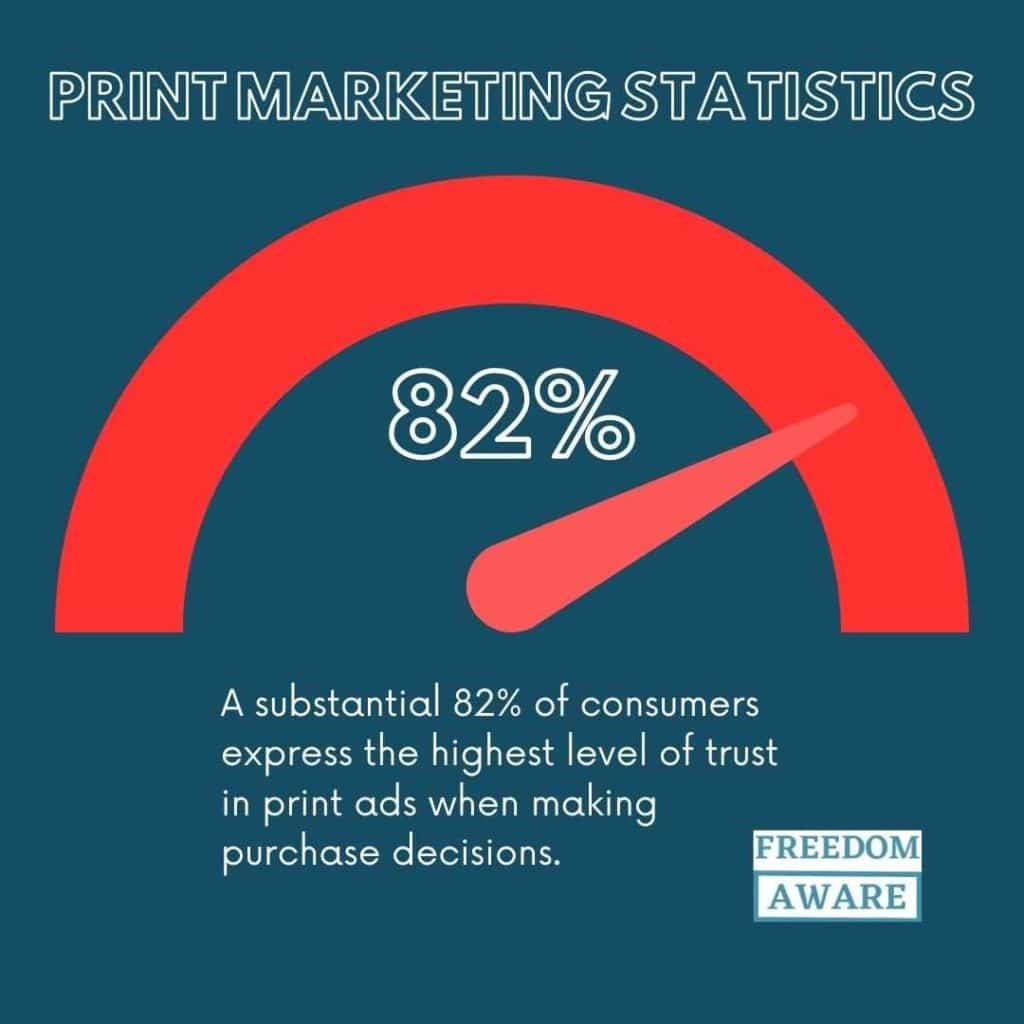
- A substantial 82% of consumers express the highest level of trust in print ads when making purchase decisions. (Source)
- A substantial 64% of recipients express a preference for scanning their mail for useful information rather than relying on email. (Source)
- A survey revealed that 75% of Millennials perceive receiving personal mail as something special. (Source)
- A survey of Americans revealed that 56% of respondents consider print marketing to be the most trustworthy form of marketing. (Source)
- A study conducted by the American Press Institute revealed that 74% of individuals aged 16 to 40 obtain news from traditional sources, including print newspapers, weekly. (Source)
- Print readers typically dedicate 20 minutes or more to their publication, engaging with a greater amount of content. (Source)
- Close attention to print ads has experienced a more than twofold increase, rising from 23% in 2009-10 to 49% in 2020. (Source)
- Projections indicate that the global print advertising audience will expand to approximately 3.1 billion readers by the year 2029. (Source)
- Print marketing materials are known to have a more potent emotional impact on consumers. (Source)
- The combination of print ads and email marketing results in a 49% increase in sales and a 125% rise in inquiries. (Source)
- The UK Print Advertising market is projected to reach 24.2 million readers by the year 2029. (Source)
- The average advertising expenditure per reader in the UK Newspaper Advertising market is estimated to be approximately $62 in 2024. (Source)
- Consumers who receive print mail promoting online sites have been observed to spend 13% more than those who solely receive digital information. (Source)
- Research conducted by Fundera indicates that 70% of consumers perceive direct mail as more personal than online interactions. (Source)
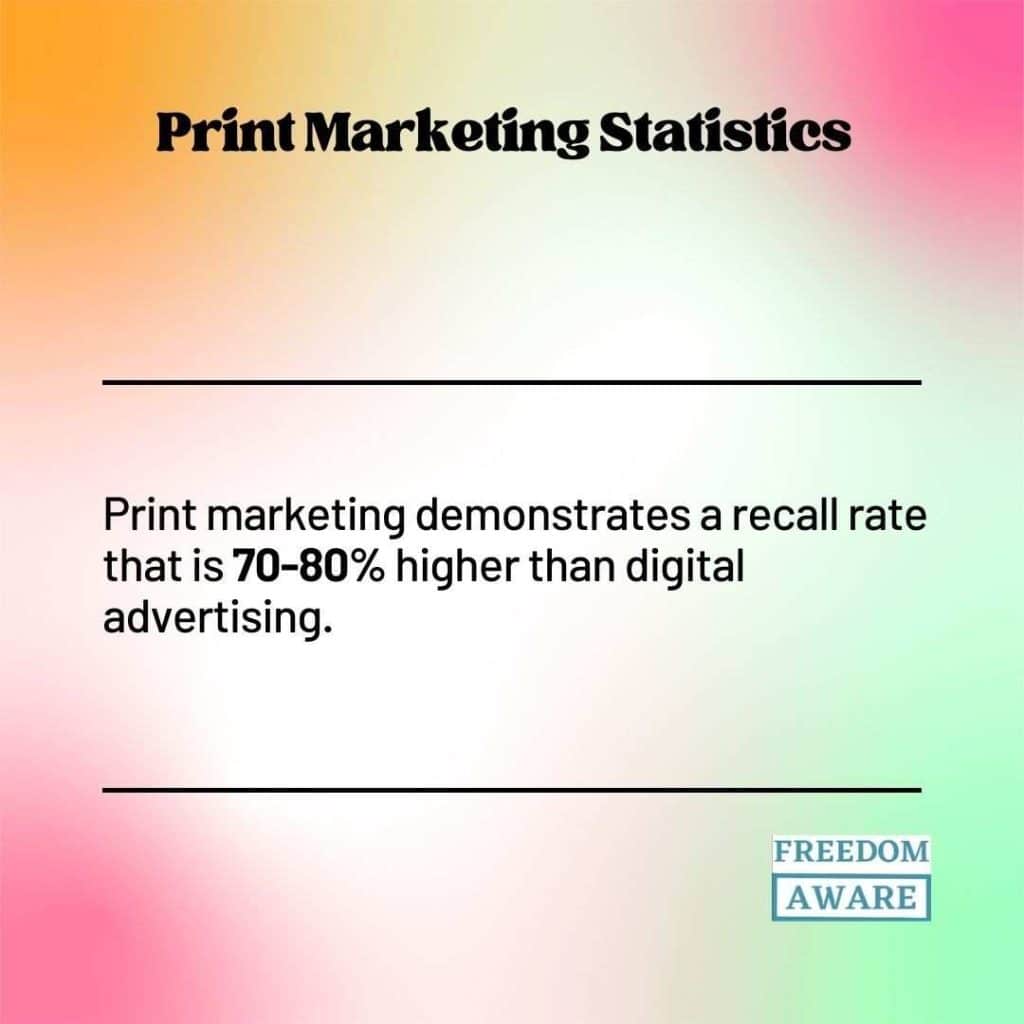
- Print marketing demonstrates a recall rate that is 70-80% higher than digital advertising. (Source)
- The Print Advertising market in China is anticipated to reach $1.96 billion in advertising spending by the year 2024. (Source)
- The number of readers in China’s Print Advertising market is expected to attain 600 million by 2029. (Source)
- The Print Advertising market in China is undergoing a shift towards digital integration, emphasizing interactive and data-driven campaigns. (Source)
Direct Mail in Print Marketing Statistics
- Direct mail significantly speeds up the purchasing process. While typical purchase decisions take over a week and more than a third take a month, direct mail can drive purchase decisions in just over a day for 73% of consumers. (Source)
- Newsletters and postcards are US marketers’ most popular direct mail formats, followed by self-mailers, catalogs, and packages. (Source)
- Combining digital and direct mail marketing strategies can boost response rates by 63%, website visits by 68%, and lead generation by 53%. (Source)
- Direct mail consistently delivers the highest return on investment (ROI) compared to other marketing channels, with a 112% ROI. SMS, email, paid search, social media advertising, and digital display advertising have ROIs ranging from 79% to 102%. (Source)
- Jumbo-sized envelopes reign supreme in direct mail response rates, outpacing postcards (5.7%) and standard letter envelopes (4.3%). (Source)
- Direct mail campaigns outperform other marketing methods, delivering 27% higher top-tier sales and 40% higher top-level customer acquisition. (Source)
- Many people across generations miss physical mail: 57% of boomers, 45% of Gen X, 41% of millennials, and 37% of Gen Z. (Source)
- Direct mail crushes digital channels in terms of response rates, outperforming them by a whopping 600% (based on the 2018 DMA Response Rate Report). (Source)
- Direct mail is a powerful motivator, with 62% of consumers taking action and 64% citing offers or promotions as the driving force. (Source)
- A majority of consumers (70%) favor traditional mail for unsolicited marketing offers. (Source)
- The average direct mail spending per person in the United States was between $100 and $550 in 2022, according to a Winterbury Group report. (Source)
- For every $167 invested in direct mail in the US, businesses can expect to generate $2,095 in sales, resulting in a 1,255% return on investment. (Source)
- Direct mail advertising introduces 39% of customers to new businesses. (Source)
- U.S. homes get bombarded with an average of 454 marketing mail pieces annually. (Source)
- Almost half of people save direct mail for later use. (Source)
Newspaper, Print Marketing Statistics
- The newspaper advertising market is the dominant sector within the global print advertising market, expected to reach a market volume of $23.57 billion by 2024. (Source)
- The average estimated expenditure on newspaper advertisements per reader in 2024 is approximately $18.95. (Source)
- Nearly 80% of newspaper readers have taken action in response to an advertisement they saw in the newspaper within the past month. (Source)
- A significant 82% of consumers use the print coupons they receive through newspapers. (Source)
- Consumers view newspapers as the most effective medium for promoting sales. (Source)
- A large majority of newspaper readers (91%) report taking some kind of action after seeing inserts in newspapers. (Source)
- Newspaper advertising is the largest segment within the Chinese print marketing market, with a market volume of $1.59 billion in 2024. (Source)
- The average ad spending per reader in China’s newspaper advertising sector is projected to be approximately $6.64 in 2024. (Source)
- In 2018, the estimated daily print and digital newspaper circulation in the United States was 28.6 million on weekdays and 30.8 million on Sundays, with the average reader spending about 12 minutes per day reading the newspaper. (Source)
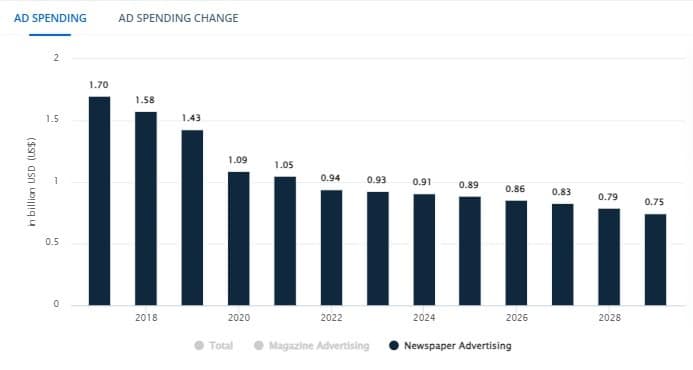
- Newspaper advertising is the dominant segment within the UK print advertising market, accounting for $0.91 billion in 2024. (Source)
- In 2022, the leading advertising media in the UK were the internet, television, radio, and newspapers, with estimated expenditures of $14.2 billion, $3.3 billion, $1.1 billion, and $950 million, respectively. (Source)
- The global newspaper advertising market is projected to shrink by 5.24% between 2024 and 2029, with an estimated market value of $25.48 billion in 2029. (Source)
Digital vs Print Marketing Statistics
- Physical print ads require 21% less cognitive effort to read and retain compared to digital ads. (Source)
- Accenture reported a 20% decline in global offline commerce revenue by 2021, with the U.S. B2B Commerce market reaching $1.2 trillion. (Source)
- Print and direct mail marketing has a 9% customer response rate, significantly higher than the 1% or less response rate for other digital channels. (Source)
- In 2019, Instagram had a slightly larger user base than print readers, with 113.3 million users compared to 112.7 million print readers. (Source)
- Over 90% of consumers find print ads easier to read than digital ones. (Source)
- As of 2019, while 33% of Millennials use ad blockers, 62% of people prefer to read paper ads instead of discarding them. (Source)
- Individuals are 70% more likely to recall businesses from print ads compared to online ads. (Source)
- Paid search ads can enhance brand awareness by 80%. (Source)
- By 2020, 50% of the advertising budget was projected to be allocated to online advertising, equaling traditional market spending globally. (Source)
- Video ads exhibit a 73% higher click rate than display banners. (Source)
- According to BannerSnack, 54% of users avoid clicking on ads due to distrust, and 33% find display ads unacceptable. (source)
- A significant 61% of readers trust newspaper ads, compared to 42% who trust online ads. (Source)
- A significant 70% of internet users express a preference for obtaining product information through content rather than traditional ads. (Source)
- A significant 88% of magazine readers in the UK express a preference for the print format. (Source)
- A significant 47% of customers utilize ad-blocking technology online. (Source)
- A significant 91% of consumers acknowledge that print and paper are sustainable when responsibly produced, used, and recycled. (Source)
- Approximately 45% of global shoppers engage in online shopping with in-store pickup. (Source)
- Print media is favored for face-to-face interactions, such as trade shows. (Source)

- Up to 90% of Direct Mail is opened, compared to only 20-30% of emails. (Source)
Challenges (Print Marketing Statistics)
The global print advertising sector is transitioning towards digital platforms, impacting traditional print media revenues and approaches.
- Advertising revenue in the printed marketing industry is projected to decline to $40 million in 2023 and $35 million in 2025. Newspaper ad revenue will decrease from $30 million to $24 million, and magazine marketing expenditure will drop from $13 million to $10 million by 2025. (Source)
- Magazine ad revenues are also expected to decrease, falling from $20.6 billion in 2012 to $12.1 billion this year, and further to $6.6 billion by 2024. (Source)
- Traditional advertising spending across formats such as newspapers, television, and outdoor advertising is projected to decline globally by 20.7%. (Source)
- Marketers identify high costs (51%), limited reach (32%), distribution logistics (31%), difficulty targeting audience segments (31%), and difficulty measuring ROI (28%) as significant challenges associated with print materials. (Source)
- GroupM forecasts a 50% decline in newspaper ad revenue within five years, dropping from over $25 billion in 2012 to $5.5 billion. (Source)
- Daily newspaper readership has fallen from approximately 63.3 million in 1984 to under 28.5 million in 2018. Sunday circulation peaked at 62.6 million in 1993 and dropped to 30.8 million in 2018. (Source)
Conclusion (Print Marketing Statistics)
Print marketing continues to hold its ground, statistics show that print remains a powerful tool, capable of creating deeper connections with consumers and driving concrete results.
Digital marketing might be on the rise, but print marketing still holds its ground. Savvy marketers combine the best of both worlds to create a more impactful reach.


Leave a Reply