In-store vs online shopping statistics you should know;
With a few clicks, online shoppers can efficiently browse and buy, compare prices, and read reviews, all from the convenience of their homes. Yet, traditional in-store shopping offers unique value, providing a more experiential and involved shopping process.
As the lines between online and offline shopping continue to blur, retailers are faced with the challenge of adapting to new trends and technologies. But what do the numbers say about the state of retail today?
This article delves into the latest in-store vs online shopping statistics, exploring the trends, preferences, and habits shaping the industry’s future.
Editor’s Pick: In-Store vs Online Shopping Statistics
- US consumers shelled out a combined $7.071 trillion in physical stores and $1.257 trillion online in 2023, amounting to a total retail spend of $8.328 trillion.
- Global Gen Z consumers are most likely to impulsively buy online because of enticing deals (43%), personal gratification and incentives (39%), the excitement of new finds, and the convenience of online payment (both at 37%).
- In 2023, a significant portion of US consumers leaned towards exclusive online shopping, exemplified by platforms like Amazon. However, a notable 34% of Americans expressed uncertainty about their preferred shopping channel.
- A striking 81.8% of the US population now prefers to buy groceries online rather than in-store purchases.
- 40% of consumers make at least one in-store shopping trip weekly, compared to 27% who shop online with the same frequency.
- In 2023, online shopping represented around 19% of the global retail market, a share expected to expand to nearly 25% by 2027.
- Online shopping is the most preferred shopping method for 67% of shoppers worldwide.
- By 2026, global retail e-commerce sales will amount to $8.1 trillion.
General In-Store vs Online Shopping Statistics
- According to a 2024 survey of 10,051 U.S. consumers, apparel and footwear emerged as the top online purchase categories, with 43% and 33% of respondents buying them respectively. (Source)
- Among all age groups, consumers aged 26-35 had the highest online fashion purchase rate at 82% in the past year. (Source)
- However, the trend wasn’t limited to younger demographics, with a surprising 73% of consumers aged 65 and older also shopping for clothes online. (Source)
- A 2022 U.S. survey revealed interesting consumer beliefs regarding returned online purchases. Nearly half (45%) believed these items were typically resold, while 36% were unsure, and 17% assumed they were discarded. (Source)
- As of December 2023, Shein.com emerged as the global leader in fast-fashion e-commerce, capturing over 2.6% of desktop traffic, followed closely by Nike at 1.93%. (Source)
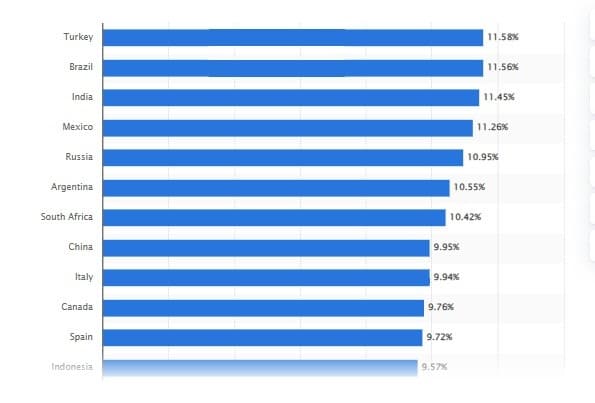
- Recent industry projections show Turkey leading the global e-commerce market with a remarkable 11.6% CAGR from 2024 to 2029. Currently valued at a substantial 3.4 trillion Turkish lira, Turkey’s e-commerce sector is poised for significant growth. India and Brazil also demonstrate impressive e-commerce growth trajectories, with CAGRs exceeding 11%. (Source)
- In December 2023, Amazon.de dominated the German online marketplace, capturing over half (53%) of desktop visits, followed by eBay.de at nearly 20%. (Source)
- Similarly, Amazon.com reigned supreme in the U.S. during the same period, accounting for 58% of desktop traffic in the marketplace category, with eBay.com trailing behind at 11.86%. (Source)
- Reflecting the surge in online shopping, returns on U.S. online purchases reached nearly $248 billion in 2023, marking a significant 16.4% increase from the previous year’s total of approximately $213 billion. (Source)
- After accounting for seasonal fluctuations, U.S. retail and food services sales reached $703.1 billion in May 2024. This represented a marginal 0.1% increase from April and a more substantial 2.3% growth compared to the same period in 2023. (Source)
- DoorDash outpaced competitors like Uber Eats to become the most downloaded online food delivery app in the U.S. during 2023, amassing over 21 million downloads. (Source)
- Retail trade sales experienced a modest 0.2% increase in April 2024 compared to the previous month. However, non-store retailers defied this trend with a robust 6.8% growth year-over-year. (Source)
- Between March and May 2024, total retail trade sales climbed by 2.9% year-over-year. (Source)
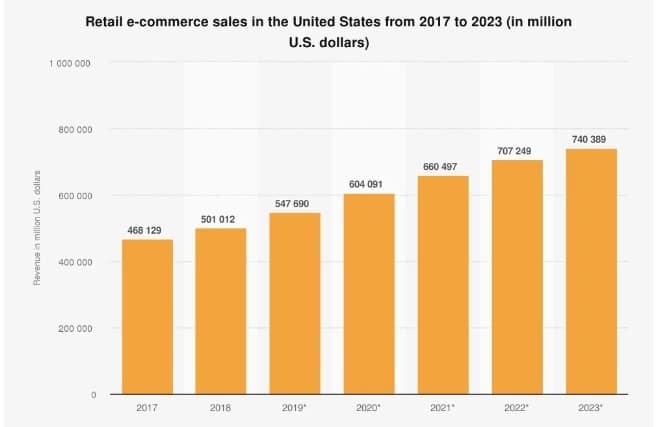
- In the United States alone, e-commerce sales are expected to surpass $740 billion by 2023. (Source)
- While there was a slight 0.2% dip from March to April, overall sales demonstrated positive growth. (Source)
- Amazon solidified its position as the undisputed leader of the U.S. online retail market in 2023, capturing a substantial 37.6% share. (Source)
- Walmart’s e-commerce platform held a distant second with 6.4%, followed by Apple at 3.6%. (Source)
- Shopper satisfaction with in-store experiences rebounded to 59% in March 2024, a significant improvement from its lowest point in January 2023. (Source)
- Consumers place greater trust in traditional brick-and-mortar stores compared to online-only retailers. (Source)
- Online shopping accounted for nearly one-fifth of global retail sales in 2023, and this figure is projected to climb to almost a quarter by 2027. (Source)
- In early 2024, a fifth of middle-income consumers prioritized online shopping for groceries and household goods, driven by convenience and perceived product quality. While in-store shopping remained popular, especially among older demographics, online shopping maintained a steady presence. (Source)
- While the pace of online shopper growth is expected to decelerate in the coming years, with annual increases gradually declining from 5.4% in 2025 to 2.9% in 2029, the overall trend remains upward. (Source)
- Online beauty shopping is gaining traction, particularly among men, with nearly one-third preferring this channel. (Source)
- Clothing emerged as the top online purchase in the U.S. in 2023, followed by footwear, food and beverages, accessories, and beauty products. (Source)
- The number of U.S. online shoppers is anticipated to surge by over 60% between 2020 and 2029, with an average annual growth rate of 5.4%. (Source)
- The U.S. witnessed a remarkable 8.1% increase in online shoppers in 2024, reaching approximately 270.11 million. This represents the fastest growth in at least four years. (Source)
- In 2023, U.S. consumers spent a staggering $7.071 trillion in physical stores, significantly outpacing the $1.257 trillion allocated to online shopping, for a combined retail expenditure of $8.328 trillion. (Source)
- The United States led the world in online shopping preference in early 2023, with 43% of consumers favoring digital over physical stores. This contrasted with countries like Austria, Finland, and New Zealand, where in-store shopping remained dominant. (Source)
- A strong preference for online research before making significant purchases was evident among U.S. consumers in a 2024 survey, with 45% confirming this habit. (Source)
- U.S. consumers expressed satisfaction with online retail experiences, as indicated by an 80 out of 100 score on the American Customer Satisfaction Index in 2023. (Source)
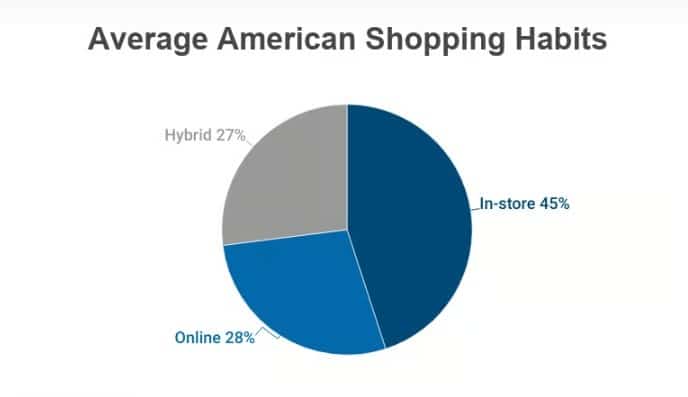
- 28% of consumers regularly shop online. (Source)
- Clothing emerged as the clear winner in a 2022 survey of U.S. consumers when asked about preferred shopping channels, with 36% opting for online purchases. (Source)
- According to the India Brand Equity Foundation, the Indian e-commerce landscape is set to expand exponentially, with a projected value of USD 16-20 billion in 2025 and a massive USD 350 billion by 2030. (Source)
The Appeal of Online Retail (In-Store vs Online Shopping Statistics)
- Online retailers provide a significantly wider selection of products than traditional showrooms or malls. (Source)
- The number of online shoppers is on a trajectory of substantial growth, projected to surpass 300 million by 2027 and continue climbing to reach 331.46 million by 2029. (Source)
- A significant portion of online shoppers, 39.5%, are attracted by deals and discounts, while 25.7% value the opportunity to earn loyalty points. (Source)
- Consumers are drawn to online shopping due to factors like rapid delivery and convenient checkout. Over 30% of shoppers highlight next-day delivery, while another 30% emphasize the ease of completing purchases. (Source)
- Consumer trust in online retailers is enhanced by payment flexibility and return policies. Cash-on-delivery is a top reason for shopping online for almost 18% of consumers, while easy returns motivate over 31%. (Source)
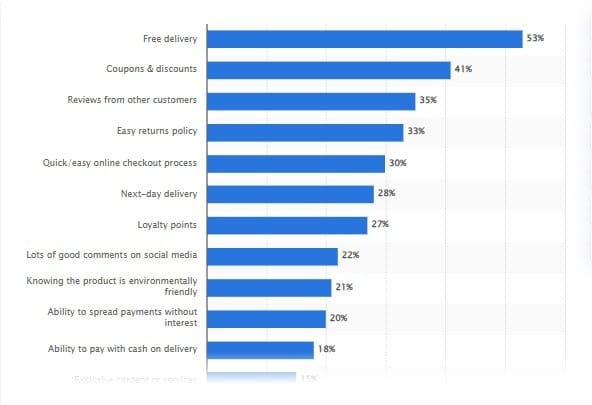
- Free delivery proved to be a powerful catalyst for online sales in 2020, with over 50% of global consumers stating it encouraged them to complete purchases. (Source)
- Online shoppers rely heavily on peer feedback. Customer reviews drive 32.6% of purchases, and social media sentiment influences 22.4%. (Source)
- Online shopping has become a daily routine for many. A fifth of consumers make at least one online purchase every day, with a significant portion making multiple purchases daily. (Source)
- Online shopping frequency varies widely among U.S. consumers. While 21% shop monthly or less, 12% are weekly shoppers, and nearly half make multiple purchases each week. (Source)
- Ease and speed are key factors in online shopping. Over a third of U.S. shoppers prioritize convenience, while fast and affordable shipping options are also highly valued. (Source)
- 63% of consumers will buy from you online if they’ve had a positive in-store experience. (Source)
- 18% of people like shopping online because it’s available 24/7. (Source)
Cross-Generational Comparison of Consumer Spending (In-Store vs Online Shopping Statistics)
- Younger generations are more inclined to shop internationally, with Gen Z leading the way. Sixty percent of Gen Zers have made cross-border purchases, compared to 57% of Millennials, 37% of Gen X, and 20% of Boomers. (Source)
- Nearly eight in ten Gen Z consumers globally prioritize online shopping for its convenience, including easy price comparisons, time savings, wider product range, flexible payment options, and detailed product information. (Source)
- Over a third of teenagers, aged 13 to 17, equally favor both online and in-store shopping. (Source)
- Amazon is the clear favorite among U.S. teenagers, with 56% identifying it as their top online shopping destination. Shein follows at a distant second with approximately 7% preference. (Source)
- Gen Z maintains a skeptical stance towards exclusively online brands while still actively participating in e-commerce. (Source)
- In the first quarter of 2023, France and Poland had the highest percentage of Gen Z consumers (82%) buying pre-owned items online, while Norway (83%) and Spain (79%) led in selling second-hand items. (Source)
- A clear majority (44%) of Gen Z consumers begin their shopping explorations online, with search engines (40%) and physical stores (35%) following as preferred starting points, highlighting a strong digital-first mindset. (Source)
- Gen Z adults are prolific shoppers with a penchant for discretionary spending. They frequently make multiple purchases across various categories each month (Source)
- Two-thirds of millennials favor online shopping over traditional brick-and-mortar stores. (Source)
- 60% of millennials’ purchases are made online. (Source)
- 56% of Gen X shoppers prefer to shop online versus in a brick-and-mortar. (Source)
Conclusion: In-Store vs Online Shopping Statistics
These statistics demonstrate the migration of consumer behavior from brick-and-mortar stores towards the ease and reach of online platforms. Nevertheless, it’s crucial to acknowledge the enduring significance of both shopping models for consumers. The future of retail will likely witness a harmonious coexistence of these channels. By recognizing these evolving trends and proactively adapting, businesses can effectively navigate this dynamic landscape and achieve sustained success
FAQ (In-Store vs Online Shopping Statistics)
Are people more likely to buy in-store or online?
Online shopping offers unparalleled convenience, enabling customers to effortlessly explore a vast array of products, compare prices, and enjoy immediate possession of their purchases.
Is it better to buy in-store or online?
The best place to shop ultimately depends on the product, your personal preferences, and your priorities.
Ultimately, a combination of both shopping methods often works best. For example, you might research products online and then visit a store to try them on before purchasing.
What is the difference between eCommerce and in-store?
eCommerce offers convenience and a broader reach, while in-store shopping provides a tangible product experience and immediate gratification.
Which country buys online the most?
China Leads the Pack in Online Shopping
China is undoubtedly the world’s largest online shopping market. Its massive population, rapid technological advancements, and thriving e-commerce ecosystem have propelled it to the top.

Leave a Reply