
Here are the best and most surprising Data-Driven Decision Making Statistics You Should Know in 2025 and beyond;
In today’s fast-paced business landscape, making informed decisions is crucial for success. Gone are the days of relying on gut instincts and anecdotal evidence. Instead, companies are turning to data-driven decision-making to drive growth, improve efficiency, and stay ahead of the competition.
What Is Data-Driven Decision Making? (Data-Driven Decision Making Statistics)
Data-driven decision-making is the process of using data analysis and insights to inform strategic choices. It’s about moving beyond assumptions and personal biases to make decisions based on evidence, patterns, and trends.
But just how widespread is the adoption of data-driven decision-making? And what are the benefits of using data to inform business strategy? Let’s dive into the numbers and explore data-driven decision-making statistics that will revolutionize your business strategy.
Key Data Points on Data Driven Decision Making (Data Driven Decision Making Statistics)
- Data is becoming essential: Over 90% of enterprises recognize data’s growing importance, with nearly half making most decisions based on data.
- Data drives financial gains: Organizations leveraging big data analytics report an average 8% revenue boost and 10% cost reduction.
- A data-driven culture is prevalent: Three-quarters of leaders in data-forward companies rely exclusively on data for decision-making.
- Challenges persist: While data is crucial, only about half of data professionals have high confidence in its quality. Improving data integrity is a top priority.
- The future is data-centric: The overwhelming majority of organizations anticipate an even greater reliance on data for decision-making in the coming year.
- Data’s impact on sales: Data-driven strategies will surpass gut instinct in over two-thirds of B2B sales organizations within the next few years.
Statistics on Data-Driven Decision Making Adoption (Data Driven Decision Making Statistics)
- Companies typically rely on an average of five internal data sources for decision-making. (Source)
- Data-driven strategies will outperform gut feelings in 65% of B2B sales organizations by 2026. (Source)
- Over 40% of companies are using big data analytics, but there’s still significant room for growth. (Source)
- A vast majority about 90% of enterprises recognize data as a critical business driver. (Source)
- A quarter of organizations primarily base strategic decisions on data, while nearly half rely on it heavily. (Source)
- The vast majority of companies recognize the strategic importance of data and analytics. (Source)
- Many companies are starting to view information as a valuable asset, with even more planning to do so in the future. (Source)
- 83% of CEOs want their organizations to be more data-driven. (Source)
- 87% of CXOs said being an intelligent enterprise is their top priority. (Source)
- 33% are comfortable questioning KPIs and metrics used in organizations. (Source)
- 29% are asked to communicate using data-driven methods. (Source)
- 30% say actions are driven by data analysis. (Source)
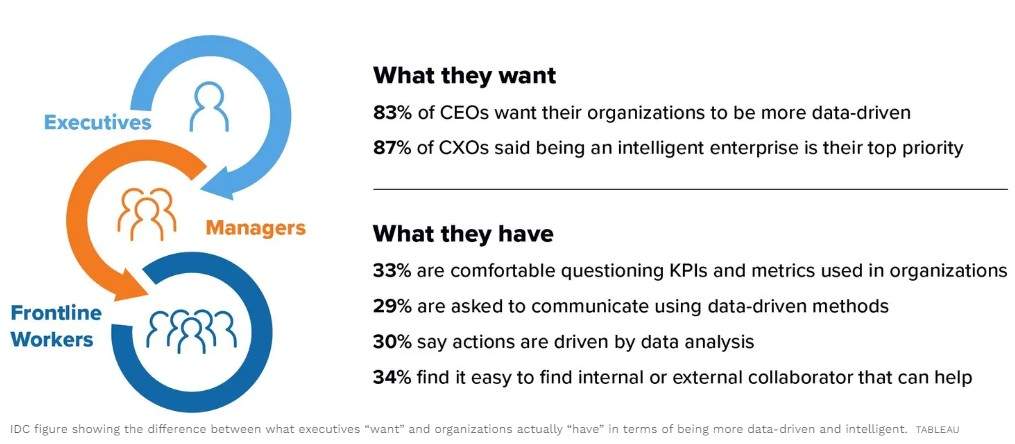
- 34% find it easy to find internal or external collaborators that can help. (Source)
- While global adoption of data-driven decision-making surged by 12% between 2018 and 2020, only half of organizations reported making decisions primarily based on data. (Source)
- Fewer than one-third of enterprises currently use data to identify new opportunities, but most intend to leverage it for this purpose. (Source)
- A top-down approach is the most common decision-making style, with collaborative methods lagging. (Source)
- According to a survey, executives in leading data-driven companies rely exclusively on data to guide their decision-making. ( Source)
- In 2021, roughly two-thirds of European and U.S. data and analytics leaders reported having a corporate initiative to become more data-driven. Only 3% lacked such an initiative and planned to remain so. (Source)
- A majority of C-suite executives acknowledge that their companies rely minimally on data to guide decision-making. (Source)
- A large majority of leading marketers indicate that data informs decision-making at every level of their organizations. (Source)
- Almost 40% of business leaders say their company makes decisions heavily relying on data, highlighting a strong trend toward data-driven practices. (Source)
- Data privacy has emerged as a paramount concern in light of regulations like GDPR and CCPA. (Source)
- Global marketing leaders primarily leverage data-driven strategies for email marketing (47%) and customer journey mapping (46%). (Source)
- In 2020, the respondents surveyed demonstrated a 12 percent increase in implementing data-driven decision-making within their global organizations when compared to 2018. (Source)
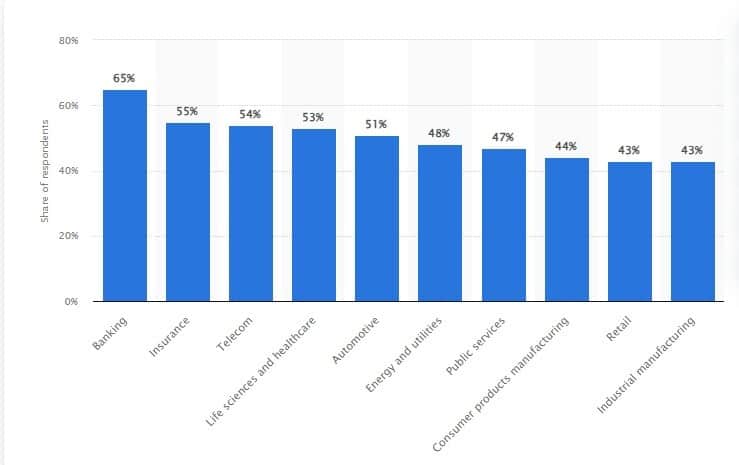
- In 2020, a leading 65% of organizations in the banking sector utilized data-driven decision-making. (Source)
Data Driven Decision Making Statistics: Impact and Profitability
- A recent study revealed that 85% of Singaporean business leaders experience decision distress, but they hold a strong belief that data can enhance decision-making, reduce risk, and increase preparedness for unforeseen circumstances. (Source)
- Data-driven decision-making, prioritized by 77% of data and analytics professionals, delivers tangible benefits: operational efficiency (73%), cost reduction (62%), revenue generation (59%), and regulatory compliance (57%). (Source)
- A significant gap exists between the potential of data and analytics and its actual integration into corporate strategy. Less than 50% of documented strategies highlight it as essential for delivering value. (Source)
- Organizations leveraging big data analysis see significant gains: 8% revenue growth and 10% cost reduction. Top benefits include improved strategic decision-making (69%), optimized operational processes (54%), deeper customer insights (52%), and cost reduction (47%). (Source)
- Best-in-class companies rely less on gut feelings (40%) than laggards (70%) for decision-making. (Source)
- 68% of companies that grew revenue within a year used market research to drive their success. (Source)
- pen data access is strongly linked to higher performance, as leading marketers are 1.6 times more likely to believe in this connection. (Source)
- Data-driven organizations significantly outperform others, boasting 23 times higher customer acquisition, six times greater customer retention, and 19 times higher profitability. (Source)
- Businesses using big data saw an 8-10% profit increase and a 10% cost reduction. (Source)
- Implementing data programs not only yields positive results (44%) but also fuels further demand for data (46%), suggesting that high-quality data drives business success. (Source)
Common Hurdles in Data Driven Decision Making (Data Driven Decision Making Statistics)
- Data quality (36%), integration (60%), and integrity (50%) remain major challenges, hindering trust in data for decision-making. Only 46% of data professionals have high confidence in its use, highlighting the need for improvement. (Source)
- It’s not all sunshine and rainbows in the data-driven world. For every 10 organizations successfully using data, 23 are still trying to figure it out. (Source)
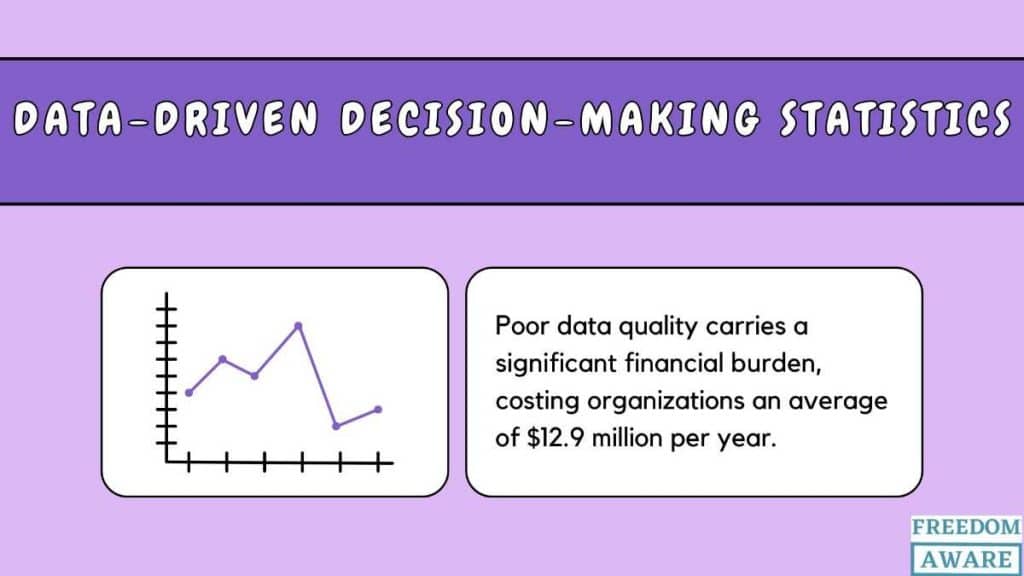
- Poor data quality carries a significant financial burden, costing organizations an average of $12.9 million per year. (Source)
- Half of all businesses lack clarity on their data and AI needs, hindered by data complexity. (Source)
- Despite the abundance of data, organizations are only utilizing 50%, missing out on a significant opportunity to make more informed decisions. (Source)
- Senior executives overwhelmingly agree that eliminating organizational silos is critical for leveraging data and analytics to make better decisions. (Source)
- According to Qlik research, 45% of C-suite executives make decisions based on gut feeling, and 42% doubt data accuracy. (Source)
- 92% of business leaders asserted that the increasing number of data sources has limited their organizations’ progress. Also, 73% of business leaders agree that their distrust of data has prevented them from making decisions. (Source)
- Gut instinct drives most decisions in 58% of companies, according to a survey. (Source)
- While data-driven organizations experience a threefold improvement in decision-making, a significant portion (62%) of executives still prioritize experience and advice over data. (Source)
- Targeting segmented audiences (50%) and ensuring real-time decision-making and data quality (33%) are major hurdles for marketers seeking to embrace data-driven practices. (Source)
Technology and Tools Usage Statistics (Data Driven Decision Making Statistics)
- Organizations excelling in performance are significantly more likely to leverage advanced technology for risk analysis, stakeholder identification, and change management compared to their underperforming counterparts. (Source)
- Businesses using predictive data analytics reported an average revenue increase of 15%. (Source)
- Effective use of predictive analytics can boost operating margins by as much as 60%. (Source)
- The predictive analytics market is set to skyrocket from $11.5 billion in 2023 to $61.9 billion by 2032, with a robust annual growth rate of 21.2% from 2024 to 2033. (Source)
- The global decision intelligence market is booming, surging from $10.64 billion in 2022 to a projected $36.06 billion by 2030, driven by a 16.5% annual growth rate. (Source)
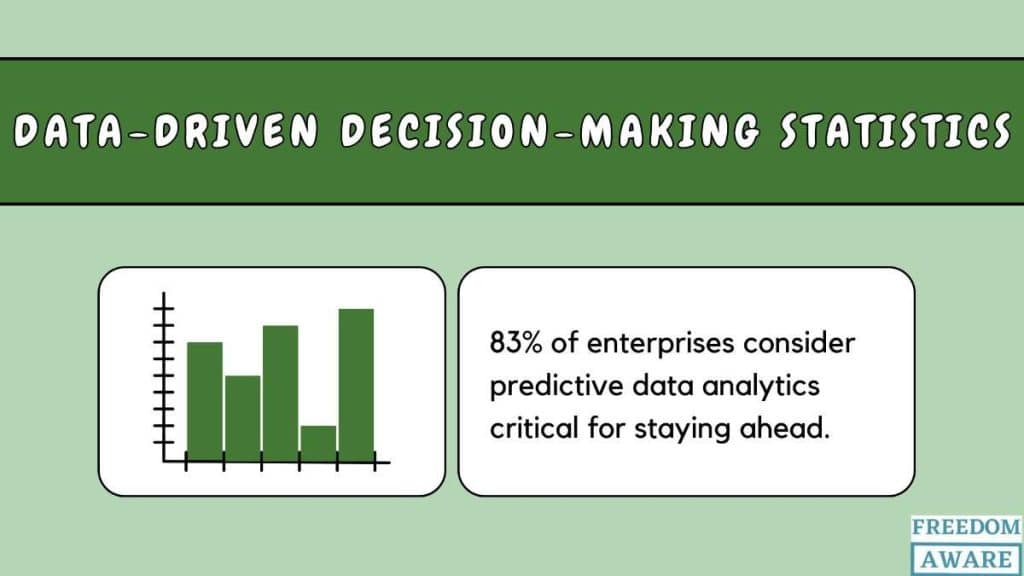
- 83% of enterprises consider predictive data analytics critical for staying ahead. (Source)
Data Driven Decision Making Statistics
- Asia Pacific was expected to spend US$42.2 billion ($57 billion) on big data and analytics. (Source)
- The decision dilemma is creating havoc in the business world, with 87% of business leaders suffering decision distress. (Source)
- Italian managers highlight speedier decisions, better operations, and product innovation as key benefits of data-driven approaches, with data monetization less emphasized (14%). (Source)
- In 2020, a leading 77% of U.S. organizations utilized data-driven decision-making. (Source)
- Data overload is crippling Singaporean business leaders, causing decision paralysis (63%), mistrust (87%), and a desire for automated decisions (76%). (Source)
- Less than 50% of companies agree that information is highly valued for decision-making or treated as an asset in their organization today, but two-thirds believe it will be in the future. (Source)
- Finance leads data management and governance (60%), with IT playing a supporting role (41%), but sole IT responsibility is rare (10%). (Source)
- Leading marketers are significantly more likely (72%) to invest in enhancing first-party data quality and quantity compared to their peers. (Source)
- Data quality is a major issue for 70% of data professionals struggling with data trust, with 53% seeing it as crucial for data integrity. (Source)
- Data-leading organizations boast a 70% higher rate of easy data access compared to data-aware ones. (Source)
- More healthcare data is being collected in Africa than anywhere else in the world. (Source)
- A vast majority of CEOs (83%) aim to transform their organizations into data-driven powerhouses. (Source)
Data Driven Decision Making Trends (Data Driven Decision Making Statistics)
Trend 1: The Rise of Artificial Intelligence (Data-Driven Decision Making Statistics)
Traditionally reliant on human intuition, decision-making often leads to subjective biases and inaccurate outcomes. AI is revolutionizing this process by providing objective analysis, real-time insights, and predictive capabilities. By identifying hidden patterns and continuously learning, AI empowers organizations to make data-driven choices that outperform traditional methods and drive operational efficiency.
Trend 2: Harnessing Advanced Analytics (Data Driven Decision Making Statistics)
Advanced analytics techniques are transforming how businesses operate by uncovering hidden risks, predicting market shifts, and optimizing processes. These insights enable organizations to deliver exceptional customer experiences and gain a competitive edge through proactive decision-making.
Trend 3: The Era of Hyper-Personalization (Data Driven Decision Making Statistics)
The one-size-fits-all approach is obsolete. By leveraging customer data, businesses can create highly personalized experiences, recommendations, and services. This level of customization fosters stronger customer relationships and drives business growth.
Trend 4: Cloud-Powered Transformation (Data Driven Decision Making Statistics)
The shift to cloud-based data management is accelerating. Cloud platforms offer unparalleled scalability, flexibility, and cost-efficiency. Coupled with advanced analytics and machine learning tools, the cloud empowers organizations to extract maximum value from their data. This leads to faster insights, improved collaboration, and the ability to handle massive datasets.
Conclusion: (Data Driven Decision Making Statistics)
In today’s competitive environment, data-driven decision-making is no longer a luxury, it’s a necessity for business survival and growth. By embracing a data-driven approach, companies can:
- Minimize risk and make informed choices.
- Increase efficiency and optimize operations.
- Enhance customer satisfaction and loyalty.
- Gain a competitive edge and drive sustainable growth.
FAQ (Data Driven Decision Making Statistics)
Why does decision-making require data? (Data Driven Decision Making Statistics)
Data-driven decision-making unlocks valuable insights into customer behavior, preferences, and needs. By analyzing customer data, businesses can precisely segment their customer base, tailor offerings to individual preferences, elevate customer experiences, and create highly targeted marketing campaigns.
What are some examples of data driven decision making? (Data Driven Decision Making Statistics)
Uber leverages data, algorithms, and predictive models to optimize driver allocation by accurately estimating travel times. Conversely, Starbucks utilizes data analytics to understand customer preferences and purchasing behavior.
How effective is data driven decision making? (Data Driven Decision Making Statistics)
Data-driven decision-making is a catalyst for operational efficiency. By uncovering bottlenecks, redundant processes, and areas for improvement, organizations can optimize resource utilization and streamline workflows, leading to substantial performance gains.
What is data driven decision making theory? (Data Driven Decision Making Statistics)
Data-driven decision-making is a strategic approach that leverages facts, metrics, and data analysis to inform business choices that directly contribute to the achievement of organizational goals and initiatives.
Leave a Reply