GoHighLevel Magic Links to the Rescue: Lost Your Login?
Navigating membership sites can be frustrating when you need to remember your login details. GoHighLevel has simplified this process with its innovative Magic Links feature.
In this article, we’ll explore what Magic Links are, their benefits, how to use them, and more.
Are you still waiting to be a GoHighLevel user? Check out our in-depth review or explore pricing and alternative options.
Ready to take your lead generation to the next level? Explore GoHighLevel‘s magic links and discover a wealth of resources to fuel your marketing success!
GoHighLevel Magic Links: A Password-Free Login Solution
Magic Links offers a convenient way to access your GoHighLevel membership sites without the hassle of remembering passwords. Simply click on a unique link, and you’re in!
Important Note: When using Magic Links as an agency admin, keep in mind that you’ll see all courses accessible to that sub-account.
Troubleshooting Magic Links: Common Issues and Solutions (GoHighLevel Magic Links)
Encountering Magic Link problems? Here’s a guide to common errors and how to fix them:
Do Magic Links expire?
Do contacts need access to an offer?
Why do I see all courses during testing?
Magic Links: A Game-Changer for Membership Sites (GoHighLevel Magic Links)
GoHighLevel Magic Links offers a game-changing solution for streamlining access to your membership site. By eliminating the need for login credentials, they simplify the login process, enhance security, and provide a more convenient experience for your users.
Ready to elevate your membership site? Implement Magic Links today!
Animation statistics: Animation is truly a marvel, isn’t it?
In today’s digital landscape, animation has become an essential tool for businesses, marketers, and creators.
From the simple hand-drawn cartoons of the past to the stunning computer-generated films and series of today.
With the rise of online video content, animation statistics have become increasingly important for understanding audience engagement, behavior, and preferences.
In this article, we’ll delve into the world of animation statistics, exploring the latest trends, insights, and data-driven findings that can help you unlock the power of visual storytelling.
Key Animation Statistics (Editor’s Pick)
South Africa leads Africa’s animation industry.
There are currently over 4,937 animators employed in the United States.
92% of internet users worldwide have watched online videos, making animation a crucial aspect of online content.
Videos are 50 times more likely to rank on the first page of Google compared to plain text content.
The average person watches 1.5 hours of video content per day, making animation a vital tool for capturing audience attention.
85% of businesses use video as a marketing tool, with animation being a key component of this strategy.
Animated videos increase conversion rates by 20%, making them an effective tool for driving sales and revenue.
The global animation market is projected to reach $270 billion by 2025, driven by increasing demand for animated content.
72% of customers prefer learning about a product or service through video, making animation a key tool for customer education.
Animated videos have a 95% retention rate, compared to 10% for text-based content.
The average animated video is 4.5 minutes long, with shorter videos performing better on social media platforms.
80% of marketers say video has increased dwell time on their website, with animation playing a key role in this engagement.
General Animation Statistics
The average age of animators is 40 years and older, with this age group representing 47% of the total population. (Source)
A bachelor’s degree is the most common educational attainment among animators, with 74% holding this degree. Associate degrees and Master’s degrees are held by 13% and 8% of animators, respectively. (Source)
There are currently over 4,937 animators working in the United States. (Source)
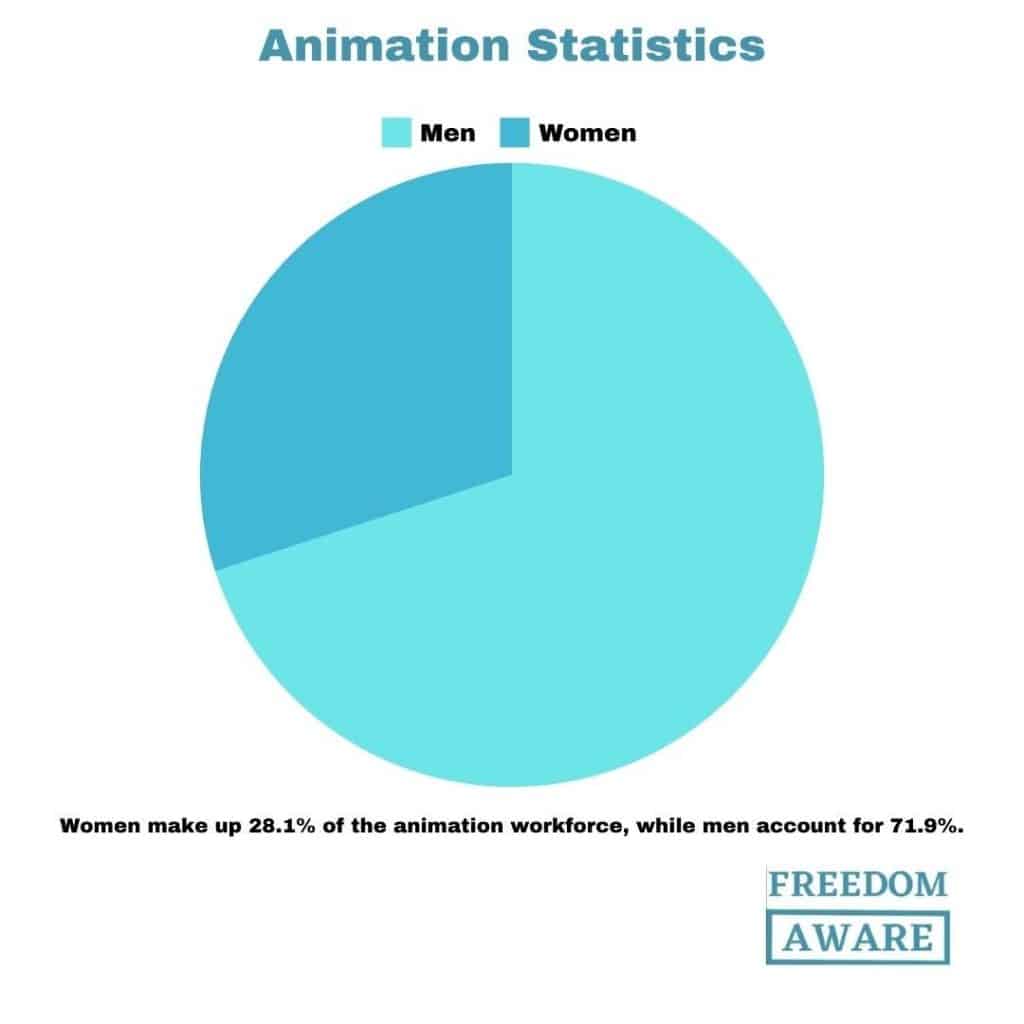
Women make up 28.1% of the animation workforce, while men account for 71.9%. (Source)
The majority of animators in the US identify as White (67.7%), followed by Hispanic/Latino (13.9%), Asian (7.5%), and a smaller percentage who chose not to disclose their ethnicity (5.8%). (Source)
Animators and special effects artists in the US earn an average annual salary of approximately $99,060, according to the U.S. Bureau of Labor Statistics. (Source)
Asian animators earn the highest average salary among all ethnicities, while Black or African American animators earn the lowest at $66,339 per year. (Source)
Animators with advanced degrees tend to earn higher salaries, with those holding a Master’s degree averaging $87,684 per year, followed by those with a Bachelor’s degree at $85,609, and those with an Associate degree at $73,425. (Source)
Most animators prefer working at private companies rather than public companies. (Source)
The media, technology, and education industries are the top employers of animators. (Source)
The global animation market is booming, with its value projected to increase from $395 billion in 2022 to $529 billion by 2030, at a steady growth rate of 5% per year. (Source)
The global animation and visual effects market is also on a strong growth trajectory, expected to expand from $180 billion in 2024 to $311 billion by 2029, with an impressive annual growth rate of 9.43%. (Source)
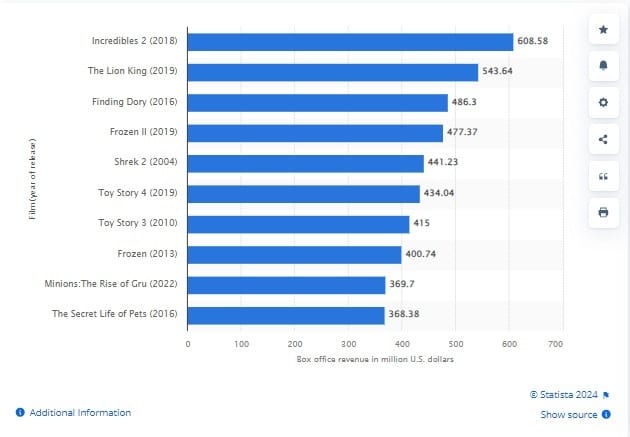
“Incredibles 2” continues to reign as the top-grossing animated film in North America, having raked in nearly $609 million in the US and Canada as of February 2024. (Source)
The production costs of movies vary significantly, with animation films typically falling in the range of $20 million to $50 million, while live-action films can cost anywhere from $40 million to over $100 million. (Source)
The animation market is thriving due to the rising popularity of computers and smartphones. Many businesses are leveraging animation to showcase their concepts and product models effectively. (Source)
“Frozen 2” remains the highest-grossing Disney animated film, having earned over $1.45 billion worldwide as of January 2024, followed by its predecessor “Frozen” with $1.28 billion. (Source)
Fully animated films, such as “The Super Mario Bros. Movie,” are among the top-grossing video game movies worldwide as of March 2024. (Source)
“The Super Mario Bros. Movie” continues to hold the title of the highest-grossing video game adaptation, having raked in $1.36 billion globally. It has surpassed “Warcraft” and “Pokémon: Detective Pikachu” in terms of box office revenue. (Source)
Only four animated film series have made it to the top 20 highest-grossing movie franchises worldwide as of June 2022, including “Despicable Me,” “Shrek,” “Ice Age,” and “Toy Story.” (Source)
The global motion graphics market is experiencing significant growth, with its value projected to increase from $71.68 billion in 2022 to $177.50 billion by 2030, driven by a CAGR of 12%. This indicates a rising demand for and adoption of motion graphics. (Source)
The high production costs associated with animation can be a significant barrier to entry for new players in the global market, hindering its growth. (Source)
The global visual effects market is poised for growth, with its value projected to increase from $10 billion in 2023 to $18 billion by 2032, driven by a CAGR of 6.7% during the forecast period. (Source)
Spanish is the most widely spoken foreign language among animators, with 35.3% reporting proficiency. French and Japanese are spoken by 14.0% and 8.1% of animators, respectively. (Source)
The average animator stays in their job for one to two years. (Source)
Animators earn the highest salaries in Nevada, where the average annual income is $130,776. (Source)
The most popular locations for animators to work are New York, NY, and Los Angeles, CA. (Source)
The cost of creating individual animation sequences can range from $10,000 to $60,000. (Source)
OTT streaming services like Netflix, Amazon Prime, YouTube, Twitter, and Facebook are playing an increasingly important role in distributing animation, visual effects, and game content. (Source)
Disney’s “Frozen” franchise has proven to be a massive financial success, generating a return on investment of nearly 9.9 times since its release in 2013. (Source)
Animation’s Growing Role in Marketing (Animation Statistics)
Marketers from various industries are using animated content, with the highest percentage (23.8%) coming from advertising and marketing agencies, followed by education (9.9%), technology (7.5%), financial (7.9%), and e-commerce/retail (7.9%) sectors. (Source)
A significant number of marketers, 60.8%, are using animation in their social media posts. (Source)
To explain complex concepts in a visually appealing and understandable way, 37% of marketers are utilizing animated explainer videos. (Source)
To make their email marketing campaigns more dynamic and engaging, 24.7% of marketers are strategically incorporating animations. (Source)
Animated GIFs are being used by 21.6% of marketers to add visual appeal and a playful element to their overall content. (Source)
While 9.9% of marketers consistently use animation in their campaigns, an additional 29.3% are incorporating animated elements without making them the primary focus. (Source)
2D Animation Statistics
The market for 2D animation software is experiencing significant growth, with its value projected to increase from $35.64 billion in 2022 to $92.93 billion by 2030, driven by a CAGR of 12.73%. (Source)
2D Animators in the United States earn an average annual salary of approximately $62,000, which is higher than the national average. (Source)
The film and television industry, along with the software development industry, are the main sectors employing the majority of 2D Animators. (Source)
Job growth for animators is expected to increase by about 5% over the next decade, according to the Bureau of Labor Statistics (BLS). This projected growth rate is consistent with the national average for the same period. (Source)
The animation field has been the leading application for 2D animation software, and this dominance is expected to continue throughout the forecast period. (Source)
The standard version segment is the most popular type of 2D animation software. (Source)
The growing demand for 2D animation software among small-scale independent animators is expected to drive regional expansion in the market. (Source)
3D Animation Statistics
Visual effects (VFX) are expected to be the fastest-growing segment of the 3D animation market between 2023 and 2030. (Source)
Emerging technologies like 4D and 5D experiences are raising awareness and appreciation for 3D animation across various industries. (Source)
3D modeling currently holds the largest share of the market revenue and is predicted to stay in the lead throughout the forecast period. Additionally, the 3D software and hardware segments are expected to experience significant growth due to the rising demand for skilled developers and designers. (Source)
The on-demand segment of 3D animation is projected to see the highest compound annual growth rate (CAGR) from 2023 to 2030. (Source)
The 3D animation industry is experiencing constant innovation. Examples include Spaceblock’s launch of 3D animation packs utilizing motion capture technology in December 2023 and Adobe’s introduction of AI and 3D features in September 2023, alongside enhanced storage capabilities from Frame.io. (Source)
The global market for 3D animation is experiencing significant growth, with its value projected to increase from $23 billion in 2023 to $63 billion by 2032, driven by a CAGR of 11.80%. (Source)
The entertainment and media industry has recently shown a growing demand for 3D animation, with many animation studios advancing the field by integrating virtual reality. (Source)
Almost 84% of the animation and visual effects industry uses open-source software, particularly in animation and visual effects. (Source)
The global 3D animation modeling market is expanding, with its value projected to increase from $6.6 billion in 2022 to $7.3 billion in 2023, representing an 11% growth rate. This growth is expected to continue, surpassing $11 billion by 2026. (Source)
The integration of AI, VR, and AR is expected to further drive the growth of the global 3D animation market. (Source)
Technological advancements and increased affordability of 3D animation are key factors driving market growth. (Source)
The adoption of 3D animation in e-learning platforms to enhance visual learning experiences is boosting the market. (Source)
A 3D Digital Artist can expect a total annual salary of $89,120, with an average base salary of $82,057. Additional compensation in the form of cash bonuses, commissions, tips, and profit sharing is also possible. (Source)
The 3D animation software market is experiencing significant growth, with its value projected to increase from $26.01 billion in 2024 to $58.64 billion by 2031, driven by a CAGR of 11.8%. (Source)
The 3D animation market is segmented into 3D Modeling, Motion Graphics, 3D Rendering, and Visual Effects based on techniques. (Source)
The media and entertainment sector held the largest revenue share in 2022 and is expected to maintain its dominance, driven by the widespread use of 3D and CGI in films. (Source)
AI’s Growing Role in Animation (Animation Statistics)
The implementation of Generative AI in animation production is anticipated to result in a significant decrease of 30% in the total time and expenses associated with the production process. (Source)
Integration of Generative AI into animation workflows can lead to a 20% increase in creative productivity for animators and artists. (Source)
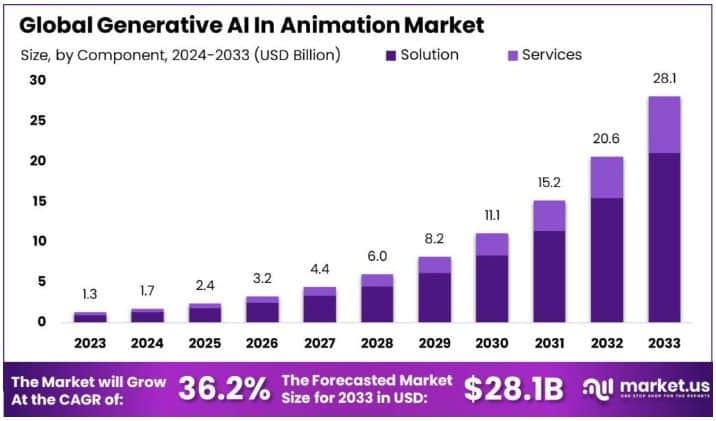
The worldwide market for Generative AI in Animation is projected to expand significantly, reaching an estimated value of USD 28.1 billion by the year 2033. This represents a substantial increase from its value of USD 1.3 billion in 2023, with an anticipated compound annual growth rate (CAGR) of 36.2% during the forecast period spanning 2024 to 2033. (Source)
Millennials are more likely to see AI animation as beneficial to the film and TV industries compared to GenXers, who tend to view it as harmful. A significant portion of respondents remain neutral or undecided. (Source)
Generative AI is expected to have a significant impact on 204,000 jobs in the entertainment industry between 2023 and 2026, with 118,500 of those jobs (21.4%) being in film, TV, and animation, representing 55% of the industry’s workforce. (Source)
The Generative AI in Animation market is expected to experience a remarkable growth rate of 35.7% annually, reaching a substantial $17.7 billion by the year 2032. This suggests a substantial and swift expansion within the industry. (Source)
According to a recent report, more than 60% of animation studios are either actively exploring or have already begun implementing Generative AI solutions within their production pipelines. (Source)
In the US film, TV, and animation industry, 3D modeling is the task most likely to be impacted by generative AI, with 40% of respondents using GenAI technology for character and environment design to streamline their workflow. (Source)
A survey found that 33% of respondents expect 3D modelers to be impacted by AI in the next 3 years, while 25% believe compositors are at risk. However, only 15% think storyboarders, animators, illustrators, and look/surface/material artists will experience job displacement by 2026. (Source)
The global market for AI animation tools is expanding significantly, with its value projected to increase from $372.84 million in 2023 to $1,311.60 million by 2032, driven by a CAGR of 15%. (Source)
A 2023 US survey on AI-animated content found that there is a gender divide in opinions, with more females than males viewing AI animation positively. However, a significant portion of both males and females remain neutral. (Source)
Animation Statistics By Region
Asia Pacific(Animation Statistics)
The Asia Pacific region is anticipated to exhibit one of the most rapid growth rates from 2022 to 2030, primarily due to the widespread acceptance and utilization of Generative AI in emerging economies such as China and India. (Source)
Data Bridge Market Research forecasts the Asia-Pacific animation industry to reach $147.37 billion by 2029, driven by increased demand and technological advancements. (Source)
OTT platforms constitute the largest animation market segment in the Asia-Pacific region. (Source)
The rising popularity of animated films and daily serials is a key factor driving the growth of the Asia-Pacific animation market. (Source)
China
2021 Domestic Revenue: China’s animation industry generated $3.84 billion domestically, closely competing with Japan’s $3.22 billion. (Source)
Top-Grossing Film: “Ne Zha” (2019) achieved domestic revenue of $737 million, accounting for 99% of its total $742 million earnings. (Source)
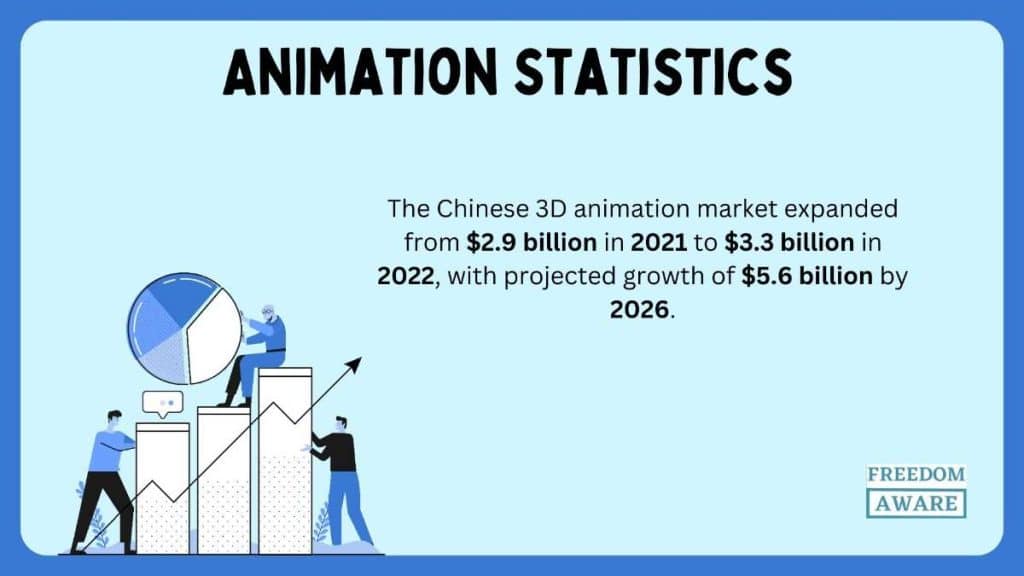
3D Animation Market Growth: The Chinese 3D animation market expanded from $2.9 billion in 2021 to $3.3 billion in 2022, with projected growth of $5.6 billion by 2026. (Source)
Japan
Highest-grossing Film: “Demon Slayer: Mugen Train” (2021) generated $507 million, with 24% ($121 million) coming from international markets. (Source)
The international market for anime reached approximately 2.93 trillion yen in the year 2022. (Source)
“The First Slam Dunk” emerged as the most successful animated film in Japanese theaters during the year 2023, amassing a box office gross of 15.87 billion Japanese yen. (Source)
Toei Animation Co., Ltd. generated nearly 41 billion Japanese yen in net sales through its domestic business in fiscal year 2024. During the same period, Asia emerged as the company’s second-largest market. (Source)
South Korea
Foreign Film Success: Animated films like “Frozen” and “Aladdin” have achieved significant box-office success in South Korea. (Source)
Industry Revenue: South Korea’s animation industry generated approximately 755.5 billion won in sales revenue in 2021, with production leading the sectors. (Source)
The number of businesses in South Korea’s animation industry increased by 32% in 2021, reaching 647 companies. (Source)
Science fiction/fantasy/adventure emerged as the most preferred genre by 44% of respondents, followed by comedy and drama. (Source)
A 2023 survey revealed a divided opinion on South Korean animation’s popularity, with 26.8% considering its niche and a similar proportion believing it to be popular among the general public. (Source)
A 2023 survey found that 21.5% of South Koreans watch animation almost daily, indicating a stable viewership habit since 2020. (Source)
Overwhelmingly, 91% of South Koreans prefer watching animation on OTT services, followed by advertising-based platforms and movie theaters. (Source)
A 2023 survey revealed that children visited cinemas an average of 2.7 times to watch animations in the past year, compared to the overall average of 1.7 times. (Source)
Australia
The Australian market for 3D animation is projected to expand at a CAGR of 15% from 2024 to 2030. (Source)
Factors driving the growth include increasing demand for high-quality 3D animation, cost-effectiveness of 3D technologies, and rapid technological advancements. (Source)
Australia’s 3D animation sector is highly competitive, with prominent companies like Animal Logic and Alt.vfx. (Source)
The consulting segment is anticipated to experience the highest CAGR of 13.3% from 2021 to 2026. (Source)
Ongoing technological advancements and increased content consumption will fuel the demand for innovative animations. (Source)
The on-demand deployment segment is expected to grow during the 2021-2026 forecast period due to its cost-efficiency. (Source)
North America
As of mid-2022, the top-grossing animated films in North American cinema history were globally popular titles. (Source)
As of February 2023, the top-grossing Pixar films in the US and Canada were “Incredibles 2” ($609 million), “Finding Dory” ($486 million), “Toy Story 4” ($434 million), and “Toy Story 3” ($415 million). (Source)
The North American animation market reached USD 23.22 billion in 2023 and is projected to grow to USD 36.73 billion by 2031, with a CAGR of 5.90% from 2024 to 2031. (Source)
North America is expected to lead the animation market due to its widespread use in various applications, the establishment of major animation studios, and increased animated game production. (Source)
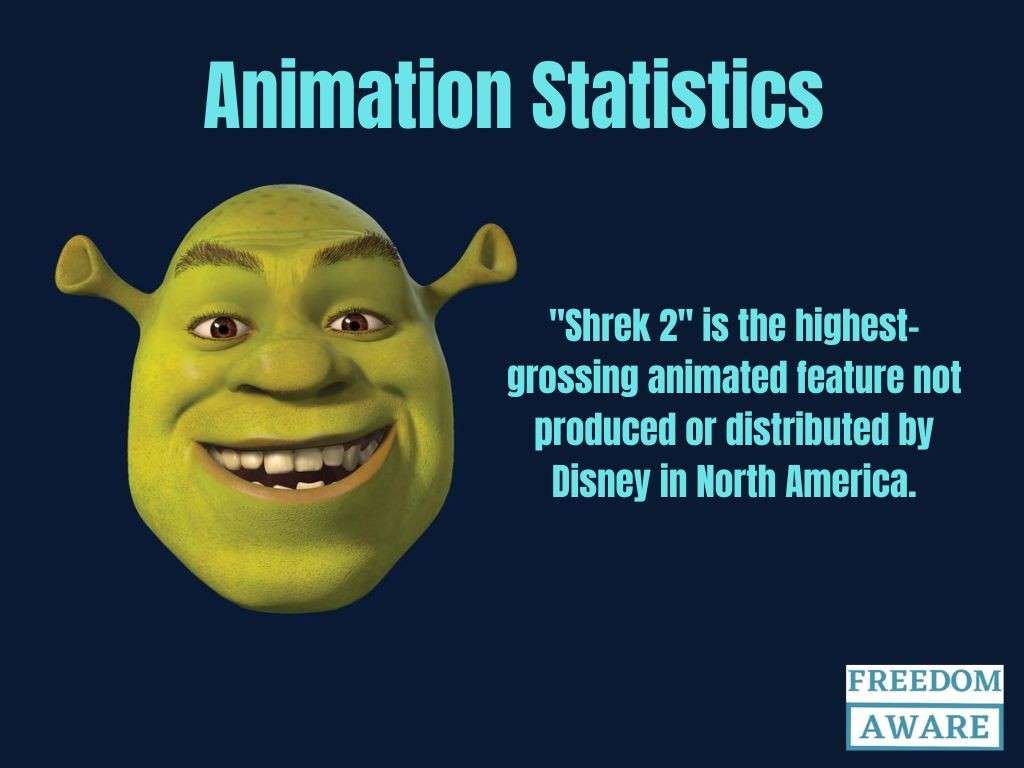
“Shrek 2” is the highest-grossing animated feature not produced or distributed by Disney in North America. The Shrek franchise is DreamWorks Animation’s most successful franchise. (Source)
The number of people employed in Canadian animation studios is estimated to be between 4,127 and 10,494 individuals. (Source)
Films from the Shrek franchise occupy four of the top ten highest-grossing DreamWorks Animation movies in the U.S. and Canada. (Source)
Europe
In 2022, nearly 44% of animated film audiences in France were children aged 3 to 14. (Source)
European TV animation co-productions account for 36% of all TV animation hours produced, a significantly higher proportion than live TV fiction. (Source)
The share of European works in animation (21%) is notably lower than in other categories of works (33%), impacting both SVOD and TVOD platforms, especially in animation films. (Source)
The Observatory estimates Europe’s annual production volume of TV animation to be around 220 titles, totaling 5,200 episodes and 830 hours. (Source)
Animation holds a significant position in TV content on SVOD services, accounting for 22% of titles. (Source)
Approximately 55 animation films and 830 hours of animation TV content are produced annually in Europe. (Source)
The UK animation industry generated a direct GVA of £130.6 million and direct tax revenues of £74.2 million in 2019. Considering indirect benefits, the estimated GVA increases to £285.2 million, and tax revenues rise to £110.2 million. (Source)
The UK animation industry directly employs around 1,000 skilled professionals. Additionally, it supports an additional 14,390 jobs in related industries, totaling 15,390 jobs when considering the broader value chain. (Source)
In 2022, France witnessed the release of 52 animated films, a significant increase from the previous year’s output. (Source)
51% of workers in the UK animation industry are women. (Source)
Africa
The African animation market was valued at US$13.3 billion in 2023 and is projected to reach US$17.8 billion by 2032, with a CAGR of 7.78% from 2024 to 2032. (Source)
South Africa leads the animation industry in Africa. (Source)
The increasing use of animated visuals in brand advertising and product promotions drives market expansion. Leading animation studios in South Africa include Triggerfish Animation Studios, Aardman Animations, and Boulder Media. (Source)
Adopting advanced animation software with customizable characters and extensive libraries, as well as integrating virtual reality and artificial intelligence into 3D gaming platforms are key drivers of market growth. (Source)
Israel is the dominant player in the Middle East and Africa region due to the growing demand for digital advertisements featuring animated content. (Source)
Conclusion (Animation Statistics)
The world of animation is booming, and these statistics paint a vibrant picture of its growing impact. From captivating audiences across generations to driving innovation in storytelling and technology, animation’s influence is undeniable. Understanding these trends is crucial for anyone involved in the industry, from aspiring animators to industry leaders. As technology continues to evolve and audiences demand more immersive experiences, animation’s power to inspire, entertain, and educate will only continue to grow. So, whether you’re creating your own animated masterpiece or simply an avid fan, embrace the dynamic world of animation and unlock its power to captivate and connect.
FAQ (Animation Statistics)
Is animation a successful career?
A single animation film can require the services of up to 500 animators, presenting substantial employment opportunities. Animation stands as a tangible, profitable, and challenging career path that serves both the entertainment and education (e-learning) industries.
Is animation in high demand?
The United States stands as one of the primary destinations for animation, and the demand for animators is steadily increasing across the nation. The Bureau of Labor Statistics predicts the creation of 3,200 new jobs for multimedia artists and animators in the United States between 2021 and 2031.
How is AI used in the animation industry?
AI is employed in the animation industry to automate and improve various tasks, including character and environment design, animation testing, and special effects creation, thereby increasing efficiency and realism. Furthermore, AI-powered tools can aid in tasks such as color correction, lighting, and compositing, enabling human animators to concentrate on creative decision-making and storytelling.
Which is the top animation company in the world?
Determining the top animation company in the world can be subjective and depends on various factors such as revenue, critical acclaim, cultural impact, and technological innovation.
However, some of the most renowned and consistently successful animation studios often mentioned include:
Walt Disney Animation Studios: Known for iconic characters and timeless stories.
Pixar Animation Studios: Renowned for their innovative storytelling and groundbreaking technology.
DreamWorks Animation: Producing a wide range of animated films, often with a comedic or action-packed focus.
Studio Ghibli: A Japanese animation studio celebrated for its imaginative storytelling and beautiful visuals.
Sony Pictures Animation: Known for their diverse portfolio, including superhero films and family comedies.
Are you preparing for a job interview and want to increase your chances of success? Understanding job interview statistics can help you prepare and make a positive impression on potential employers. In this article, we’ll delve into the latest job interview statistics and provide you with valuable insights to help you ace your next interview.
Job Interview Statistics (Editor’s Pick)
Submitting five to ten applications per week increases the likelihood of landing an interview.
92% of companies use social media platforms to research candidates before an interview.
36% of employers look for multitasking skills in candidates.
47% of interviewers said that they wouldn’t offer the job to a candidate if they had little knowledge of the company.
33% of interviewers knew whether they would hire someone within the first 90 seconds of an interview.
76% of recruiters will pass on a candidate they perceive as overly arrogant.
The entire interview process usually spans about 23 days.
73% of candidates are passive job seekers.
88% of companies believe referrals result in the best hiring outcomes.
A substantial 90.6% of employers prefer candidates with work experience.
The average time spent looking at a resume is 5-7 seconds.
Nearly half (47%) of interviewers would not hire a candidate lacking knowledge about the company.
Typos or lousy grammar are immediate deal breakers for 77% of recruiters, and 35% reject candidates with unprofessional email addresses.
Only 41% of candidates receive feedback after an interview, though 94% expect it.
General Job Interview Statistics
A large majority (90.6%) of employers prioritize candidates with work experience. (Source)
Nearly half of interviewers refuse to hire candidates who lack an understanding of the company. (Source)
A significant majority (81%) of job seekers admit to lying during interviews. (Source)
Typos or poor grammar are red flags for 77% of recruiters. (Source)
35% reject candidates with unprofessional email addresses. (Source)
In-person interviews typically last between 45 and 90 minutes, depending on the tasks or presentations involved. (Source)
Impressed candidates may receive job offers within 24-48 hours. (Source)
60% of recruiters incorporate video interviews into their hiring process. (Source)
When hiring, employers primarily value multitasking (36%), followed by initiative (31%), creative thinking (21%), and other skills (12%). (Source)
Employers typically spend only 5-7 seconds glancing at a resume. (Source)
For every job, an average of 118 people apply, but only about 20% receive interviews. (Source)
The majority of candidates (92%) believe mock interviews are crucial preparation. (Source)
A positive interview experience is more likely (52%) when candidates are informed about the next steps. (Source)
Only one in four candidates reported having an excellent interview experience. (Source)
Nearly 80% of job candidates find video interviews more difficult or stressful compared to in-person interviews. (Source)
Applicants with white-sounding names were 50% more likely to be contacted for job interviews than those with typical black names. (Source)
Nearly 62% of candidates don’t receive any information about the interview beyond the date and location. (Source)
Face-to-face interviews usually last 40 minutes, while phone interviews are shorter, averaging 30 minutes. (Source)
While 44% of candidates hear back within a few weeks and 37% within a week, only a small percentage (less than 4%) receive feedback within a day. (Source)
Typically, only 2% of job applicants are invited for interviews. (Source)
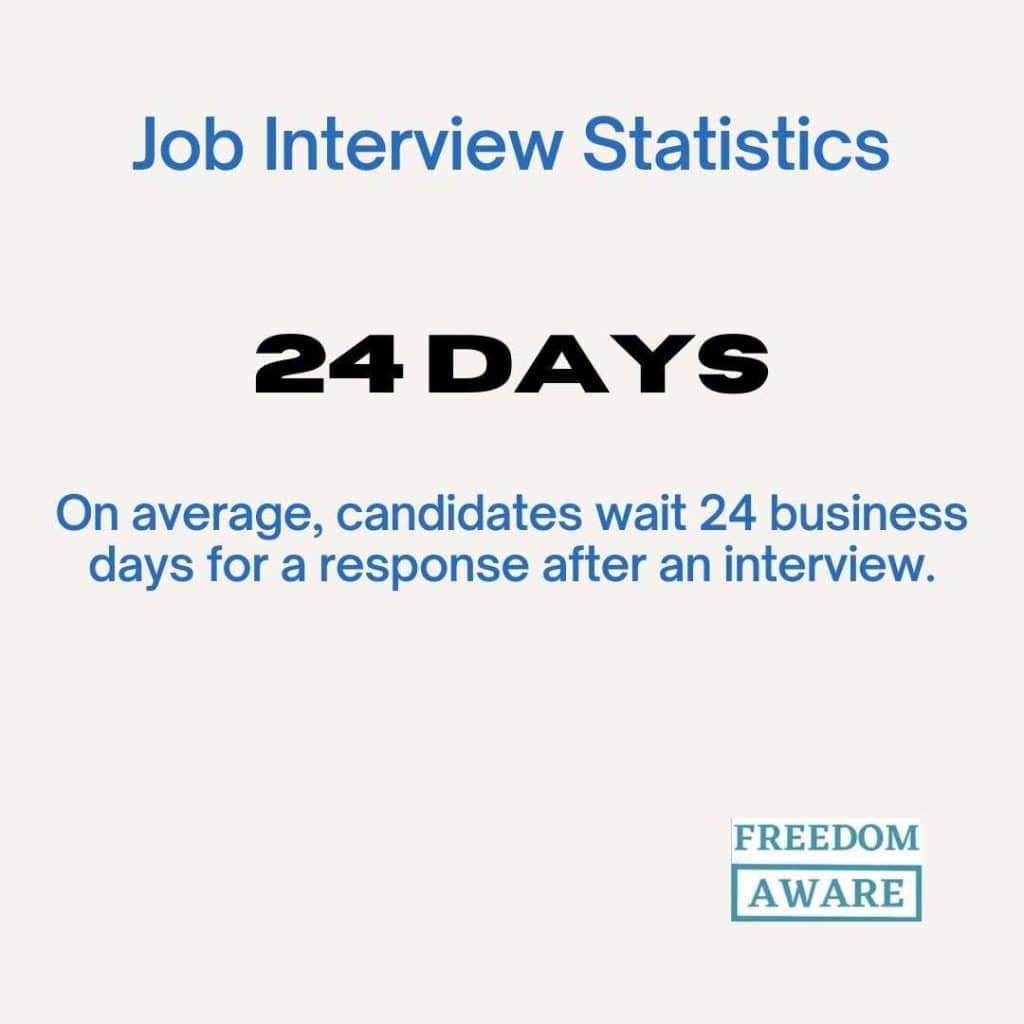
On average, candidates wait 24 business days for a response after an interview. (Source)
Men exhibit 33% more confidence in their interview performance compared to women. (Source)
The average hiring process in the U.S. has slightly lengthened from 22.9 days in 2014 to 23.8 days currently. (Source)
A positive interview experience significantly influences job acceptance, with 76% of candidates more likely to accept offers. (Source)
Nearly half of the candidates(45%) who ghost employers do so after the interview. (Source)
In the UK, candidates spend an average of £52 on travel and accommodation for interviews. They also invest about £58 in new interview attire. (Source)
A significant number of candidates (53%) have been ghosted by employers, with 31% being ghosted after a positive response but before scheduling an interview. (Source)
To improve their chances, 95% of people attempt to appear younger during job interviews. (Source)
Age discrimination is prevalent in various industries, with finance, advertising, and digital marketing reporting rates of 85%, 84%, and 81%, respectively. (Source)
A large majority (75%) of U.S. employees have experienced ageism during job hunting, and over half (53%) continue to experience it in their current jobs. (Source)
Organizations often use competency-based questions to assess candidates’ skills. (Source)
Only 41% of candidates receive feedback after interviews, despite 94% expecting it. (Source)
A significant 93% of people feel anxious about job interviews. (Source)
Nearly 40% of applicants don’t receive an interview despite applying to ten jobs. (Source)
On average, white job applicants received 9.5% more interview offers than assumed black applicants. Additionally, the worst-performing companies, often in the car industry, interviewed 23% more assumed white applicants than assumed black applicants. (Source)
Women are 30% less likely than men to be called for interviews, even with identical qualifications. (Source)
A study shows that women without children are 23.5% less likely to receive interview calls than men in similar circumstances. (Source)
Women with children are 35.9% less likely to be called for interviews than fathers. (Source)
Insights into Job Interview Procedures (Job Interview Statistics)
A study revealed that 33% of hiring managers make hiring decisions within 90 seconds. (Source)
A 50-year-old worker is up to three times less likely to get an interview than a 28-year-old. (Source)
Applicants submitting 21-80 applications have a 30% chance of receiving an offer. (Source)
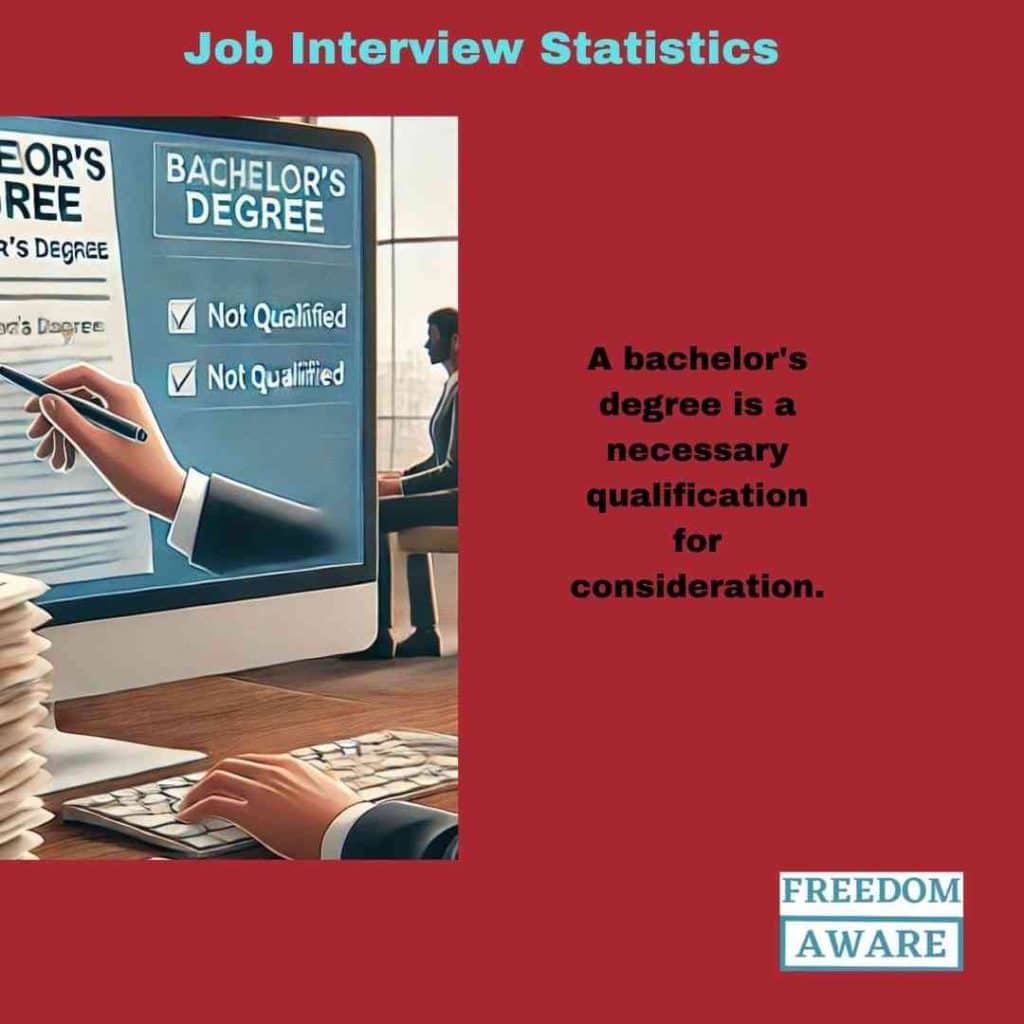
For nearly one-third of job listings, a bachelor’s degree is a necessary qualification for consideration, excluding those without it from the interview process. (Source)
Lengthy application processes lead to 60% of applications being abandoned. (Source)
Utilizing specialized recruiting platforms can reduce cost-per-applicant by 250%. (Source)
Candidates typically receive one interview offer for every six applications submitted. (Source)
76% of CVs are rejected due to unprofessional email addresses. (Source)
51% of recruiters find the best candidate after conducting three interviews. (Source)
Even for non-technical roles, companies with over 5,000 employees take an average of 58 days to make offers. (Source)
The typical interview process consists of five stages, a common practice across most companies. (Source)
Responsiveness during the hiring process is increasingly valued, especially in the UK (52%) and US (56%), compared to previous years. (Source)
First Impressions in Job Interviews (Job Interview Statistics)
55% of employers prefer smart-casual attire, while 19% have no dress code, and 26% require formal interview attire. (Source)
59% of recruiters reject arrogant candidates, emphasizing the importance of humility and teamwork. (Source)
A vast majority, 95%, place significant importance on first impressions, and a large proportion, 79%, are convinced of their skill in creating a favorable one. (Source)
39% of job seekers leave a bad impression due to confidence issues, voice quality, or lack of a smile, highlighting the significance of nonverbal cues. (Source)
60% of interviewers form an opinion about a candidate within the first 15 minutes. (Source)
Managers are less likely (65%) to select candidates who avoid eye contact and may consider (40%) a candidate’s voice as a dealbreaker. (Source)
67% of recruiters believe eye contact is crucial for establishing a good impression. (Source)
55% of recruiters base their decisions on handshakes, while a candidate’s smile influences 40%. (Source)
Half of all managers judge candidates based on clothing and behavior before the interview even begins. (Source)
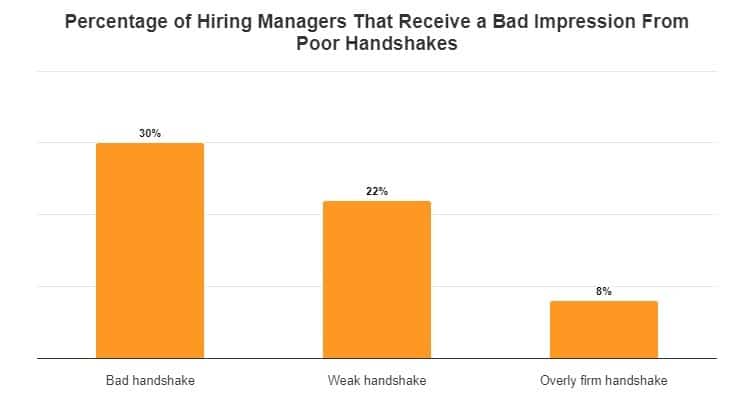
A limp handshake can be a red flag for recruiters, with 30% stating it diminishes a candidate’s perceived impressiveness. (Source)
68% of employees believe the applicant experience reflects the company’s treatment of its employees. (Source)
Candidates have only 7 seconds to make a positive first impression during a job interview. (Source)
69% of job interviewers formed a first impression before the candidate spoke, and 83% were more positive about someone who appeared self-confident. (Source)
The tone of someone’s voice matters to 38% of people when they’re forming a first impression. (Source)
Job Hiring Processes (Job Interview Statistics)
Nearly 90% of candidates exit the hiring process due to misalignments between the company’s employee value proposition and their own expectations. (Source)
The average cost per hire has increased from $4,129 in 2019 to $4,700, representing a 14% rise. (Source)
In France, personal contact is crucial for 54% of candidates in the hiring process, compared to 53% in Germany, 29% in the UK, and only 18% in the US. (Source)
52% of job seekers declined job offers due to negative experiences. (Source)
The average time-to-hire across industries is three to four weeks, with only 25% of respondents filling roles in less than two weeks. (Source)
48% of businesses find their top-quality hires through employee referrals. (Source)
Approximately 90% of employers review candidates’ social media profiles, and 79% have rejected applicants based on their findings. (Source)
98% of businesses conduct background checks on applicants, with 43% using Google. Additionally, 80% of businesses consider a personal website important in candidate evaluation. (Source)
63% of recruiters cite finding enough suitable candidates as their biggest challenge. (Source)
Corporate-level roles attract an average of 250 applications, with top candidates often interviewing with multiple companies simultaneously. (Source)
61% of interviewers and employers believe 9:00 a.m. and 11:00 a.m. are the best times for interviews due to optimal alertness and responsiveness. (Source)
Employers emphasizing diversity in their job postings receive 26% more applications from women. (Source)
Companies with ethnically diverse boards are 13% more likely to outperform those with less diversity. (Source)
Millennials and Gen Z will make up 75% of the global workforce by 2025. (Source)
Behaviors of Recruiters During Job Interviews (Job Interview Statistics)
74% of human resources professionals use structured interview techniques to assess candidates systematically. (Source)
Behavioral interviews, which focus on past behaviors to predict future performance, are used in 73% of cases. (Source)
Phone screening, often used as an initial step in candidate assessment and screening, is utilized by 57% of recruiters. (Source)
Panel interviews, involving multiple interviewers assessing a candidate simultaneously, are utilized by 48% of HR professionals. (Source)
A survey found that hiring managers spend between 30 minutes and 2 hours scheduling a single interview. (Source)
According to a survey, 25% of recruiters consider long paragraphs of text instant dealbreakers, while 17% say the same about resumes exceeding two pages. (Source)
Technology In Job Interviews (Job Interview Statistics)
79% of hiring managers now use video technology to interview and evaluate candidates, a substantial increase from previous years. (Source)
About 25% of job seekers prefer live video interviews over in-person ones. (Source)
51% of recruiters utilize automated interview scheduling tools to streamline the process and improve efficiency. (Source)
Approximately 97.4% of Fortune 500 companies use application tracking software. (Source)
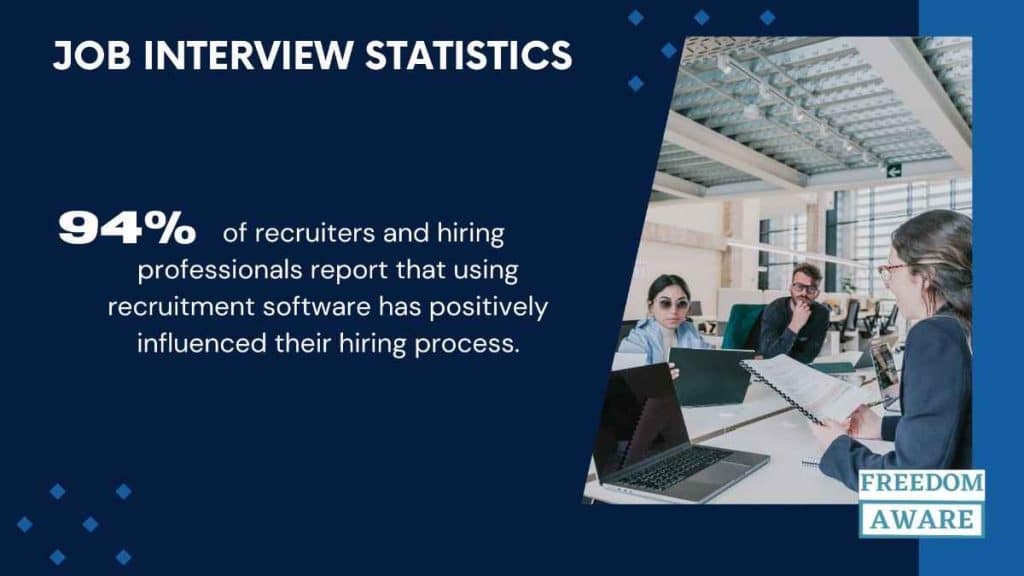
94% of recruiters and hiring professionals report that using recruitment software has positively influenced their hiring process. (Source)
A LinkedIn survey indicates that 81% of talent professionals and recruiters believe virtual recruiting will continue post-Covid. (Source)
A recent Indeed survey found that 82% of employers use virtual interviews, and 93% plan to continue using them. (Source)
Only 46% of HR professionals in the U.S. feel prepared to adapt to virtual recruiting. (Source)
SBAM reports a 49% increase in the popularity of online job interviews since 2011. (Source)
From 2019 to 2023, the use of video interviews shot up by 57%. (Source)
In 2024, 69% of employers intend to use video interviews in their hiring process. (Source)
Interview Success and Failure Analysis (Job Interview Statistics)
Many studies have shown that companies are more hesitant to hire individuals who are currently unemployed. (Source)
Job seekers with bachelor’s degrees were significantly more likely to go through interviews without offers compared to those with only a high school diploma, with 51% and 35% respectively. (Source)
A significant number of recruiters, 60%, report losing potential candidates before they can even schedule an interview. (Source)
The recruitment process faces a high failure rate of approximately 50%, which is a major problem at all job levels. (Source)
Employers believe that the majority of job applications, around 75%, are from candidates who are not qualified for the position. (Source)
In the United States, a much higher percentage of job candidates, 67%, are willing to wait six days for an interview compared to their counterparts in Germany, the UK, and France. (Source)
Key Interview Trends for 2024 (Job Interview Statistics)
These trends demonstrate a move toward more streamlined, tech-centric, and competency-based hiring practices, with a strong focus on retaining top talent.
Virtual Recruitment
The shift to remote work has led to a dramatic increase in virtual recruiting practices. Many companies have embraced virtual recruiting and onboarding, with some adopting fully virtual processes. It’s imperative that virtual recruiting effectively communicates a company’s culture from the start. Recruiters are key in developing strategies for finding, training, and retaining employees, and virtual recruiting is playing an increasingly important role in this process. By allowing companies to reach a broader pool of qualified candidates, virtual recruiting opens up new opportunities and improves the overall recruitment process for many organizations.
Soft Skill Assessment
Soft skills are gaining significant attention from employers. While technical skills are still valued, interviewers are now more intentional about observing and assessing soft skills during interviews. They are looking for communication, teamwork, adaptability, and problem-solving abilities. Many job interviews now include personality and behavioral tests to properly measure a candidate’s capabilities and identify the top performers. Startups and small businesses, especially, need to evaluate soft skills when interviewing job candidates.
Branding on Social Media
Employers are increasingly checking potential candidates’ social media profiles. This means that job seekers should be intentional about presenting a clean and professional image on their social media platforms.
Diversity And Inclusion
Companies are prioritizing diversity and inclusion more than ever before. Employers are actively striving to build more diverse teams and create inclusive workplaces. This is not only the right thing to do but also makes good business sense. Diverse teams are more innovative, better reflect the diversity of their customers, and have higher employee satisfaction. Cultivating a culture of respect, empathy, and understanding is crucial.
AI in Recruitment
AI is becoming a more prominent part of the recruitment process. Machines can now analyze resumes, cover letters, social media profiles, and video interviews to identify top candidates. This saves recruiters time and effort, allowing them to focus on the more strategic aspects of hiring. But AI must be used in conjunction with human judgment. We don’t want to end up with a completely automated hiring process that lacks the personal touch that humans bring to the table.
How to Stand Out in an Interview (Job Interview Statistics)
To make a memorable impression in an interview, consider these tips:
Before the Interview
Research the company: Understand its mission, values, and recent news.
Practice your answers: Prepare for common interview questions and practice your responses.
Dress appropriately: Choose professional attire that reflects the company culture.
Arrive early: Aim to arrive 10-15 minutes early to show punctuality.
During the Interview
Make a strong first impression: Greet the interviewer with a firm handshake and eye contact.
Be enthusiastic and engaged: Show genuine interest in the company and the role.
Highlight relevant skills and experiences: Tailor your answers to demonstrate how your skills align with the job requirements.
Ask thoughtful questions: Show your interest by asking insightful questions about the company, the role, and the team.
Follow up: Send a thank-you email within 24 hours, reiterating your interest in the position.
Most importantly don’t forget to be yourself, be positive, and show confidence.
Conclusion (Job Interview Statistics)
The job interview process can be intimidating, but understanding these statistics can equip you with valuable insights and tips. By preparing thoroughly, presenting yourself confidently, and demonstrating your qualifications and enthusiasm, you can increase your chances of success and land your dream job.
FAQ (Job Interview Statistics)
What is a good number of interviews?
The ideal number of interviews can vary depending on individual circumstances and the specific job market.
However,3-5 interviews may be sufficient.
What percentage of job interviews are successful?
The success rate of job interviews can vary significantly depending on various factors.
While specific data can fluctuate, it’s generally estimated that only a small percentage of job applicants who are interviewed receive job offers. This can range from a few percent to around 20% or less, depending on the Industry, Job level, Location, and even candidate qualifications.
The sharing economy, a term coined in 2008, is disrupting traditional industries and changing the way we live, work, and consume. It’s a system where individuals share access to goods, services, and resources, rather than owning them outright. From ride-hailing to short-term rentals and collaborative consumption, the sharing economy has witnessed explosive growth, transforming how we think about ownership and access.
Here are Some compelling statistics that showcase the remarkable impact and potential of the sharing economy;
Sharing Economy Statistics (Editor’s Pick)
86 million Americans have participated in the sharing economy.
The global sharing economy market is projected to reach $335 billion by 2025.
70% of millennials are more likely to share goods and services than own them.
The sharing economy has created over 1 million jobs worldwide.
55% of sharing economy users are motivated by convenience.
72% of sharing economy users are motivated by cost savings.
60% of sharing economy users have used services for business purposes.
80% of sharing economy users expect to increase their usage in the next 12 months.
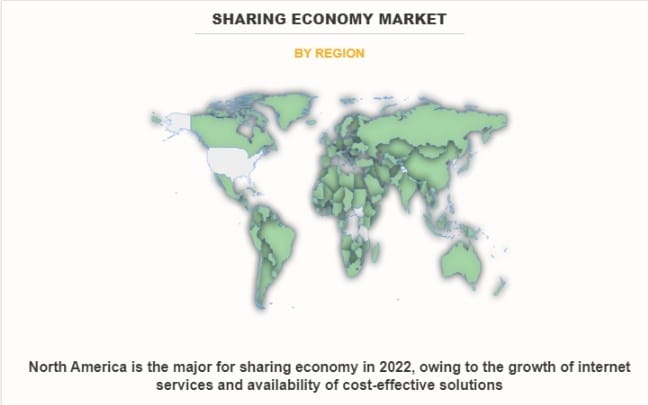
North America dominated the sharing economy market in 2022 and is expected to maintain its dominance through 2032.
General Growth and Size (Sharing Economy Statistics)
The global sharing economy is poised for rapid expansion, surging from $150 billion in 2023 to a projected $794 billion by 2031, fueled by a robust annual growth rate of approximately 32%. (Source)
The United States has witnessed a substantial increase in sharing economy users, climbing from roughly 44.8 million in 2016 to an estimated 86.5 million by 2021. (Source)
The sharing economy is on the brink of a major milestone, with revenue projections exceeding $1 trillion by 2031. (Source)
55% of sharing economy users believe it makes it easier to get around without owning a car. (Source)
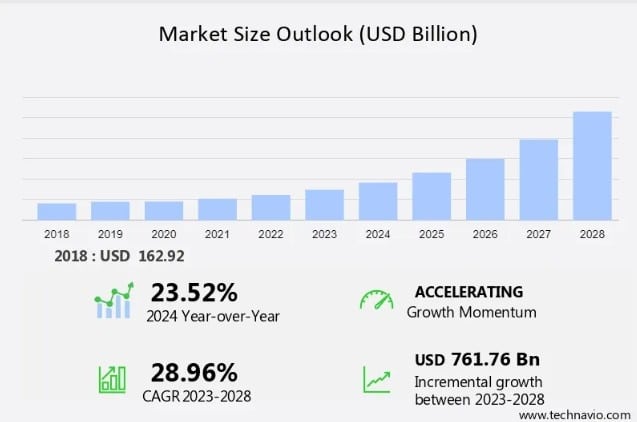
Valued at nearly $150 billion in 2022, the global sharing economy market is on track for exponential growth, reaching $793.68 billion by 2028 with a compound annual growth rate of 32.01%. (Source)
In 2018, the individual segment dominated the sharing economy, generating a revenue of $114.22 billion. (Source)
Between 2023 and 2028, the sharing economy market is projected to experience substantial growth, expanding by a staggering $761.76 billion at a compound annual growth rate of 28.96%. (Source)
The sharing economy offers easier entry, flexibility, and freedom. It attracts workers and investors, with 72% of independent workers preferring contract work and 50% of investors participating in peer-to-peer lending. (Source)
Cost reduction is the primary advantage cited by consumers when utilizing sharing economy services, with 54% of respondents highlighting its affordability. (Source)
Some projections put the sector’s revenues at $335 billion globally by 2025, and the scope for further widening its geographic reach remains huge. (Source)
Scope and Impact (Sharing Economy Statistics)
While the COVID-19 pandemic temporarily impacted the US home-sharing economy, with user numbers dropping to 23.3 million in 2020, a strong recovery is expected, reaching 68.2 million users by 2023. (Source)
The sharing economy is a global phenomenon, encompassing 9,829 companies across 133 countries and spanning diverse sectors including business, finance, food, technology, and real estate. (Source)
Europe is a significant player in the global sharing economy, anticipated to contribute $40.2 billion in revenue, accounting for 19.2% of the total market in 2022. (Source)
The global market for shared mobility services is expected to grow to $619.51 billion by 2026. (Source)
Generation Z has been the primary driving force behind the sharing economy since 2022, and this trend is projected to continue in the future. (Source)
User Behavior and Demographics (Sharing Economy Statistics)
Sharing economy consumers prioritize value and convenience over brand loyalty, with a strong majority – 83% – willing to change providers for lower prices and 62% for faster service. (Source)
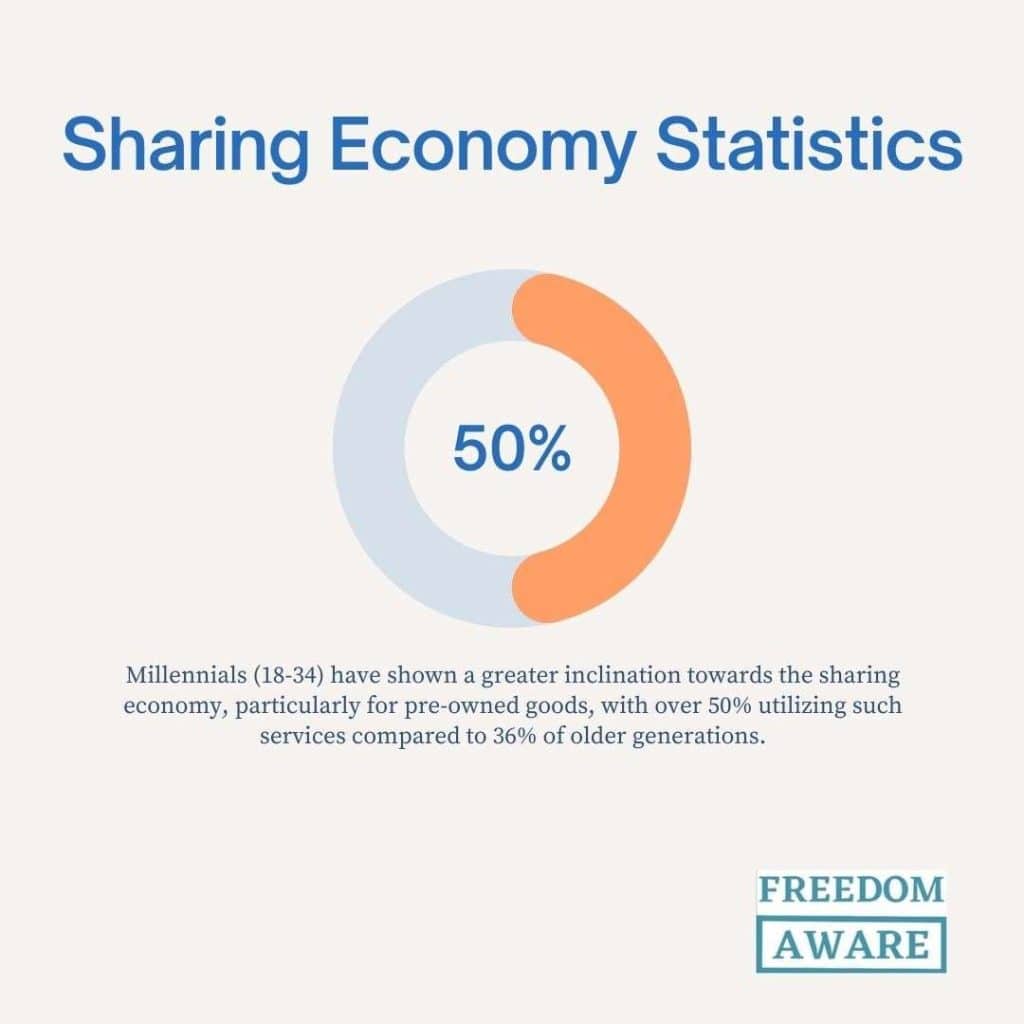
Millennials (18-34) have shown a greater inclination towards the sharing economy, particularly for pre-owned goods, with over 50% utilizing such services compared to 36% of older generations. (Source)
Attitudes towards the sharing economy vary across age groups, with millennials (18-34) expressing significantly higher satisfaction with ride-hailing services than older demographics. (Source)
Market Dynamics and Key Players (Sharing Economy Statistics)
Uber and Lyft have established themselves as the primary players in the U.S. ride-sharing market, boasting high levels of brand recognition among American consumers. (Source)
Regus and WeWork emerged as the dominant forces in the U.S. coworking office space market in 2018, collectively leasing millions of square feet. (Source)
Coworking offices have lagged behind other sharing economy services in terms of consumer awareness, with only 17% of Americans familiar with the concept in 2018. (Source)
Ride-hailing platforms like Uber and Lyft leverage artificial intelligence to optimize pricing, offer personalized discounts, and enhance route efficiency. This data-driven approach aligns with the growing consumer expectation for tailored experiences. (Source)
Uber’s valuation of $68 billion in 2013 marked a significant milestone, eclipsing the market capitalization of traditional automotive giants like Chrysler, Ford, and General Motors. (Source)
The entertainment and telecommunications sectors dominated the sharing economy’s revenue landscape in 2022. (Source)
Shared transportation emerged as a dominant force in the global sharing economy in 2023 and is poised for continued expansion. (Source)
Airbnb has solidified its position as the leading home-sharing platform, experiencing substantial user growth in the United States. With tens of thousands of listings in major cities like New York and Los Angeles, Airbnb has transformed the hospitality industry. (Source)
Transportation is the largest segment of the sharing economy. (Source)
Sharing economy services have become widespread in the United States, with 72% of Americans using at least one platform. Online secondhand shopping and ride-hailing apps are particularly popular. (Source)
Younger Americans, especially those under 30, are more likely to utilize sharing economy platforms as a means of generating income. (Source)
North America has been the dominant force in the sharing economy since 2022 and is projected to maintain its leadership position through 2032. (Source)
The United States has witnessed a dramatic surge in sharing service awareness, with adoption rates climbing from 47% in 2015 to 83% by May 2018. (Source)
Trust in sharing economy services varies across the United States, with 19% of Northeast residents expressing high confidence in platforms like Uber, Lyft, Airbnb, and HomeAway. (Source)
The Middle East and Africa show promising signs of sharing economy adoption, with 68% of people open to sharing or renting and 71% willing to rent from others. (Source)
Europe’s embrace of the sharing economy is moderate, with 54% willing to share or rent and 44% open to renting from others. (Source)
The Asia-Pacific region is poised for significant growth in the sharing economy, contributing 32% to overall market expansion between 2024 and 2028. (Source)
Germany’s car-sharing market has expanded rapidly, with user numbers increasing from approximately 4.47 million in 2023 to around 5.5 million in 2024. (Source)
Car-sharing remains popular in Germany, although interest slightly declined from 8.3 million in 2022 to 8 million in 2023. Despite this, the country boasts 293 car-sharing companies as of 2024. (Source)
France’s ride-sharing market is experiencing robust growth, with a projected compound annual growth rate of 12.82% from 2022 to 2027, resulting in a market value increase of $2.47 billion. (Source)
The e-hailing sector is driving growth in France’s ride-sharing market. With the number of smartphone subscriptions expected to reach 84.75 million by 2024, the market is primed for further expansion. (Source)
The French e-hailing market has witnessed substantial growth since its valuation of $1.79 billion in 2017. (Source)
Asia-Pacific residents exhibit a strong inclination towards sharing and renting, with 78% open to the concept and 81% willing to rent from others. (Source)
Latin Americans demonstrate a significant openness to the sharing economy, with 70% expressing interest in sharing or renting and 73% willing to rent from peers. (Source)
China’s sharing economy surpassed a transaction volume of $500 billion in 2016. (Source)
Regional Case Studies (Sharing Economy Statistics)
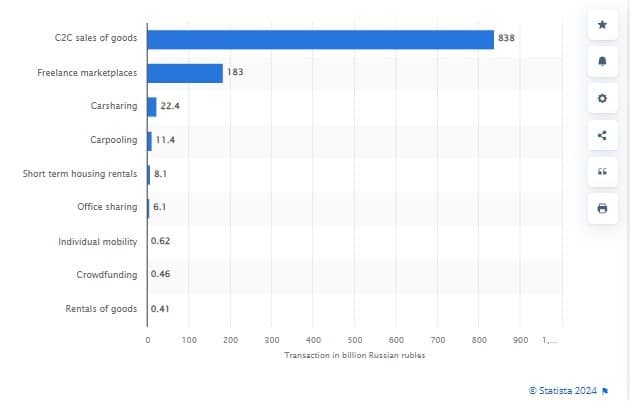
Russia’s sharing economy is dominated by consumer-to-consumer sales, accounting for the lion’s share of the market in 2020. Freelance services and carsharing followed as significant sectors. (Source)
Freelance services secured the second position with a market value of 183 billion Russian rubles while carsharing rounded out the top three at 22.4 billion Russian rubles. (Source)
Airtasker has experienced explosive growth in Australia, with thousands of new members joining daily and overall membership tripling since 2014 to reach 320,000. (Source)
Australians are increasingly leveraging the sharing economy for task completion and supplementary income, with 16% and 6.7% respectively utilizing these services. (Source)
Awareness of major sharing economy platforms like Airbnb, Uber, and Airtasker is widespread in Australia, with nearly half the population familiar with these brands. (Source)
The United States is demonstrating growing familiarity with the sharing economy, with 44% of consumers aware of the concept and 19% having used it for tasks. (Source)
Australia’s sharing economy is thriving, as evidenced by Airtasker’s rapid expansion with over 100,000 new members in just six months. (Source)
Hyperlocal sharing is the primary catalyst propelling the growth of the sharing economy. (Source)
Artificial intelligence is revolutionizing the sharing economy by enhancing customer experiences and driving operational efficiency, with 45% of executives recognizing its critical role in 2023. (Source)
Autonomous ridesharing is a key force behind the expansion of the French ride-sharing market. (Source)
Challenges Facing the Sharing Economy (Sharing Economy Statistics)
The ambiguous classification and uncertain rights of gig economy workers pose a significant obstacle to the expansion of the sharing economy. (Source)
Inconsistent national transport regulations and opposition from established transportation providers impede the growth of the ride-sharing market in France. (Source)
Government regulation of the sharing economy is evolving rapidly, with different countries implementing varying rules and regulations. (Source)
The sharing economy faces four primary challenges: potential exacerbation of social inequality through renting practices, the corporate nature of internet platforms undermining worker benefits, uncertain long-term sustainability, and persistent security and trust concerns. (Source)
The most frequent issues encountered by Swedish users of sharing economy services are mistreatment by the other party and scheduling problems, both affecting 26% of respondents. (Source)
Ride-sharing services, exemplified by Uber’s uberPOP, that employ non-professional drivers have been deemed illegal by courts in Belgium, France, Germany, Italy, and the Netherlands. (Source)
The South Korean government banned Uber to encourage the development of alternative, locally developed apps. (Source)
The mayor of Paris, for example, set up a team of 20 agents specifically to crack down on illegal room-sharing hosts. (Source)
Conclusion (Sharing Economy Statistics)
These statistics demonstrate the phenomenal growth and impact of the sharing economy. It’s disrupting traditional industries, creating new jobs, and offering consumers more choices and flexibility. However, challenges remain in areas like regulation, taxation, and safety. The future of the sharing economy is bright, with technological advancements and evolving consumer preferences shaping its trajectory. As the sharing economy continues to evolve, it’s crucial to stay informed about its trends and potential impact on various sectors and industries.
FAQ (Sharing Economy Statistics)
What is the trend of the sharing economy?(Sharing Economy Statistics)
The sharing economy is a contemporary manifestation of a historical concept where individuals exchange goods and services. Modern technology, particularly online platforms, has revitalized this model, enabling widespread peer-to-peer transactions.
Essentially, the sharing economy is moving from a disruptive force to an integral part of the global economy, with a profound impact on how people consume goods and services.
What are the four models of the sharing economy?(Sharing Economy Statistics)
The four sharing economy models are franchiser, principal, chaperone, and gardener.
Is the sharing economy growing?
Yes, the sharing economy is experiencing substantial growth.
Driven by technological advancements, urbanization, and changing consumer preferences, it’s expanding rapidly across various sectors. Platforms like Airbnb, Uber, and TaskRabbit have become household names, and new sharing economy models are emerging constantly.
What is the concept of a sharing economy?(Sharing Economy Statistics)
The sharing economy is an economic model where individuals collaborate to share goods and resources, transforming physical assets into accessible services. Advances in digital technology have fueled its growth and expansion.
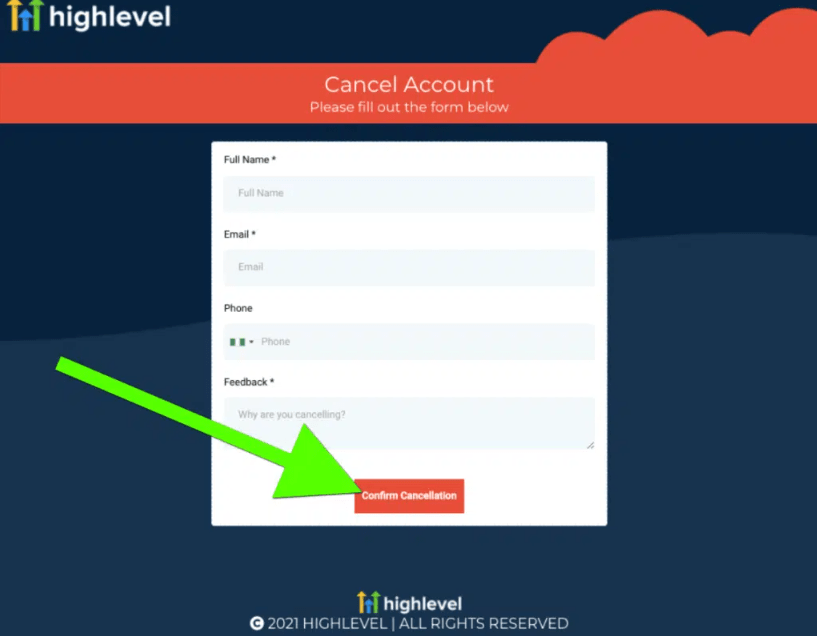
Cancel Gohighlevel Subscription: Tired of the GoHighLevel Cancellation Hassle?
Canceling your GoHighLevel account can be a frustrating ordeal. It involves multiple steps, forms, and waiting around for support. But don’t worry, we’ve got you covered.
Let’s walk you through the cancellation process and explore alternatives to help you decide if it’s the right move.
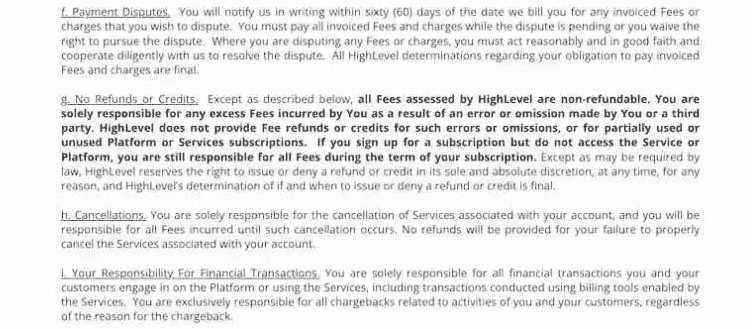
No Refunds: A Note on GoHighLevel Cancellations(Cancel Gohighlevel Subscription)
Unfortunately, GoHighLevel does not provide refunds for canceled subscriptions, even if they are partially used. This policy is outlined in their terms of service.
Don’t Rush to Cancel: Explore These Alternatives(Cancel Gohighlevel Subscription)
Before making a final decision, consider these alternatives to canceling your GoHighLevel account. There might be a solution that better suits your needs.
Need a Break? Pause Your GoHighLevel Account(Cancel Gohighlevel Subscription)
Taking a temporary break from GoHighLevel? Consider pausing your account. This feature allows you to suspend your subscription without incurring charges. It’s a convenient option for those who need a short-term pause.
Note: Pausing is available for paid plans, not free trials.
Adjust Your Plan: Downgrade to a More Affordable Option(Cancel Gohighlevel Subscription)
If you’re finding your current GoHighLevel plan too costly, consider downgrading to a more affordable tier. This allows you to continue using the platform while reducing your monthly expenses.
Note: Downgrades typically take effect at the start of your next billing cycle.
Need More Power? Upgrade Your GoHighLevel Plan(Cancel Gohighlevel Subscription)
Ready to unlock advanced features? Upgrade your GoHighLevel subscription at any time. Unlike downgrades, upgrades take effect immediately, and you’ll only pay for the remaining portion of your billing cycle.
Need More Time? Extend Your GoHighLevel Trial(Cancel Gohighlevel Subscription)
Want to explore GoHighLevel further? Request an extension to your 14-day free trial. This will give you additional time to evaluate the platform before making a decision.
Weighing Your Options: Should You Cancel GoHighLevel?(Cancel Gohighlevel Subscription)
While GoHighLevel is a powerful platform, it might not be the perfect fit for every business. Instead of canceling and losing your data, explore these alternatives:
Downgrade: Opt for a lower-tier plan to reduce costs.
Pause: Temporarily suspend your account without charges.
Extend Trial: Get more time to evaluate the platform.
For clients using your white-labeled version, follow the steps outlined above to cancel sub-accounts.
Remember: There are often solutions beyond a complete cancellation.
Boost your real estate marketing strategy with these eye-opening real estate photography statistics;
The real estate industry is highly competitive, and agents, brokers, and property owners are constantly looking for ways to stand out from the crowd. One often overlooked aspect of real estate marketing is photography. High-quality visuals can make all the difference in attracting potential buyers, increasing engagement, and ultimately driving sales.
But just how important is real estate photography?
Let’s dive into some surprising statistics that highlight the power of photography in real estate.
Key Real Estate Photography Statistics (Real Estate Photography Statistics)
Professional photography boosts sales speed: Real estate listings featuring professional photos sell 32% quicker.
Aerial views accelerate sales: Homes showcased with aerial photography find buyers 68% faster.
Video listings attract more interest: Property listings accompanied by videos generate 403% more inquiries.
Virtual tours drive buyer decisions: In 2020, 63% of homebuyers made offers based solely on virtual tours.
Professional photography investment: The average cost to professionally photograph a home for sale is $230
General Real Estate Photography Statistics (Real Estate Photography Statistics, Trend)
The U.S. real estate photography industry employs over 6,181 people and comprises approximately 6,891 businesses in 2024. (Source)
A significant 63% of homebuyers made purchase offers without physically inspecting the property. (Source)
An overwhelming majority (99%) of homebuyers aged 24 to 57 relied on the internet to search for homes in 2022. (Source)
Properties showcased with professional photography sell 32% faster. (Source)
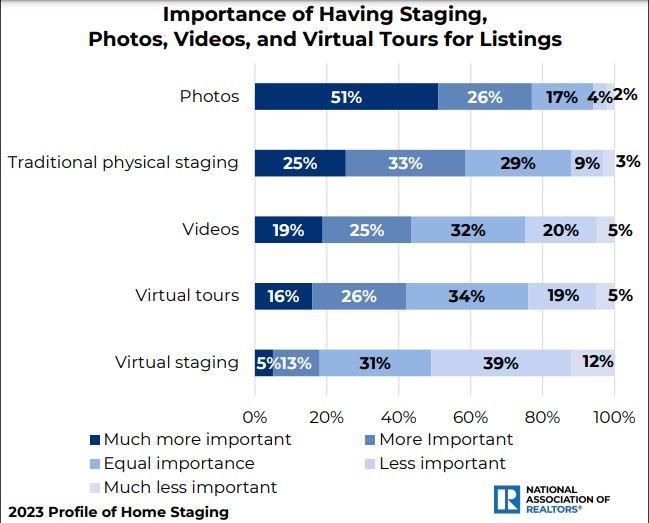
A survey by the National Association of Realtors revealed that the overwhelming majority (77%) of respondents considered photos to be an essential component of real estate listings. Only a small fraction (6%) deemed photos unimportant, with the remaining respondents holding a neutral stance. (Source)
Thoroughly photographing a typical UK property takes around 45-60 minutes. (Source)
The U.S. real estate photography market is projected to generate $268.3 million in revenue by 2024, with a modest 0.6% annual growth rate over the past five years. (Source)
Aerial photography in property listings speeds up sales by 68%. (Source)
Professional property photos increase listing views by 61%. (Source)
Video content generates a staggering 403% more inquiries for real estate listings. (Source)
Almost three-quarters of real estate agents attribute high-quality photography to securing more listings. (Source)
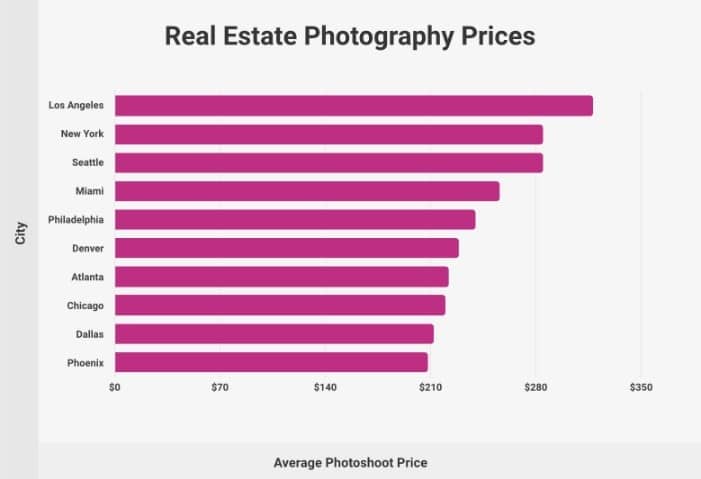
The average cost for capturing and delivering 10 to 25 MLS-ready photographs of a 1,500 to 3,000-square-foot home in Los Angeles is approximately $318. (Source)
Agents utilizing professional photographers earn double the commission ($8,683) compared to those without ($4,292). (Source)
High-quality real estate photos hold viewer interest for an average of 20 seconds. (Source)
Even among the oldest demographic, aged 77 to 97, a significant portion (84%) utilized the internet when searching for a home. This underscores the absolute necessity of compelling real estate photography in property listings. (Source)
Photos remain the top essential feature for 85% of homebuyers on real estate websites, followed by videos (27%) and virtual tours (39%). (Source)
10% of real estate agents employ video marketing for homes. (Source)
Only 15% of property listings feature high-quality photos. (Source)
U.S. real estate photography businesses surged 11.5% from 5,353 to 5,967 between 2022 and 2023. (Source)
The U.S. real estate photography industry is labor-intensive, with wages accounting for 30.5% of costs, followed by purchases (12.8%) and rent/utilities (5.5%). (Source)
As of August 12, 2024, U.S. real estate photographers earn an average annual salary of $62,338. (Source)
Most Realtors (77%) use social media for real estate, with nearly half (47%) considering it the top lead generation source. (Source)
Over 60% of UK consumers deem estate agent photos subpar. (Source)
More than half of buyers desire 8-10 aerial photos per listing, with drone photography increasing in-person viewings by 65%. (Source)
The global drone photography market, valued at $617.6 million in 2023, is projected to reach $3.4 billion by 2033, expanding at a rapid 18.7% annual rate. (Source)
The virtual tour market is poised for substantial growth, soaring from $0.96 billion in 2023 to $17.88 billion by 2035, at an impressive annual growth rate of 27.9%. (Source)
Real estate photographers in the United States can earn a substantial income, with top earners reporting an annual salary of $74,000 as of August 12, 2024. (Source)
Real Estate Photographer Salary(Real estate photography statistics)
Annual Salary
Monthly Pay
Weekly Pay
Hourly Wage
Top Earners
$74,000
$6,166
$1,423
$36
75th Percentile
$71,000
$5,916
$1,365
$34
Average
$62,338
$5,194
$1,198
$30
25th Percentile
$57,000
$4,750
$1,096
$27
Real estate photographers in select U.S. cities command substantially higher salaries than the nationwide average of $62,338. Leading the pack are Soledad, California, with earnings 40.3% above the national average at $87,462, followed by Berkeley, California, and Vineyard Haven, Massachusetts, both offering salaries significantly exceeding the national benchmark. (Source)
High-quality real estate photography can increase online engagement by up to 118%, enhancing property visibility and attracting more buyers. (Source)
Forty percent of property buyers use online video platforms to research homes. (Source)
Buyers value photos (77%), physical staging (58%), videos (74%), and virtual tours (42%) as crucial listing elements, according to buyer’s agents. (Source)
Sellers prioritize photos (89%), physical staging (44%), and videos (44%) as important listing features, based on seller’s agent reports. (Source)
Property listings with videos generate four times more inquiries. Nearly 80% of agents utilize drone media to showcase properties. (Source)
Homebuyers (51%) primarily use YouTube for home research. (Source)
Virtual tours increase property views by 87%, while 54% of buyers disregard listings without high-quality images. (Source)
Century 21’s video social media campaign resulted in a 20% increase in home sales. (Source)
A relatively small percentage of agents, just 35%, utilize the services of professional photographers. (Source)
Emerging Tendencies in Real Estate Photography for 2025 (Real Estate Photography Statistics, Trend)
Drone Photography: A New Altitude for Real Estate (Real Estate Photography Statistics, Trends)
Drone technology has redefined how properties are showcased. By capturing breathtaking aerial perspectives, drones offer an unparalleled view of a property’s size, layout, and surroundings. This innovative approach not only highlights a property’s unique features but also provides buyers with a comprehensive understanding of its location and context.
Beyond capturing stunning exteriors, drones can also offer interior overviews, creating immersive virtual tours. This combination of aerial and interior footage provides a competitive advantage for real estate agents, setting their listings apart in a crowded market. As drone technology becomes increasingly accessible and affordable, it is transforming the real estate industry by offering a fresh and compelling way to present properties.
Virtual Staging: A Digital Makeover (Real Estate Photography Statistics, Trends)
Virtual staging has revolutionized property presentation. By digitally furnishing and decorating empty spaces, this innovative technique transforms ordinary photos into inviting showcases. Unlike traditional staging, which requires physical effort and expense, virtual staging offers a cost-effective and time-efficient solution.
By creating realistic and appealing interior designs, virtual staging helps potential buyers visualize the property’s potential. With its ability to quickly adapt to various styles and preferences, virtual staging has become an indispensable tool for real estate professionals seeking to maximize property appeal and accelerate sales.
Twilight Photography: A Golden Hour for Real Estate (Real Estate Photography Statistics, Trends)
Twilight photography has emerged as a powerful tool in real estate marketing. By capturing properties at dawn or dusk, these images showcase properties in a uniquely captivating light. Studies show that listings with twilight photos receive significantly more views, with those using a twilight shot as the main image experiencing an even greater boost.
Twilight photography highlights a property’s architecture, landscaping, and outdoor amenities in a way that daytime photos cannot. The soft, warm light creates an inviting atmosphere, making properties appear more luxurious and desirable. This trend has exploded in popularity in 2024, thanks to advancements in camera technology and the increasing importance of visually stunning online listings.
Twilight photos are more than just aesthetically pleasing; they are a strategic investment for real estate agents looking to stand out in a competitive market.
HDR Photography: Illuminating Real Estate (Real Estate Photography Statistics, Trends)
HDR photography will remain a cornerstone of commercial real estate imaging in 2024. By merging multiple exposures, this technique produces images with exceptional detail and dynamic range. Particularly beneficial in spaces with stark contrasts like large windows and shadowed corners, HDR captures the full spectrum of light, preventing underexposed or overexposed areas.
While mobile devices offer basic HDR capabilities, professional cameras excel at delivering natural-looking, high-quality results. This technology is essential for showcasing commercial properties in their best light.
Professional photography is indispensable in today’s competitive real estate market. By understanding the latest trends and statistics, agents, sellers, and photographers can leverage visual storytelling to enhance property appeal, accelerate sales, and build stronger brands. The data is clear: exceptional real estate photography drives increased online visibility, quicker sales, higher prices, and greater customer satisfaction. To achieve standout results, invest in top-tier photography and harness the power of every pixel.
Launch Your SaaS Business in a Flash with GoHighLevel SaaS Snapshot
Do you want to build your SaaS business from scratch? GoHighLevel’s SaaS Snapshot is your shortcut to success. This pre-built package includes everything you need to launch your white-labeled SaaS quickly.
GoHighLevel is a cloud-based CRM that simplifies complex business operations. It offers a unified platform for marketing tools, making it easy for businesses of all sizes to manage and grow their customer base. With its user-friendly interface and flexible SaaS pricing, GoHighLevel is a powerful tool for boosting efficiency and achieving business goals.
GoHighLevel’s SaaS Mode (or Pro) lets you rebrand their powerful platform and sell it as your own. But is it worth it? We break down the confusion and tell you exactly who this game-changing option is for. If you loved our HighLevel review, you’ll want to know more.
GoHighLevel SaaS Mode lets you transform the platform into your own branded software and charge clients for access. This means extra income and stronger client relationships. Imagine offering your clients a powerful all-in-one marketing tool while boosting your bottom line. It’s a win-win!
Ready to Start Your SaaS Journey? (Gohighlevel saas Snapshot)
New to HighLevel? Begin with a free Agency Unlimited trial ($297/mo) and then start a SaaS Mode trial. For annual savings, call 1-888-732-4197 and mention Sam.
GoHighLevel’s SaaS Snapshot is your shortcut to success? This pre-built package includes everything you need to launch your white-labeled SaaS quickly.
What’s inside? (Gohighlevel saas Snapshot)
Ready-made website and sales funnels: Attract and convert leads effortlessly.
Automated workflows: Handle tasks like scheduling and payments on autopilot.
Engaging email and SMS campaigns: Build strong relationships with your customers.
Efficient calendars and booking: Manage appointments and bookings with ease.
Powerful forms and surveys: Gather valuable insights from your audience.
Organized pipelines and CRM: Track leads and nurture relationships effectively.
Essential marketing materials: Get started with pre-written templates and scripts.
Don’t waste time building from the ground up. Launch your SaaS business in just one day with GoHighLevel’s SaaS Snapshot.
Important Considerations (Gohighlevel saas Snapshot)
Before diving in, consider these factors:
Cost: Understand the investment required for your chosen snapshot.
Customization: Assess how flexible the snapshot is to match your unique brand.
Technical Expertise: Evaluate your team’s capabilities for handling potential adjustments.
Ready to Launch? (Gohighlevel saas Snapshot)
We hope this guide has helped you understand the potential of GoHighLevel’s SaaS Snapshot. If you’re excited to get started, click below to explore your options.
Here are the best and most surprising Data-Driven Decision Making Statistics You Should Know in 2025 and beyond;
In today’s fast-paced business landscape, making informed decisions is crucial for success. Gone are the days of relying on gut instincts and anecdotal evidence. Instead, companies are turning to data-driven decision-making to drive growth, improve efficiency, and stay ahead of the competition.
What Is Data-Driven Decision Making?(Data-Driven Decision Making Statistics)
Data-driven decision-making is the process of using data analysis and insights to inform strategic choices. It’s about moving beyond assumptions and personal biases to make decisions based on evidence, patterns, and trends.
But just how widespread is the adoption of data-driven decision-making? And what are the benefits of using data to inform business strategy? Let’s dive into the numbers and explore data-driven decision-making statistics that will revolutionize your business strategy.
Key Data Points on Data Driven Decision Making(Data Driven Decision Making Statistics)
Data is becoming essential: Over 90% of enterprises recognize data’s growing importance, with nearly half making most decisions based on data.
Data drives financial gains: Organizations leveraging big data analytics report an average 8% revenue boost and 10% cost reduction.
A data-driven culture is prevalent: Three-quarters of leaders in data-forward companies rely exclusively on data for decision-making.
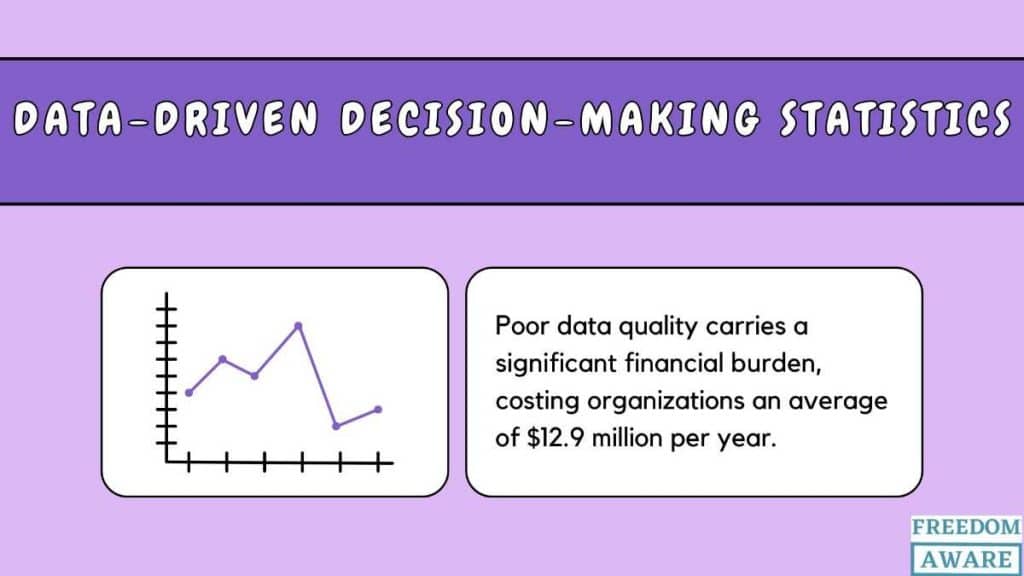
Challenges persist: While data is crucial, only about half of data professionals have high confidence in its quality. Improving data integrity is a top priority.
The future is data-centric: The overwhelming majority of organizations anticipate an even greater reliance on data for decision-making in the coming year.
Data’s impact on sales: Data-driven strategies will surpass gut instinct in over two-thirds of B2B sales organizations within the next few years.
Statistics on Data-Driven Decision Making Adoption(Data Driven Decision Making Statistics)
Companies typically rely on an average of five internal data sources for decision-making. (Source)
Data-driven strategies will outperform gut feelings in 65% of B2B sales organizations by 2026. (Source)
Over 40% of companies are using big data analytics, but there’s still significant room for growth. (Source)
A vast majority about 90% of enterprises recognize data as a critical business driver. (Source)
A quarter of organizations primarily base strategic decisions on data, while nearly half rely on it heavily. (Source)
The vast majority of companies recognize the strategic importance of data and analytics. (Source)
Many companies are starting to view information as a valuable asset, with even more planning to do so in the future. (Source)
83% of CEOs want their organizations to be more data-driven. (Source)
87% of CXOs said being an intelligent enterprise is their top priority. (Source)
33% are comfortable questioning KPIs and metrics used in organizations. (Source)
29% are asked to communicate using data-driven methods. (Source)
30% say actions are driven by data analysis. (Source)
34% find it easy to find internal or external collaborators that can help. (Source)
While global adoption of data-driven decision-making surged by 12% between 2018 and 2020, only half of organizations reported making decisions primarily based on data. (Source)
Fewer than one-third of enterprises currently use data to identify new opportunities, but most intend to leverage it for this purpose. (Source)
A top-down approach is the most common decision-making style, with collaborative methods lagging. (Source)
According to a survey, executives in leading data-driven companies rely exclusively on data to guide their decision-making. ( Source)
In 2021, roughly two-thirds of European and U.S. data and analytics leaders reported having a corporate initiative to become more data-driven. Only 3% lacked such an initiative and planned to remain so. (Source)
A majority of C-suite executives acknowledge that their companies rely minimally on data to guide decision-making. (Source)
A large majority of leading marketers indicate that data informs decision-making at every level of their organizations. (Source)
Almost 40% of business leaders say their company makes decisions heavily relying on data, highlighting a strong trend toward data-driven practices. (Source)
Data privacy has emerged as a paramount concern in light of regulations like GDPR and CCPA. (Source)
Global marketing leaders primarily leverage data-driven strategies for email marketing (47%) and customer journey mapping (46%). (Source)
In 2020, the respondents surveyed demonstrated a 12 percent increase in implementing data-driven decision-making within their global organizations when compared to 2018. (Source)
In 2020, a leading 65% of organizations in the banking sector utilized data-driven decision-making. (Source)
Data Driven Decision Making Statistics: Impact and Profitability
A recent study revealed that 85% of Singaporean business leaders experience decision distress, but they hold a strong belief that data can enhance decision-making, reduce risk, and increase preparedness for unforeseen circumstances. (Source)
Data-driven decision-making, prioritized by 77% of data and analytics professionals, delivers tangible benefits: operational efficiency (73%), cost reduction (62%), revenue generation (59%), and regulatory compliance (57%). (Source)
A significant gap exists between the potential of data and analytics and its actual integration into corporate strategy. Less than 50% of documented strategies highlight it as essential for delivering value. (Source)
Organizations leveraging big data analysis see significant gains: 8% revenue growth and 10% cost reduction. Top benefits include improved strategic decision-making (69%), optimized operational processes (54%), deeper customer insights (52%), and cost reduction (47%). (Source)
Best-in-class companies rely less on gut feelings (40%) than laggards (70%) for decision-making. (Source)
68% of companies that grew revenue within a year used market research to drive their success. (Source)
pen data access is strongly linked to higher performance, as leading marketers are 1.6 times more likely to believe in this connection. (Source)
Data-driven organizations significantly outperform others, boasting 23 times higher customer acquisition, six times greater customer retention, and 19 times higher profitability. (Source)
Businesses using big data saw an 8-10% profit increase and a 10% cost reduction. (Source)
Implementing data programs not only yields positive results (44%) but also fuels further demand for data (46%), suggesting that high-quality data drives business success. (Source)
Common Hurdles in Data DrivenDecision Making (Data Driven Decision Making Statistics)
Data quality (36%), integration (60%), and integrity (50%) remain major challenges, hindering trust in data for decision-making. Only 46% of data professionals have high confidence in its use, highlighting the need for improvement. (Source)
It’s not all sunshine and rainbows in the data-driven world. For every 10 organizations successfully using data, 23 are still trying to figure it out. (Source)
Poor data quality carries a significant financial burden, costing organizations an average of $12.9 million per year. (Source)
Half of all businesses lack clarity on their data and AI needs, hindered by data complexity. (Source)
Despite the abundance of data, organizations are only utilizing 50%, missing out on a significant opportunity to make more informed decisions. (Source)
Senior executives overwhelmingly agree that eliminating organizational silos is critical for leveraging data and analytics to make better decisions. (Source)
According to Qlik research, 45% of C-suite executives make decisions based on gut feeling, and 42% doubt data accuracy. (Source)
92% of business leaders asserted that the increasing number of data sources has limited their organizations’ progress. Also, 73% of business leaders agree that their distrust of data has prevented them from making decisions. (Source)
Gut instinct drives most decisions in 58% of companies, according to a survey. (Source)
While data-driven organizations experience a threefold improvement in decision-making, a significant portion (62%) of executives still prioritize experience and advice over data. (Source)
Targeting segmented audiences (50%) and ensuring real-time decision-making and data quality (33%) are major hurdles for marketers seeking to embrace data-driven practices. (Source)
Technology and Tools Usage Statistics (Data Driven Decision Making Statistics)
Organizations excelling in performance are significantly more likely to leverage advanced technology for risk analysis, stakeholder identification, and change management compared to their underperforming counterparts. (Source)
Businesses using predictive data analytics reported an average revenue increase of 15%. (Source)
Effective use of predictive analytics can boost operating margins by as much as 60%. (Source)
The predictive analytics market is set to skyrocket from $11.5 billion in 2023 to $61.9 billion by 2032, with a robust annual growth rate of 21.2% from 2024 to 2033. (Source)
The global decision intelligence market is booming, surging from $10.64 billion in 2022 to a projected $36.06 billion by 2030, driven by a 16.5% annual growth rate. (Source)
83% of enterprises consider predictive data analytics critical for staying ahead. (Source)
Data Driven Decision Making Statistics
Asia Pacific was expected to spend US$42.2 billion ($57 billion) on big data and analytics. (Source)
The decision dilemma is creating havoc in the business world, with 87% of business leaders suffering decision distress. (Source)
Italian managers highlight speedier decisions, better operations, and product innovation as key benefits of data-driven approaches, with data monetization less emphasized (14%). (Source)
In 2020, a leading 77% of U.S. organizations utilized data-driven decision-making. (Source)
Data overload is crippling Singaporean business leaders, causing decision paralysis (63%), mistrust (87%), and a desire for automated decisions (76%). (Source)
Less than 50% of companies agree that information is highly valued for decision-making or treated as an asset in their organization today, but two-thirds believe it will be in the future. (Source)
Finance leads data management and governance (60%), with IT playing a supporting role (41%), but sole IT responsibility is rare (10%). (Source)
Leading marketers are significantly more likely (72%) to invest in enhancing first-party data quality and quantity compared to their peers. (Source)
Data quality is a major issue for 70% of data professionals struggling with data trust, with 53% seeing it as crucial for data integrity. (Source)
Data-leading organizations boast a 70% higher rate of easy data access compared to data-aware ones. (Source)
More healthcare data is being collected in Africa than anywhere else in the world. (Source)
A vast majority of CEOs (83%) aim to transform their organizations into data-driven powerhouses. (Source)
Data Driven Decision Making Trends (Data Driven Decision Making Statistics)
Trend 1: The Rise of Artificial Intelligence(Data-Driven Decision Making Statistics)
Traditionally reliant on human intuition, decision-making often leads to subjective biases and inaccurate outcomes. AI is revolutionizing this process by providing objective analysis, real-time insights, and predictive capabilities. By identifying hidden patterns and continuously learning, AI empowers organizations to make data-driven choices that outperform traditional methods and drive operational efficiency.
Trend 2: Harnessing Advanced Analytics(Data Driven Decision Making Statistics)
Advanced analytics techniques are transforming how businesses operate by uncovering hidden risks, predicting market shifts, and optimizing processes. These insights enable organizations to deliver exceptional customer experiences and gain a competitive edge through proactive decision-making.
Trend 3: The Era of Hyper-Personalization(Data Driven Decision Making Statistics)
The one-size-fits-all approach is obsolete. By leveraging customer data, businesses can create highly personalized experiences, recommendations, and services. This level of customization fosters stronger customer relationships and drives business growth.
Trend 4: Cloud-Powered Transformation(Data Driven Decision Making Statistics)
The shift to cloud-based data management is accelerating. Cloud platforms offer unparalleled scalability, flexibility, and cost-efficiency. Coupled with advanced analytics and machine learning tools, the cloud empowers organizations to extract maximum value from their data. This leads to faster insights, improved collaboration, and the ability to handle massive datasets.
Conclusion: (Data Driven Decision Making Statistics)
In today’s competitive environment, data-driven decision-making is no longer a luxury, it’s a necessity for business survival and growth. By embracing a data-driven approach, companies can:
Minimize risk and make informed choices.
Increase efficiency and optimize operations.
Enhance customer satisfaction and loyalty.
Gain a competitive edge and drive sustainable growth.
FAQ (Data Driven Decision Making Statistics)
Why does decision-making require data?(Data Driven Decision Making Statistics)
Data-driven decision-making unlocks valuable insights into customer behavior, preferences, and needs. By analyzing customer data, businesses can precisely segment their customer base, tailor offerings to individual preferences, elevate customer experiences, and create highly targeted marketing campaigns.
What are some examples of data driven decision making?(Data Driven Decision Making Statistics)
Uber leverages data, algorithms, and predictive models to optimize driver allocation by accurately estimating travel times. Conversely, Starbucks utilizes data analytics to understand customer preferences and purchasing behavior.
How effective is data driven decision making?(Data Driven Decision Making Statistics)
Data-driven decision-making is a catalyst for operational efficiency. By uncovering bottlenecks, redundant processes, and areas for improvement, organizations can optimize resource utilization and streamline workflows, leading to substantial performance gains.
What is data driven decision making theory?(Data Driven Decision Making Statistics)
Data-driven decision-making is a strategic approach that leverages facts, metrics, and data analysis to inform business choices that directly contribute to the achievement of organizational goals and initiatives.
Here are the latest and best Gohighlevel saas Pricing information to help you in 2025 and beyond;
GoHighLevel: Your All-in-One Business Growth Platform(Gohighlevel Saas Pricing)
GoHighLevel is a cloud-based CRM that simplifies complex business operations. It offers a unified platform for marketing tools, making it easy for businesses of all sizes to manage and grow their customer base. With its user-friendly interface and flexible SaaS pricing, GoHighLevel is a powerful tool for boosting efficiency and achieving business goals.
GoHighLevel’s SaaS Mode (or Pro) lets you rebrand their powerful platform and sell it as your own. But is it worth it? We break down the confusion and tell you exactly who this game-changing option is for. If you loved our HighLevel review, you’ll want to know more.
GoHighLevel SaaS Mode lets you transform the platform into your own branded software and charge clients for access. This means extra income and stronger client relationships. Imagine offering your clients a powerful all-in-one marketing tool while boosting your bottom line. It’s a win-win!
GoHighLevel offers a range of pricing options to suit different business needs. Their flagship SaaS plan, packed with powerful features, is available for $497 per month. For those seeking more tailored solutions, GoHighLevel provides specific plans designed to cater to various business sizes and requirements.
Designed for growing businesses, the Agency Unlimited plan expands on the Starter plan with:
Unlimited user accounts
Advanced CRM capabilities
SMS messaging, custom domains, and advanced integrations
Facebook and Google Ads integration
Phone and chat support
Advanced reporting, customizable funnels, and workflow builder
Ideal for teams and agencies needing more flexibility and scalability. Upgrade to White Label capabilities for added power.
Start your 14-day free trial and discover the Agency Unlimited difference.
Plus, don’t miss our top-tier SaaS plan for advanced users and resellers.
At the heart of GoHighLevel is a robust platform packed with features to streamline your operations. From contact management and automation to sales pipelines and marketing tools, it’s designed to boost your efficiency.
SaaS Mode: Resell and Reap (Gohighlevel saas Pricing)
For agencies and entrepreneurs looking to create a recurring revenue stream, GoHighLevel’s SaaS mode is a game-changer. At $497 per month, you can white-label the entire platform and sell it under your brand, keeping 100% of the profits.
GoHighLevel offers a flexible pricing structure designed to meet the needs of businesses and agencies of all sizes. With plans ranging from the budget-friendly Starter to the powerful Unlimited and customizable SaaS options, you can find the perfect fit for your growth strategy.
Ready to supercharge your business? Start your 14-day free trial today and experience the GoHighLevel difference.
GoHighLevel SaaS Mode: Your Agency’s Secret Weapon?
GoHighLevel’s SaaS Mode (or Pro) lets you rebrand their powerful platform and sell it as your own. But is it worth it? We break down the confusion and tell you exactly who this game-changing option is for. If you loved our HighLevel review, you’ll want to know more.
GoHighLevel SaaS Mode lets you transform the platform into your own branded software and charge clients for access. This means extra income and stronger client relationships. Imagine offering your clients a powerful all-in-one marketing tool while boosting your bottom line. It’s a win-win!
Ready to Start Your SaaS Journey?(Gohighlevel Saas Mode)
New to HighLevel? Begin with a free Agency Unlimited trial ($297/mo) and then start a SaaS Mode trial. For annual savings, call 1-888-732-4197 and mention Sam.
SaaS Mode offers a dual advantage. Your clients get a robust platform with features like messaging, chat, reputation management, and more. As the agency, you enjoy tools for managing your SaaS business, including automated billing, user management, and account snapshots. It’s a win-win!
SaaS Mode: Worth the Investment?(Gohighlevel Saas Mode)
GoHighLevel‘s SaaS Mode is a game-changer for established agencies. It opens new revenue streams and deepens client relationships. However, it’s a significant investment.
SaaS Mode can be a profitable venture if you’re an agency with a solid client base. But for those starting from scratch, building a brand around a white-labeled platform is challenging. Differentiation is key.
Ultimately, the decision depends on your business model and goals.
White labeling means using someone else’s product as your own. You pay a fee to use their software and rebrand it under your business name.
GoHighLevel SaaS Mode: A Game-Changer
GoHighLevel’s SaaS Mode is a groundbreaking tool for agencies. It’s a fantastic opportunity to expand your offerings, boost revenue, and create a loyal customer base. No other platform offers this level of white-labeling capability.
However, it’s a significant investment. Carefully consider your client base and potential market before diving in. Survey your clients to gauge interest in additional marketing tools. This will help determine if SaaS Mode is the right move for your business.
Ultimately, GoHighLevel SaaS Mode has the potential to revolutionize your agency.