

Focus: web3 statistics
Introduction web3 statistics
The term “Web3” invokes visions of decentralised platforms, blockchain-powered infrastructures, NFTs, token economies, and a transformation of the internet as we know it. Yet, to truly unlock its potential — whether as investor, marketer, entrepreneur or affiliate partner — you need data, not hype. That’s where web3 statistics come in: they provide evidence, benchmarks, and insights you can use.
In this article we present over 60 recent statistics on the Web3 ecosystem, drawn from multiple trusted sources and market-reports. We don’t just list them — we critically analyse and compare the numbers, highlight discrepancies, explore implications, and show you how to leverage them to convert customers, build credibility and drive action.
Whether you’re building a Web3-related business, promoting software, or simply want to stay ahead of the curve — these stats will give you the facts you need.
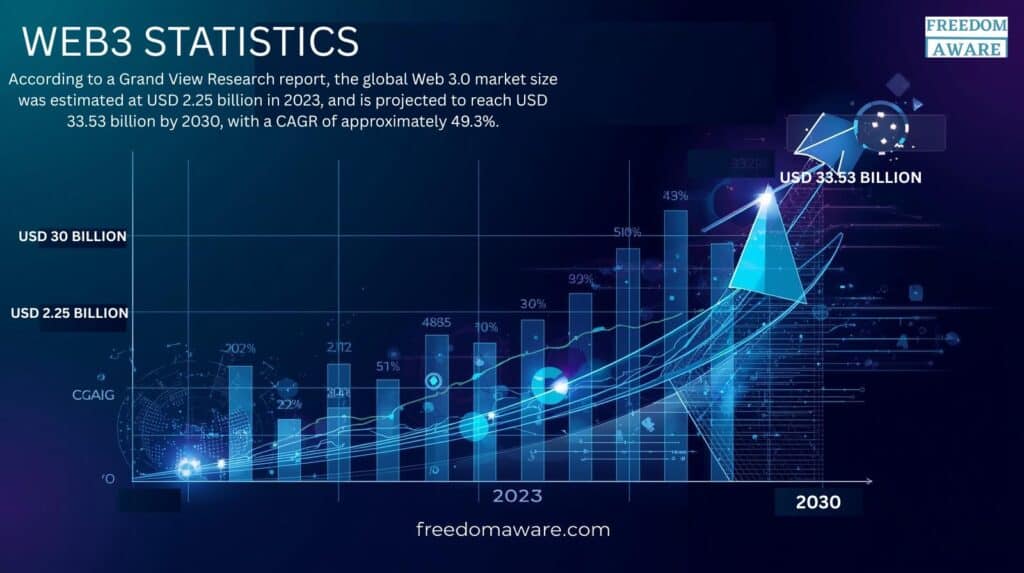
- According to a Grand View Research report, the global Web 3.0 market size was estimated at USD 2.25 billion in 2023, and is projected to reach USD 33.53 billion by 2030, with a CAGR of approximately 49.3%. (Grand View Research)
- Another source (Market.us) estimates the global Web3 market will reach USD 6.63 billion in 2024, and balloon to USD 177.58 billion by 2033, with a CAGR of ~44.1%. (Market.us)
- GTIA’s blog estimates the market value in 2023 at USD 2.86 billion with a growth outlook leading to about USD 49.1 billion by 2030. (gtia.org)
- IMARC Group reports that the Web 3.0 blockchain market size was USD 3.73 billion in 2024 and is projected to reach USD 99.78 billion by 2033 at a CAGR of ~41.87%. (IMARC Group)
- Market Research Future estimates the Web3 marketing market size alone at USD 1.97 billion in 2024, forecast to reach USD 26.15 billion by 2035 (CAGR ~26.5%). (Market Research Future)
Analysis & comparison (web3 statistics):
- There is a wide range of estimates: some reports see tens of billions by 2030, others hundreds of billions by 2033.
- The differing numbers reflect variations in scope (Web3 vs Web3 marketing vs Web3 blockchain), base years, methodology, and definitions of what constitutes “Web3”.
- For conversion or affiliate marketing: emphasise the growth potential (even the most conservative estimate shows multi-billion USD growth) to create urgency and opportunity for your audience.
Section 2 (web3 statistics): Adoption & User Engagement
- A survey by ConsenSys shows that approximately 93% of people surveyed were aware of cryptocurrencies (up from 92% in the previous year). (Consensys – The Ethereum Company)
- The same report shows participation in 10 out of 11 Web3 activities rose year-over-year: e.g., collecting NFTs (+3 pts), using DeFi (+4), Web3 wallets (+6). (Consensys – The Ethereum Company)
- According to Triple-A, global cryptocurrency ownership averaged 6.8% of the population in 2024, equating to over 560 million cryptocurrency users worldwide. (Triple-A – Triple-A)
- An article states that Web3 application daily active users hit an all-time high of 10 million in July 2024 — a 40% increase compared to the previous quarter. (BanklessTimes)
- A Medium analysis notes Web3 adoption remains relatively low — for example a consumer adoption rate of just ~6.8% in 2024. (Medium)
Insights (web3 statistics):
- Awareness is near universal among crypto-aware users, but deep adoption (regular use of Web3 apps) remains modest.
- These stats help you: emphasize that you are reaching ground-floor opportunity (low adoption means high growth potential).
- Also emphasise tools or platforms that simplify access (for example: wallet integrations, user-friendly DeFi).
Section 3 (web3 statistics): Sector-Specific Growth (Gaming, Social, Marketing)
- The global Web3 gaming market is expected to reach USD 182.98 billion by 2034, up from USD 37.55 billion in 2025 (CAGR ~19.24%). (Precedence Research)
- Market.us reports the U.S. Web3 social media platform market was valued at USD 2.18 billion in 2024, with a projected CAGR of 48.6%. (Market.us)
- EsparkInfo reports that Web3 adoption in social apps stands at ~8.9%, while games stand at ~5.7%. (eSparkBiz Technologies Pvt Ltd)
- The Web3 marketing market is estimated at USD 1.97 billion in 2024 and forecast to reach USD 26.15 billion by 2035. (Market Research Future)
Interpretation (web3 statistics):
- Web3 isn’t monolithic: gaming, social media, marketing each have their own trajectories and adoption curves.
- For an affiliate or marketer: tailor your appeals by sector. If you’re promoting a Web3 gaming platform, highlight its massive forecast. If marketing Web3 social tools, emphasise the steep growth rate.
- Use these stats to segment your audience: e.g., “Over ~9% of social apps already integrate Web3 features”.
Section 4 (web3 statistics): Regional & Industry Variations
- IMARC Group states North America held over 37.2% of the global Web 3.0 blockchain market in 2024. (IMARC Group)
- Grand View Research noted North America accounted for 37.3% global market share in 2023. (Grand View Research)
- GTIA indicates North America held ~34% of the global Web3 market, Europe ~24% and Asia-Pacific ~18%. (gtia.org)
- Another study shows the Asia-Pacific region is projected to be the fastest growing during 2024-2030. (Grand View Research)
Takeaway (web3 statistics):
- Geographically there is a clear concentration in North America today, but rapid growth in Asia-Pacific means your strategies should consider regional tailoring.
- As you build content or affiliate campaigns, consider localisation (e.g., for Africa/Nigeria) to capture under-served markets.
Section 5 (web3 statistics): Risks, Security & Challenges
- According to Beosin’s Global Web Security Report, the total losses from hacks, phishing scams and rug-pulls in Web3 reached USD 2.513 billion in 2024. (beosin.com)
- A blog on Web3Auth points to fragmentation, scalability issues and awareness gaps as key challenges holding back mass adoption. (blog.web3auth.io)
Why this matters (web3 statistics):
- As you market Web3 products or services, don’t ignore the risk side — savvy customers will ask about security, regulation and trust.
- Use these stats to show transparency and position your referral or product as addressing the challenge. E.g., “Secure Web3 wallet with audit trail — mitigates part of the $2.5B+ losses in 2024”.
Section 6 (web3 statistics): Technology, Developer & Talent Trends
- Ekolance’s 2024 Developer Report shows experienced developers comprise ~70% of blockchain code commits, signalling talent concentration. (EkoLance)
- EsparkInfo reports more than 18,000 Web3 creators worldwide, indicating a growing global talent pool. (eSparkBiz Technologies Pvt Ltd)
Actionable insight (web3 statistics):
- If you’re promoting Web3 education, platforms, or developer tools — emphasize that Web3 talent is expanding, but still relatively niche, which means demand and value are high.
- Use messaging like: “Become part of the 18,000+ Web3 creators building the next internet wave”.
Section 7 (web3 statistics): Key Highlights of Web3 Statistics
Here’s a condensed list (grouped by theme) of further data:
Growth & Market Size (web3 statistics)
- Web 3.0 market size is estimated at USD 2.25 billion (2023) → USD 33.53 billion (2030). (Grand View Research)
- USD 6.63 billion in 2024, reaching USD 177.58 billion by 2033 (CAGR ~44.1%) (Market.us)
- Web 3.0 blockchain market size USD 3.73 billion (2024) → USD 99.78 billion (2033) (IMARC Group)
- Web3 gaming market USD 37.55 billion (2025) → USD 182.98 billion (2034) (Precedence Research)
- Web3 social media platforms market (US) USD 2.18 billion in 2024; CAGR ~48.6% (Market.us)
Adoption & Usage (web3 statistics)
- 93% of people surveyed are aware of crypto; participation up across types of Web3 activities. (Consensys – The Ethereum Company)
- Over 560 million global cryptocurrency users; ~6.8% of world population. (Triple-A – Triple-A)
- Web3 apps hit ~10 million daily active users in July 2024 (+40% quarter-on-quarter) (BanklessTimes)
- Web3 adoption in social apps 8.9%, games 5.7%. (eSparkBiz Technologies Pvt Ltd)
Regional & Industry Insights (web3 statistics)
- North America ~37%+ share of Web3 market; Asia-Pacific fastest growth region. (IMARC Group)
- Europe ~24% share, Asia-Pacific ~18% in one estimate. (gtia.org)
Risk & Security (web3 statistics)
- USD 2.513 billion losses from hacks, phishing and rug-pulls in Web3 in 2024. (beosin.com)
- Fragmentation, user awareness and scalability remain major hurdles to mass adoption. (blog.web3auth.io)
Talent & Tools (web3 statistics)
- 18,000+ Web3 creators globally (EsparkInfo) (eSparkBiz Technologies Pvt Ltd)
- 70% of blockchain code commits contributed by experienced developers (Ekolance) (EkoLance)
Section 8 (web3 statistics): What These Web3 Statistics Mean for You
1. Positioning & Urgency
Use the high growth projections in your marketing messaging: “Web3 market expected to grow at 40-50%+ annually — seize your share now.”
The urgency combined with early adoption stats creates a powerful conversion tool.
2. Risk-Balanced Messaging
Prospects aware of Web3’s potential will also be cautious about risks. Use the security statistics to build trust: “Despite USD 2.5B in losses last year, our platform is audited, insured and built with secure architecture.”
3. Niche Segmentation
Break out sectors: gaming, social, marketing — tailor your affiliate offers or products accordingly. Example: “If you’re a game developer, the Web3 gaming market is forecast to hit ~$182B by 2034.”
4. Regional Relevance
Highlight how Web3 adoption in under-penetrated markets presents opportunity. Use global stats but localise: “Global adoption might be 6.8% — your region could be next.”
5. Technical Talent Angle
For B2B offers or developer-tools, emphasize the talent supply/demand gap: “Only 18,000+ Web3 creators now — the competition is still low, which means premium value for your skills or platform.”
Section 9 (web3 statistics): Final Thoughts
The era of Web3 is not a distant future—it’s unfolding now. The statistics above show both the promise and the challenges. For savvy affiliates, entrepreneurs and marketers, these web3 statistics are your toolkit: you’ve got the growth, you’ve got the user-data, you’ve got the sectors poised to explode (gaming, social, marketing). What remains is execution.
Your role is to interpret these numbers into compelling stories, trust-building content, and clear calls-to-action. Use them to show that you are not just following trends—you are referencing facts, projections and credible insights.
If you’re ready to act now, download our free “60+ Web3 Statistics” report, join our affiliate offers and start positioning yourself ahead of the curve. The growth window is wide open — and the data says now is your time.